Wednesday, December 4, 2019

November vehicle sales: the consumer is alright, producers not contracting


 - by New Deal democrat

Vehicle sales are a significant short leading indicator. They tend to react after housing, but before broader consumer sales. Although domestic vehicle manufacturers are now reporting only quarterly rather than monthly, this metric is still an important one to watch.

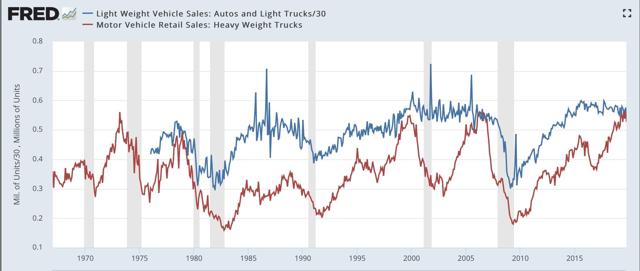
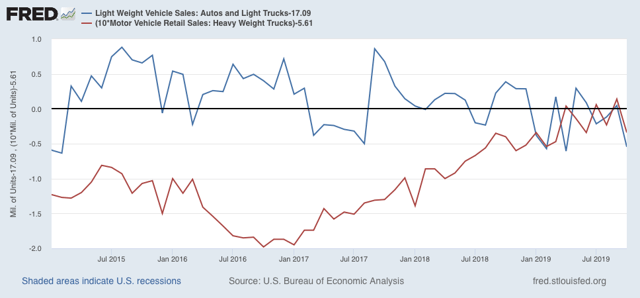
Yesterday car and light truck sales were reported at 17.09 million units annualized for November (blue in the graphs below). Heavy trucks were reported at .561 million annualized (red):


Note that heavy truck sales are a much clearer indicator, declining typically by about -20% a number of months before the onset of a recession (with 1969 being the exception). Car sales typically have declined by more than -10% on a three month rolling average, and it is much more difficult to distill signal from noise.

With that in mind, here is the last five years, including the 2015 peak for car sales. Since FRED carries the data with a one month delay, I have subtracted the November reading from each, so that the respective November numbers if shown would be zero:


While heavy truck sales have turned flattish this year, November is still extremely close to the peak readings. Car sales averaged for the past three months are only a little more than -5% off peak.

As I’ve been saying a lot recently, the consumer is still alright. Meanwhile businesses may not be expanding, but they’re not meaningfully contracting either.

Tuesday, December 3, 2019

Forecasting the 2020 election: the economic baseline (or, don’t count on a recession)


 - by New Deal democrat

Four years ago, I decided to use my set of “long leading indicators” to forecast the 2016 election. The indicators were very weakly positive, and pointed to a narrow popular vote win for the incumbent party one year out. This prompted Nate Silver to huff and puff that nobody knew anything about what the economy would look like so far off. One year later, the economy was very weak, the downward move in the unemployment rate had stalled, and the incumbent won the popular vote narrowly (but obviously not the Electoral College vote).  

Well, the 2020 election is 11 months away. So it’s time to do the impossible again.

As I wrote four years ago, going back 160 years, roughly 3/4 of all US Presidential election results have correlated positively with whether or not at the time of the election campaign, the US was in a recession or not. More than 2/3 of the time, it accurately predicted the Electoral College winner, and 80% of the time, it accurately showed the winner of the populat vote.  In fact, if we simply go by the metric of whether or not the US was in recession during the 3rd Quarter of the election year, then 84% of the time the winner of the popular vote was from the incumbent party if the economy was expanding, and from the opposition party if the economy was in recession. (The list of all of the elections, the economic status, and the victor in each election, is available at the link above).

In only 3 of the 11 cases where there has been a recession in the 3rd or 4th Quarter of the election year has the incumbent party been successful maintaining control of the White House. Contrarily, of the 29 times the economy has been expanding during the 3rd and 4th Quarter of an election year, the incumbent party has retained control of the White House nearly 3/4 of the time. If we go by popular vote rather than electoral college result, that average increases to over 80% (Both the 2000 and 2016 elections fall into this category, where there was no recession, the incumbent party won the popular vote, but the electoral college resulted in the opposition candidate being declared the winner). 

So, with the election one year off, let’s take a look at “Will there be a recession on  Election Day? The simple answer is, left to its own devices, almost certainly not.

Several months ago, analyzing the long leading indicators, I wrote that economic conditions would start to improve by about midyear 2020. Although there has been some deterioration in several long leading metrics since then, that result has remained the same. Below I go through all of the same indicators (7 in all) and their status now. Remember that they suggest how the economy will be 12+ months out.

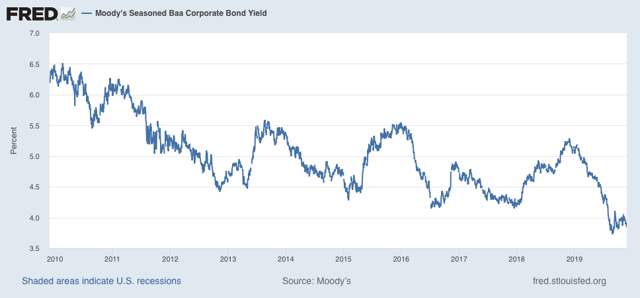
1. Corporate bond yields fell to new expansion lows a few months ago:


This is a positive.

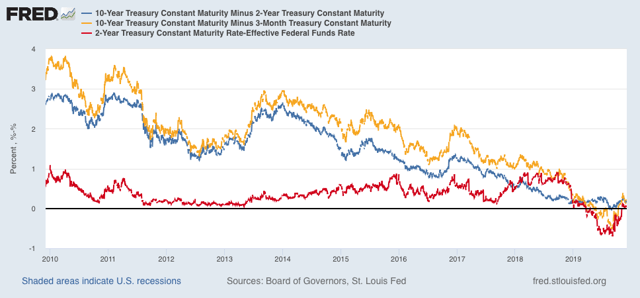
2. The yield curve has in-inverted. When  a recession has begun after an un-inversion, it has been within the next eight months (for our purposes, by the end of Q2 next year). Further, the Two year minus Fed funds metric never inverted enough to be consistent with a recession: 


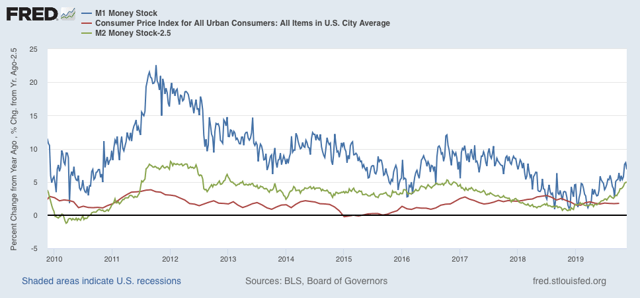
3.  Real money supply has turned back to very positive:


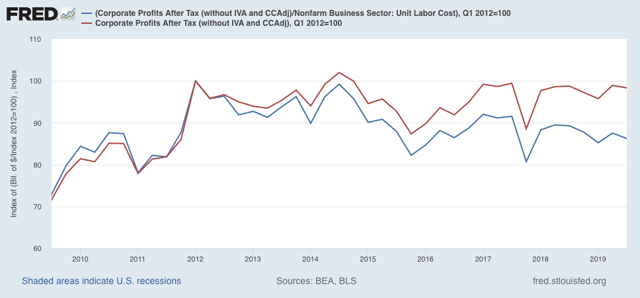
4.  Corporate profits adjusted by unit labor costs give a mixed result. Both are lower then their peak, from way back in 2012. But only one version has declined enough to be consistent with an oncoming recession:


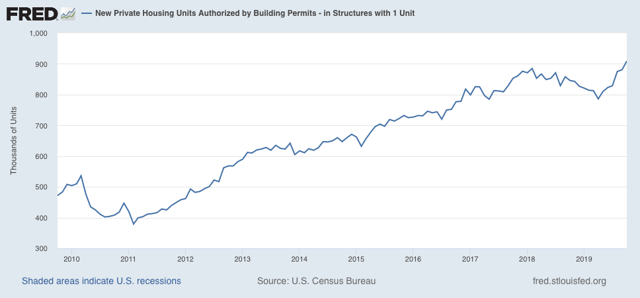
5.  Housing permits have rebounded sharply in recent months:


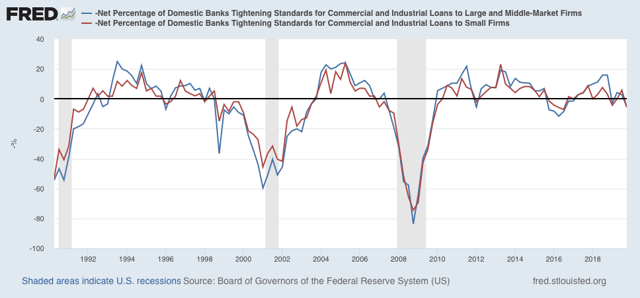
6.  Credit conditions are mixed. The Senior Loan Officer Survey has turned negative, although not by much:


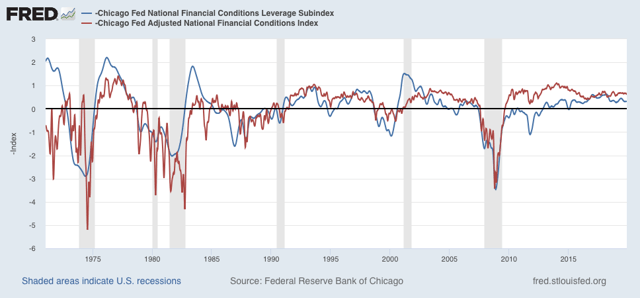
While the Chicago Adjusted National Financial Conditions Index remains positive:


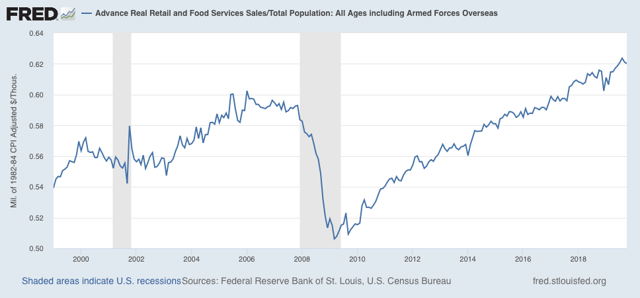
7.  Real retail sales per capita have been flat for a couple of months, but recently increased sharply and peaked in August:


To  summarize, three of the seven indicators are unequivocally positive: corporate bond yields, housing permits, and real money supply; three are mixed: the yield curve, credit conditions, and corporate profits (with the period of overlap among the negative iterations being limited to the 3rd Quarter); and one is negative, but only slightly compared with its recent 3rd Quarter peak: real retail sales per capita. 

So, while it is possible that a recession could be upon us in the 3rd or 4th Quarter of next year, if the economy is left to its own devices it is unlikely. (although Tarriff Man will do his best to undermine this). 

Obviously, this is an argument for an incumbent party popular vote victory. But there have been 10 cases where the economy has been in expansion and the incumbent party’s nominee still lost. One was the “jobless recovery” of 1992. Almost all the others have involved war (1952, 1968), civil discord or scandal (1968 again, 1976, 2000), or a disliked incumbent party candidate and/or a party split (1912, 1992, 2016).  

In short, the overall economic picture is a baseline. Non-economic factors having to do with the President’s personality or record do come into play as well (as will be explored by several other models). And it’s already quite clear that 2020 is going to include both civil discord and scandal.

Monday, December 2, 2019

December starts out with a thud


 - by New Deal democrat

The first reports in December are in, and both were negative.

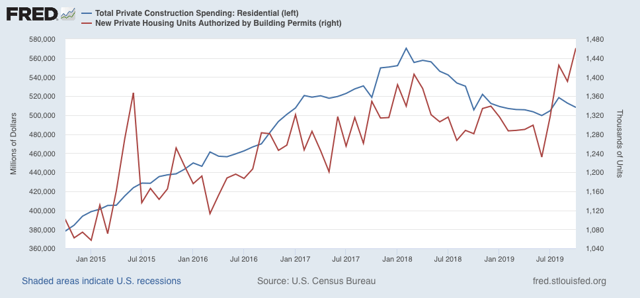
Let’s start with construction spending. Overall construction spending declined -0.8% in October. The more leading residential construction spending declined -0.9%, the second decline in a row (blue in the graph below):


Since actual spending on residential construction doesn’t take place until the house is started, it lags building permits (red in the graph above). So given the strong rebound in permits, I’m not concerned at this point about a renewed decline in construction, as I expect it will follow permits as well.

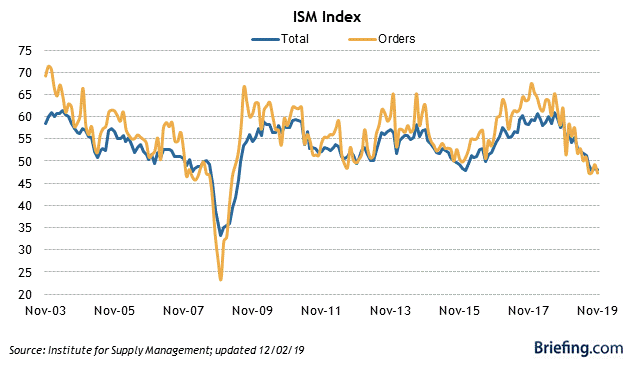
The same can’t be said for the second negative piece of news this morning, in the ISM manufacturing index. The overall index came in at 48.1, while the more leading new orders index came in at 47.2:


In the past it has typically taken at least two readings below 48 for the overall ISM manufacturing index to indicate recession, so the main indication here is that manufacturing may be in a shallow recession, but the economy as a whole is close to flat.

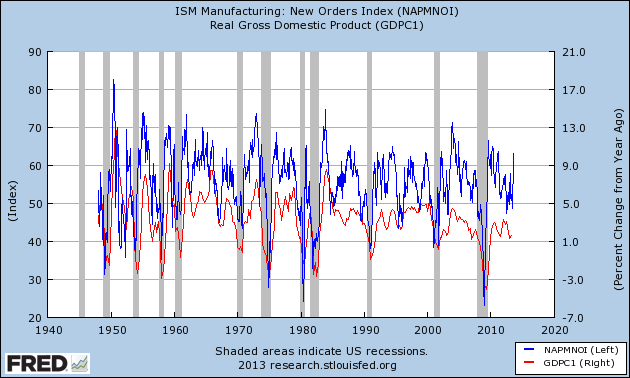
On the other hand, the new orders index is already at a level which has been consistent over the past 70 years with a recession in the very near future - although it is also consistent, as for example in 1966, with a slowdown only (note: ISM doesn’t allow FRED to publish its new data, so the below is a long term historical graph that ends in 2013):

Since the manufacturing sector in the economy is a smaller segment now than at any point since these series were started almost 75 years ago, the shallow  downturn there will have less repercussions than in the past.

A year ago I pointed to this quarter as being the epicenter of when I expected the downturn in the long leading indicators to have the most impact. That certainly appears to be the case. As the same time, I think the economy as a whole is more likely to remain in a slowdown than an outright contraction.

Saturday, November 30, 2019

Weekly Indicators for November 25 - 29 at Seeking Alpha


 - by New Deal democrat

My Weekly Indicators post is up at Seeking Alpha.

The short term forecast has been the most volatile portion for the past few months. And it got volatile again this week.

As usual, clicking over and reading should bring you fully up to date, and it rewards me a little for my efforts.

Friday, November 29, 2019

A few thoughts while you are digesting Thanksgiving dinner


 - by New Deal democrat

There was a bunch of data released Wednesday, while yours truly was on the road along with everybody else. So here are a couple of thoughts for you as you sit there with your loosened belt figuring out what leftovers you’re going to be eating for the next few days . . . 

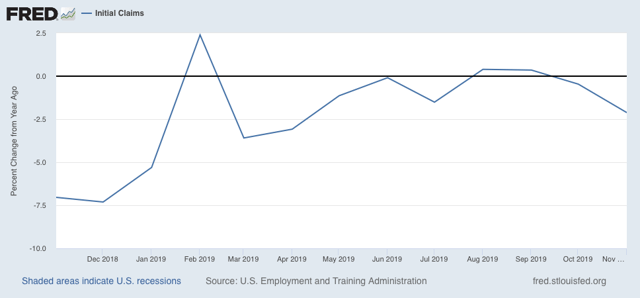
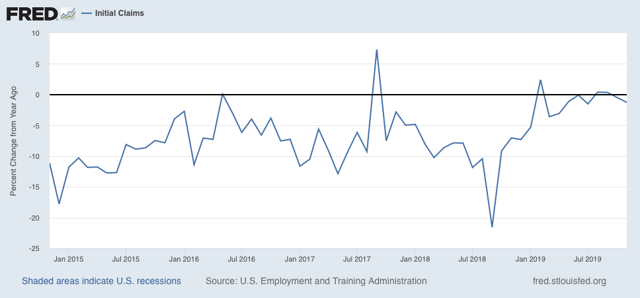
Initial jobless claims declined back to their recent baseline last week, so the four week average declined slightly, further back into its normal range. The YoY% change averaged monthly also is lower:


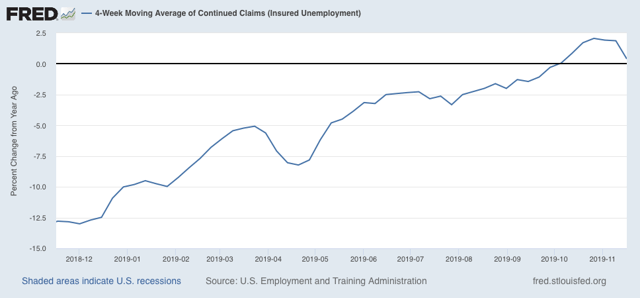
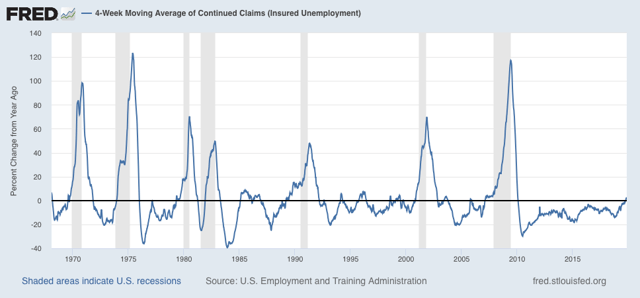
And the four week average of continuing claims, while slightly higher YoY, is also well below the point where it would be a serious concern:


Bottom line: the economy is simply not going to be in recession this quarter.

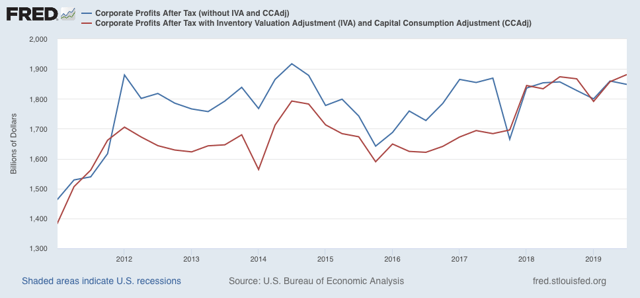
Corporate profits for the third quarter were also released as part of the second estimate of Q3 GDP. Depending on whether you include inventories and capital consumption or not, they either slightly increased or decreased:


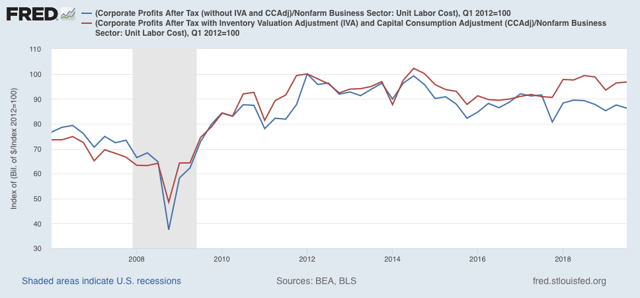
Adjusted by unit labor costs, they are either slightly (-3.3%) or significantly (-13.8%) below their peak for this expansion:


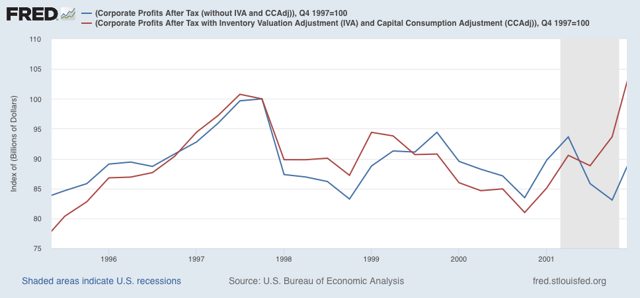
Before the last producer-led recession in 2001, both were off more than -15%:


This is a mixed signal for the economy in the second half of next year.

Tuesday, November 26, 2019

Housing rebound continues; price appreciation stabilizes


 - by New Deal democrat

Just a quick note, as I am traveling today.

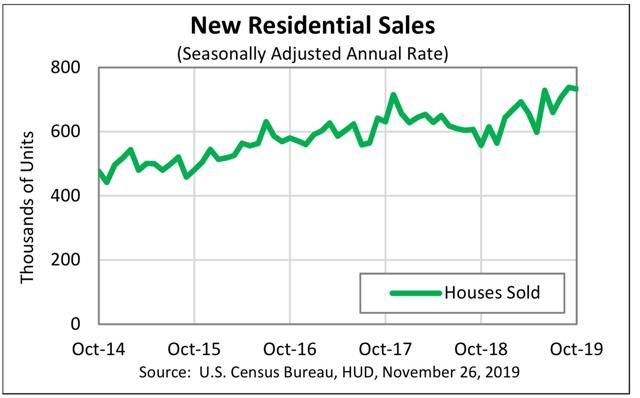
New home sales declined slightly in October from September, but remain at the high end of this expansion. The renewed uptrend in housing sales, due to lower mortgage rates, is clearly intact:


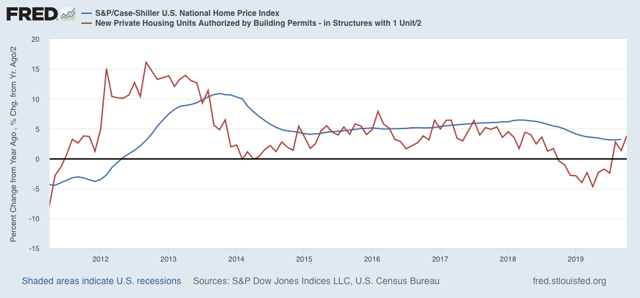
Meanwhile house prices, as measured by the Case Shiller index, also increased at a slightly faster YoY rate, 3.2% for September vs. 3.1% in August (blue):


As I have said many times, sales (permits, red in the graph above) lead prices. Now that the sales rebound is firmly intact, price appreciation has stabilized and is likely to begin accelerating again.

Monday, November 25, 2019

The consumer is still alright, November 2019 edition


 - by New Deal democrat

I have a new post up at Seeking Alpha.

A few months ago I took a look at the order in which I would expect the dominoes to fall if there were to be a consumer-led recession. One more domino has fallen, but several important ones are still upright.

As usual, clicking over and reading puts a couple of pennies in my pocket, and should be educational for you.

Sunday, November 24, 2019

Live-blogging the End of the Republic


 - by New Deal democrat

The title of this piece is increasingly my feeling about the times we are living in. Almost everywhere it has been implemented, the Madisonian system has ultimately failed, ending in presidential autocracy. All of the tools are now in place for the US to fail as well. If Trump doesn’t succeed in a second term, then the Sulla or Caesar who ends our republican experiment is alive now and has learned the necessary lessons. All that is missing is their competent and strategic implementation.

The bottom line is: provided a President has 34 Senators and a majority of the Supreme Court who will back him, he can do anything he wants. And I’m not even sure the Supreme Court majority is necessary. If Trump were to defy the Supreme Court about, e.g., his tax returns, who exactly is going to force him to obey?

I’ve made this point before, and Matt Yglesias immediately picked up on it. A couple of days ago, Chris Hayes came around to the same conclusion:

One way to understand the constitutional grant of powers to the president is that the president can do *literally* whatever he wants as long as he can hold onto the votes of 35 [sic*] senators in his party.
* Greater than 1/3rd = 34. Math, bitches!

Meanwhile conservative columnist Rich Lowry has flat-out stated, in essence, that he would prefer a Trump who tramples on the Constitution but appoints judges who will outlaw abortion to a presidential candidate who believes in the rule of law.  Which proves, as my Sibling Unit pointed out to me, David Frum‘s point that "If conservatives become convinced that they can not win democratically, they will not abandon conservatism. The will reject democracy."

While winning in 2020 is essential, simply going back to “normal” isn’t going to do the trick. The Constitutional fabric of a President being constrained by the law has been rent. Shoring up and repairing the weak points via updating the Constitution about things like the Presidential veto, emergency powers, appointments to legislative bureaucracies, lame duck sessions of Congress, gerrymandering, and the right to vote are all necessary, even if they appear to be a superhuman lift.

In the meantime, I’ve been reading about the Republics of Venice and Genoa, and the book about the Dutch Republic is in queue. It does seem that there are some strong points of Republics that can lead them to last a very long time. I’ll update once my reading is further along. I’ve also concluded Eric Foner’s “The Second Founding,” about the post-Civil War Amendments, which not only sets forth a compelling rebuttal to the Federalist Society’s cramped and dismissive constitutional theory, but also specifically suggests a completely effective Congressional solution for gerrymandering. Finally, I’ve gone back and re-read my 2015-16 articles on forecasting the presidential election, so that I can update those for 2020. Hopefully I’ll have time to do some of this starting this week.

Saturday, November 23, 2019

Weekly Indicators for November 18 - 22 at Seeking Alpha


 - by New Deal democrat

My Weekly Indicators post is up at Seeking Alpha.

I got some complaints from readers over there that they wanted to see graphs. So I’ve set up links to graphs that should automatically update each week for most of the data.

So long as the consumer continues to spend, we’re not going to have a recession. And if we don’t have one by the middle of next year, it isn’t going to happen.

As usual, clicking over and reading should bring you right up to date, and it rewards me a little bit for my efforts.

Friday, November 22, 2019

Rebound in existing home sales continues, but beware the housing “choke collar”


 - by New Deal democrat

Although they account for about 90% of the entire housing market, existing home sales are the least consequential to the economy. That’s because building new homes entails a bunch of economic activity, from architects, builders, building trades contractors, landscapers in the building process, followed by furniture, appliances, and yard improvements after the owners move in. Existing home sales on average have very little of the former, and much less of the latter.

But because existing homes compete with new homes for living space, it’s worthwhile to note that they confirm what we’ve been seeing in new home sales and construction this year; namely, a recovery brought about by lower interest rates.

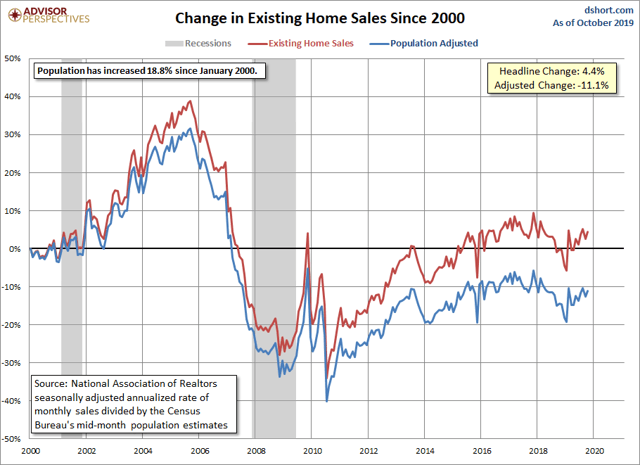
The NAR doesn’t permit FRED to post its data. So here is a graph of existing home sales for the past twenty years from Dshort.com:   


For my purposes, you can ignore the blue, “population-adjusted” line. Note the significant declines in sales following the rise in interest rates in the second half of 2013 and again in 2018. The low point was this past January. There is a well-established uptrend in place since then - which is the same thing we see with new houses, which also bottomed earlier this year.

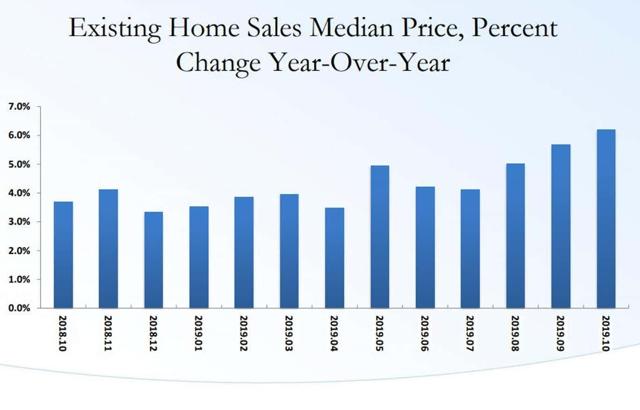
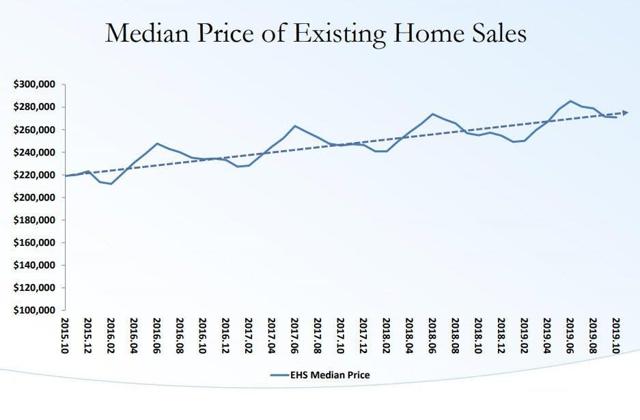
But if the news in sales is good, I am concerned about the renewed push in median prices, which were up 6.2% YoY in October to $270,900. Because prices rise and fall seasonally, we have to look YoY:


Here is a look at the past four years. In that time, median existing home prices have risen 23.1%:


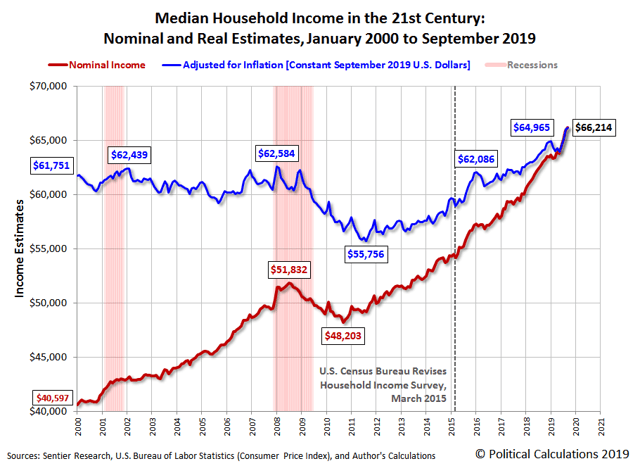
Meanwhile median household income, measured nominally, increased 5.1% YoY in October, according to Sentier Research (H/t Political Calculations). It is also up 16.2% from four years ago:


Which means that median house prices are once again outstripping gains in household income.

Recently I’ve applied the idea of a price “choke collar” to the housing market, by which I mean that while any significant decrease in interest rates will provoke a revival in housing construction and sales, the resulting increase in prices beyond the ability of households to compensate will put a ceiling on that rebound.

I don’t think we’ve hit that ceiling yet. But it something to keep an eye on in 2020.

Thursday, November 21, 2019

Initial claims weaker, but still not at cautionary levels


 - by New Deal democrat
I’ve been monitoring initial jobless claims closely for the past several months, to see if there are any signs of a slowdown turning into something worse. Simply put, no recession is going to begin unless and until layoffs increase, and the lack of any such increase has been the best argument that no recession is imminent.

My two thresholds for initial claims are:

1. If the four week average on claims is more than 10% above its expansion low.
2. If the YoY% change in the monthly average turns higher.
I’ve also added a threshold for the less leading, but also much less volatile 4 week average of continuing claims at 5% higher YoY.


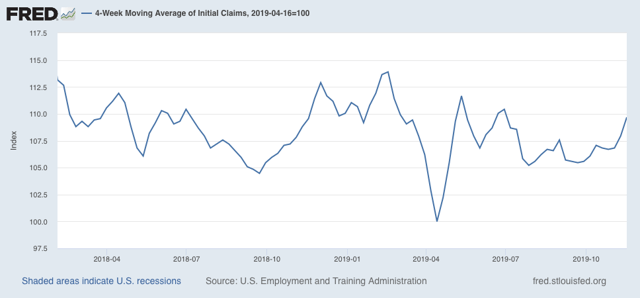
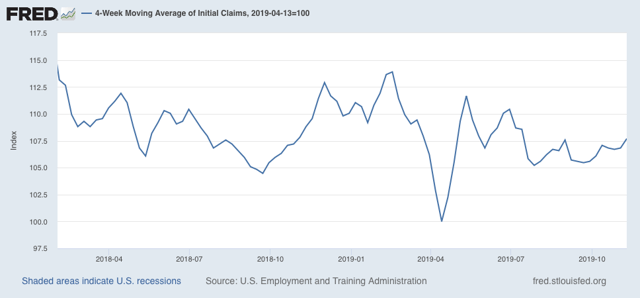
This week’s reading of 227,000, the second such reading in a row, is certainly weak compared with the past 4 months. As a result, the 4 week moving average of claims, at 221,000, is 9.7% above the lowest reading of this expansion: 


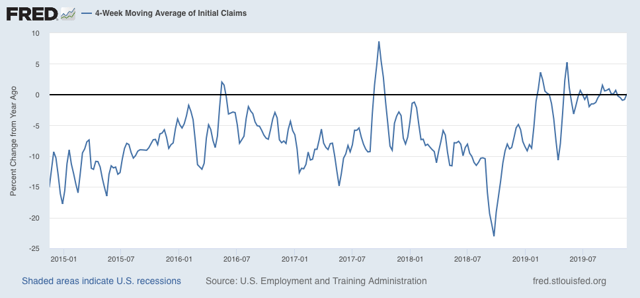
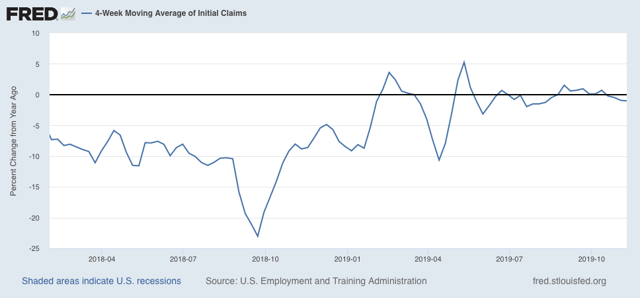
On a YoY% change basis, the 4 week average is very slightly, as in 0.1%, above its level one year ago:


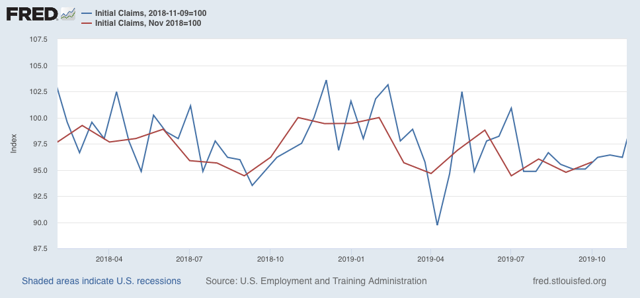
For the first three weeks of November, the average is 221,667 vs. 224,500 for the entire month of November last year, or less by -1.3%:


Although these readings are all weak, they remain positive. Neither threshold for a cautionary recession signal has been met.

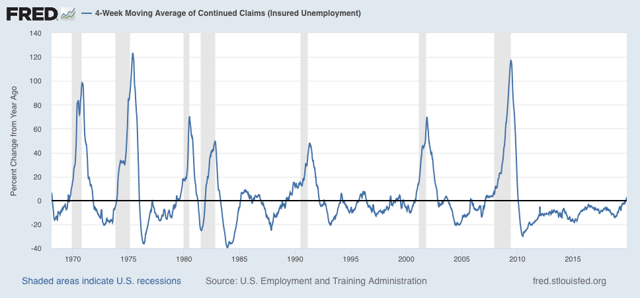
Meanwhile, the less volatile 4 week average of continuing claims is 1.8% above where it was a year ago:


This certainly is cautionary, and is consistent with a significant slowdown. But there have been similar readings in 1967, 1985-6, 3 times in the 1990s, and briefly in 2003 and 2005, all without a recession following. So the threshold for continuing claims being a negative has not been met either.

Barring additional poor government policies - I.e., if the economy is left to its own devices - the long leading indicators strongly suggest that the threat of a recession will end by about mid year next year.  Unless initial claims start to be reported in the 230’s, and continuing claims continue to trend  higher, into the 1.770 million range (by mid-December, after which the YoY comparisons for continuing claims get much easier), no interim recession will be signaled.   

Wednesday, November 20, 2019

Slouching towards a producer-led recession?


 - by New Deal democrat

A few months ago I wrote an extended piece at Seeking Alpha about the order of events I would need to see in order to conclude that a producer-led recession, similar to that of 2001, was ready to occur. One of the big components was a change in the Senior Loan Officer Survey.

Well, the Senior Loan Officer Survey for Q3 was reported a couple of weeks ago, and seems to have completely escaped the notice of the economic and financial community.

But it was on my radar. So I have now updated my analysis as to whether we are in for a producer-led recession, over at Seeking Alpha.

As usual, clicking over and reading helps reward me with a penny or two for my efforts.

By the way, SA also finally got around to publishing my housing update from yesterday, and you can read it here.

Tuesday, November 19, 2019

Excellent October housing report is good news for employment


 - by New Deal democrat

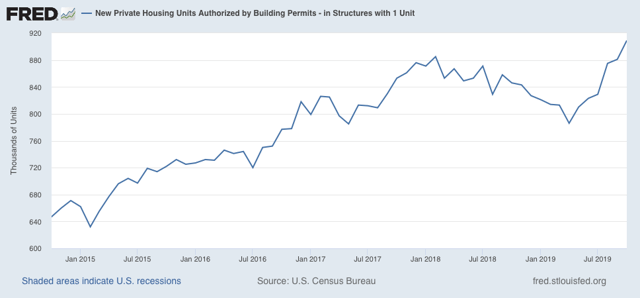
I’ll have a more comprehensive report up at Seeking Alpha, and I’ll link to it when it goes up, (UPDATE: It’s finally up, here ) but in the meantime let me just share the least volatile most leading component which is single family permits:


These made a new expansion high. The housing rebound, following lower mortgage rates, is firmly in place.

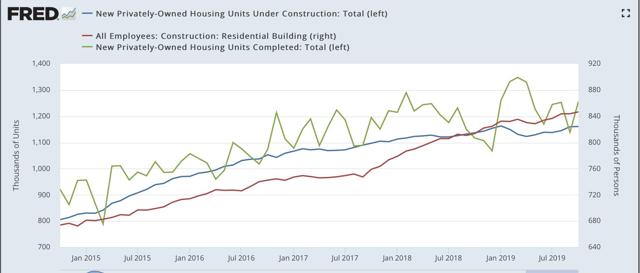
Additionally, both housing completed and under construction have also increased from recent bottoms. These aren’t as leading as housing permits and starts, but they correlate much more closely with residential building jobs, and they argue strongly that residential construction employment, a leading sector of the jobs market, is likely to continue to increase:


This was a very good report.

Monday, November 18, 2019

A yellow flag from temporary hiring


 - by New Deal democrat

In the conclusion of my latest Weekly Indicators post, I wrote that, except for temporary staffing, I didn’t see any signs of weakness spreading out beyond manufacturing and import/export. Manufacturing, as measured by industrial production, has been in a shallow recession all year. By contrast, the consumer - 70% of the economy - continues to do ok, boosted by lower interest rates for mortgages and somnolent gas prices.

Since there isn’t any other economic news today, let’s take a look at that one yellow flag - temporary hiring.

As I’ve pointed out each month for the past few months, each monthly jobs report this year has started out with a nice, positive number for temporary jobs. But then, with one exception, the number gets revised downward, sometimes substantially, and usually into negative territory.

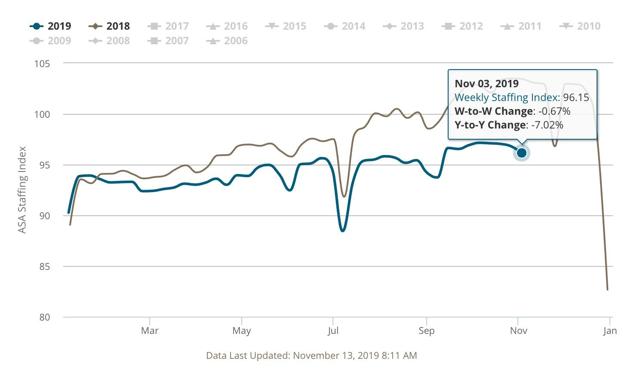
My weekly check on this is the Staffing Index from the American Staffing Association. And that number has been getting progressively worse.

Here is the most recent number, from last week (-7.02% YoY):


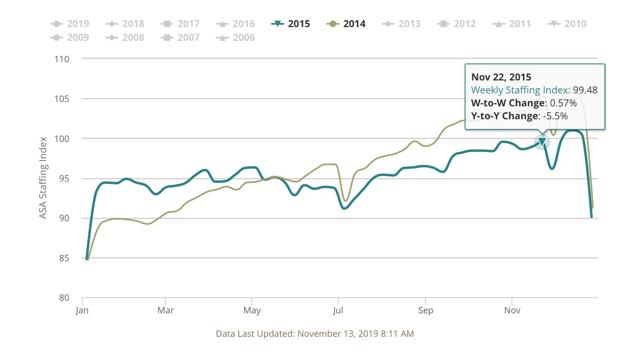
Now let’s compare with the worst number during the 2015-16 slowdown that was centered on the Oil Patch (-5.5% YoY):


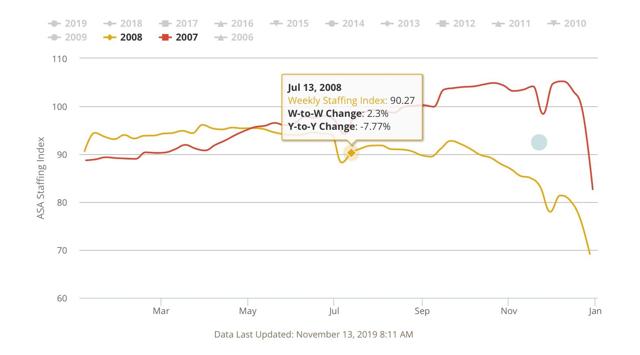
Finally, here is the 2007-08 comparison:


The YoY comparison declined below -7% in July 2008. By that time, the economy as a whole had already been in a recession for over half a year (although Q2 GDP was positive, and was less than -0.1% away from its Q4 2007 peak).

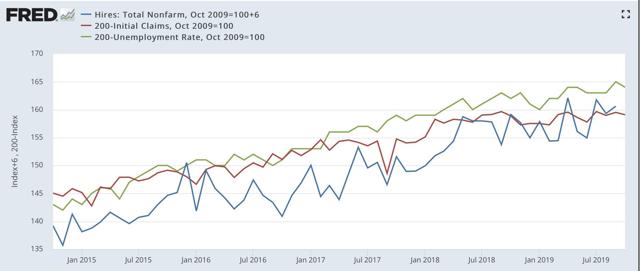
Finally, let’s take a look at hiring (via JOLTS), firing (initial claims, averaged monthly and inverted), and the unemployment rate (also inverted) for the past five years:


Hiring has slowly trended higher, while new jobless claims are essentially flat. Presumably as a result, the unemployment rate has been ticking slowly lower.

I would expect a decrease in hiring to show up very quickly, and maybe first, in a decline in new temporary hires. But so far the yellow flag in temporary staffing has not shown up in the wider data, and in particular hiring.

Saturday, November 16, 2019

Weekly Indicators for November 11 - 15 at Seeking Alpha


 - by New Deal democrat

My Weekly Indicators post is up at Seeking Alpha.

Although a few indicators backed off some this week, the overall tone, ex-manufacturing, across all timeframes is positive.

You may be reading a few takes today about the poor nowcasts out of the NY and Atlanta Feds, after yesterday’s face-plant of an industrial production reading. Keep in mind that they are mechanically applying that result and not accounting for the GM strike (which is what I would do if I were in their shoes as well). So take those with a healthy dose of salt for now.

As usual, clicking over and reading rewards me with a couple of pennies for my efforts.

Friday, November 15, 2019

Industrial production tanks on GM strikes; Real retail sales decline slightly


 - by New Deal democrat

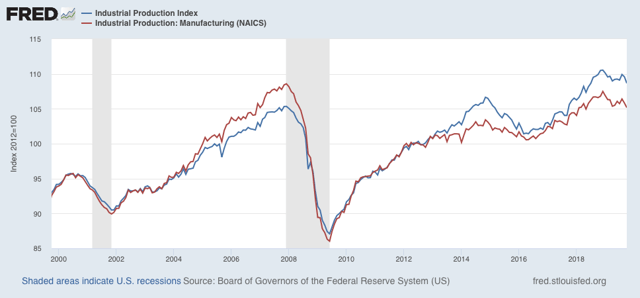
First, let me briefly address industrial production, which fell -0.8% in October. On its face this is an awful number. But take it with a big grain of salt: mainly it reflected the GM  strike.

Manufacturing output fell 0.6 percent in October to a level 1.5 percent lower than its year-earlier reading. In October, the strike in the motor vehicle industry contributed to a drop of 1.2 percent for durables. Excluding motor vehicles and parts, the output of durables moved down 0.2 percent.... The production of nondurables was unchanged.... The output of other manufacturing (publishing and logging) fell 1.0 percent.

Even without the GM strike, the number would have been negative. But not nearly as negative as it was. For the record, both utilities and mining (including oil production) were also down substantially, but these tend to be volatile.

So here is the relevant graph, which certainly does show a downturn in the past year. Just take the last downward blip with a grain of salt: 


Now let’s turn to retail sales. Retail sales are one of my favorite indicators, because in real terms they can tell us so much about the present, near term forecast, and longer term forecast for the economy.

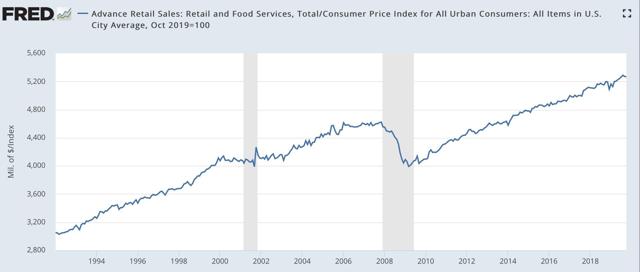
This morning retail sales for October were reported up +0.3%, taking back September’s -0.3% decline. Since consumer inflation increased by +0.4%, however, real retail sales declined -0.1% for the month, following another -0.1% decline in September. As a result, YoY real retail sales took a spill but are still up +1.3%.


Here is what the absolute trend looks like. The last two months’ decline remains well within the range of noise:

Others may use other deflators. I use overall CPI because:
1. I’ve been doing it this way for over 10 years. 
2. This is the deflator used by FRED.
3. It has a 70+ year history.
4. Over that 70+ year history, it has an excellent record as a short leading indicator for employment and recessions. That’s the kind of track record I like.

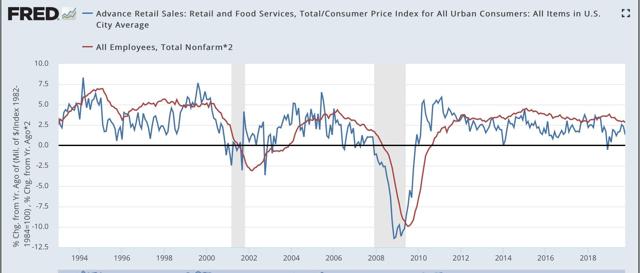
Further, although the relationship is noisy, real retail sales measured YoY tend to lead employment (red in the graphs below) by about 4 to 8 months. Here is that relationship over the past 20 years: 


The recent peak in YoY employment gains followed the recent peak in real retail sales by roughly 6 months, and the downturn in real retail sales at the end of last year has already shown up in weakness in the employment numbers this year. Similarly even with the October decline I expect the recent improvement in retail sales YoY to show up in at least stabilization in the  employment numbers by about next spring. 

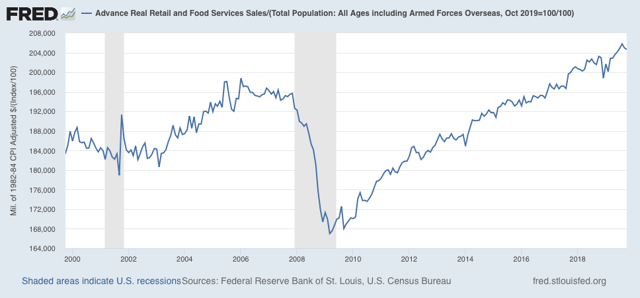
Finally, real retail sales per capita is a long leading indicator. In particular it has turned down a full year before either of the past two recessions:


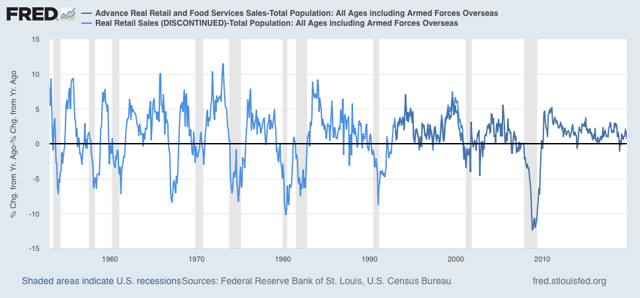
In the last 70 years, with the exception of 1973 and 1981 this measure has always turned negative YoY at least shortly before a recession has begun:


Thus this is a quite reliable indicator. 

In summary, while a two month decline in real retail sales is a negative, this is a small one.  It will take a significant further decline for me to become concerned.

Thursday, November 14, 2019

Initial claims continue to show slowdown, but no imminent recession


 - by New Deal democrat

I’ve been monitoring initial jobless claims closely for the past several months, to see if there are any signs of a slowdown turning into something worse. Simply put, no recession is going to begin unless and until layoffs increase.

My two thresholds are:

1. If the four week average on claims is more than 10% above its expansion low.
2. If the YoY% change in the monthly average turns higher.

As of this week, initial claims continue to be very close to their expansion lows. The 4 week moving average of claims Is 217,000, only 7.7% above the lowest reading of this expansion: 


On a YoY% change basis, the 4 week average is -1.0% below its level one year ago:


In the first two weeks of November(blue), the average is 218,500 vs. 224,500 for November last year (red):


Although these readings are all weak, they remain positive. Neither threshold for a cautionary recession signal has been met.

On the other hand, the less volatile (but less leading) 4 week average of continuing claims is 1.5% above where it was a year ago:


This certainly is cautionary, and is consistent with a significant slowdown. But there have been similar readings in 1967, 1985-6, 3 times in the 1990s, and briefly in 2003 and 2005, all without a recession following. If we were to get readings in this metric more than 5% higher YoY, then I would be concerned.

Bottom line: unless initial claims start to be reported in the 230’s, and continuing claims continue to trend higher, there isn’t a recession in the immediate future (and, based on the improvement in the long leading indicators this year, barring more poor government policies, if there is no recession by midyear next year at the latest, it’s not going to happen).

Wednesday, November 13, 2019

Real average and aggregate wages declined in October


 - by New Deal democrat

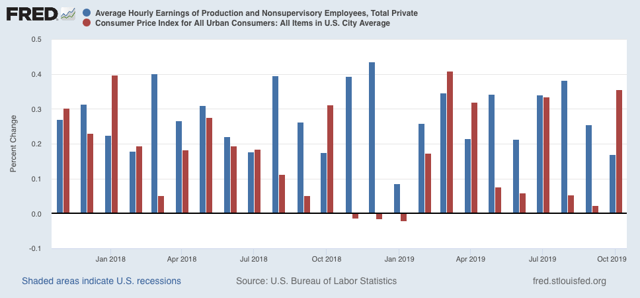
October’s consumer inflation reading came in at a surprisingly high +0.4%, which as shown in red in the graph below, was one of the 3 highest in the past two years. Meanwhile average hourly earnings increased less than +0.2% - the second lowest reading in the past two years, shown in blue: 


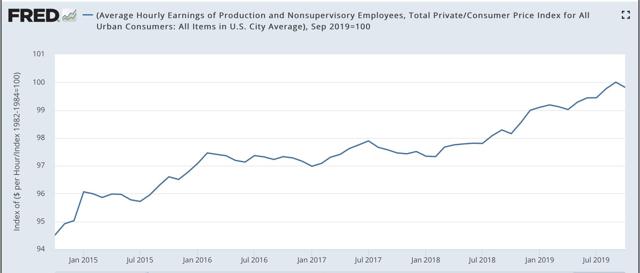
As a result, real average hourly earnings decreased -0.2% last month, the worst reading since late 2017:


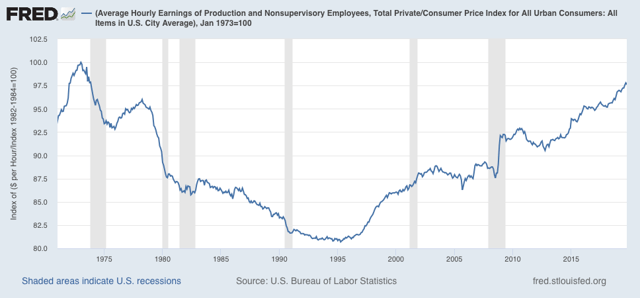
In a longer term perspective, this means that real wages declined to 97.6% of their all time high in January 1973:


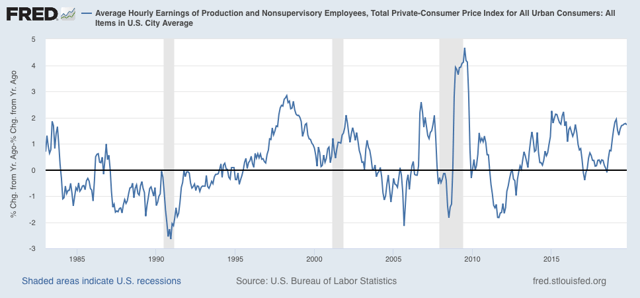
On a YoY basis, real average wages remained up +1.7%, as they have been since June, and still below their recent peak growth of 1.9% YoY in February:


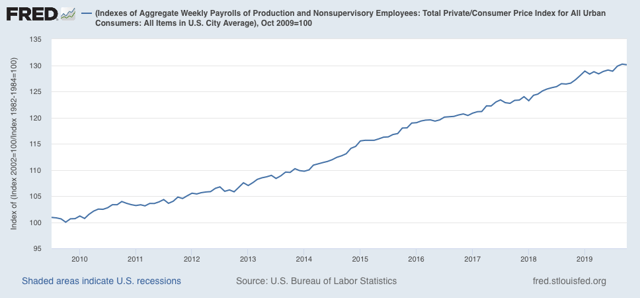
Aggregate hours and payrolls have improved significantly since July, so even though they declined -0.1% in October, real aggregate wages - the total amount of real pay taken home by the middle and working classes - are up 30.1%  from their October 2009 trough at the beginning of this expansion:


For total wage growth, this expansion remains in third place, behind the 1960s and 1990s, among all post-World War 2 expansions; while the *pace* of wage growth has been the slowest except for the 2000s expansion.

Tuesday, November 12, 2019

How economists blew the analysis of the manufacturing jobs shock


 - by New Deal democrat

I came across this article yesterday, posted by - to his credit - Brad DeLong, whose argument it eviscerates. Entitled “The Epic MIstake about Manufacturing That’s Cost Americans Millions of Jobs,” it deserves widespread attention. So I am summarizing it here. But by all means go and read the entire piece.

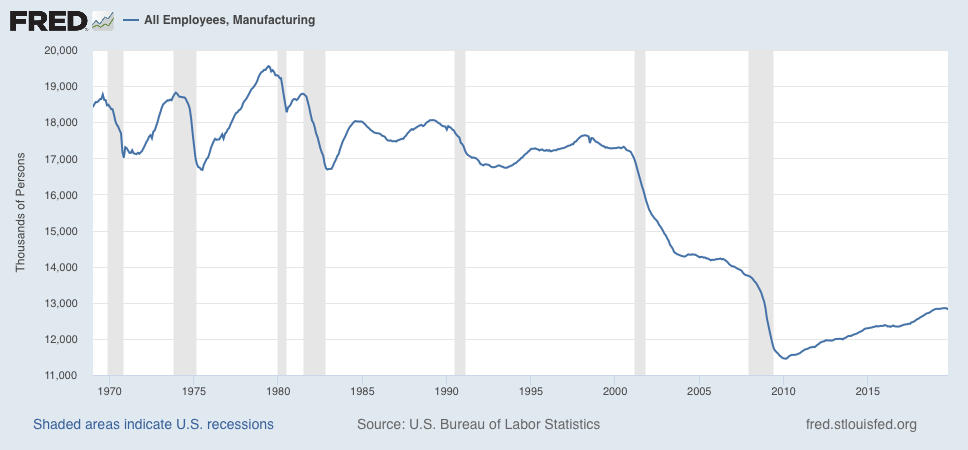
Just to give you the frame of reference, here is the historical graph of manufacturing jobs in the US for the past 50 years:   


After peaking in 1979, the number more or less gradually declined in the 1980s, and then stabilized in the 1990s, before plummeting right after 2000.

As written by Gwynn Guilford, the consensus of economists’ opinion was that while

the US had hemorrhaged manufacturing jobs, losing close to 5 million of them since  2000. Trade may have been a factor—but it clearly wasn’t the main culprit. Automation was.
....
For a decade or so, this phenomenon had been put forth by Ivy League economists, former US secretaries of treasurytransportation, and laborCongressional Research Services, vice president Joe Biden, president Barack Obama—and by Quartz too, for that matter. In a 2016 New York Times articletitled “The Long-Term Jobs Killer is Not China. It’s Automation,” Harvard economist Lawrence Katz laid out the general consensus: “Over the long haul, clearly automation’s been much more important—it’s not even close.”

Susan Houseman, an economist at the Upjohn Institute, and her colleagues, examined microdata available from the Federal Reserve, and discovered that this entire rationalization was based on technological improvements in only one industry — computers. As the article states, once they 

 strip[ped] away the computers industry output from the rest of the data[, t]hat revealed just how the rest of manufacturing was doing—and it was much worse than what Houseman and her colleagues expected.
“It was staggering—it was actually staggering—how much that was contributing to growth in real [meaning, inflation-adjusted] manufacturing productivity and output,” says Houseman.

The culprit was “quality improvement.” The computing power of your smartphone is probably millions of times better than the Univac computer of the 1950s. In fact, it’s much better than its ancestor of only 10 years ago. So your new smartphone is clearly worth “more” than an equivalently priced smartphone of 10 years ago.

The problem is, this quality improvement was assumed to be general across all of American industry. It wasn’t. Strip away computer quality improvement, and, well:
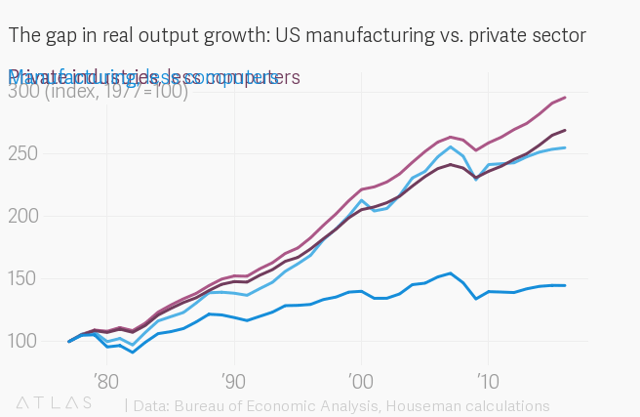
according to Houseman’s data, without computers, manufacturing’s real output expanded at an average rate of only about 0.2% a year in the 2000s. By 2016, real manufacturing output, sans computers, was lower than it was in 2007.

Here’s the nut graph (if the formatting doesn’t show properly, the important thing to know is that the light blue line well below the others is real manufacturing output less computers):


To put this in more dinosaurian terms, imagine if American factories were churning out exactly as much of exactly the same stuff in 2019 as they had been in 1969. Obviously we would say that there was no growth at all. But now make one change: where in 1969 automakers were churning out 10 million 1969 Chevy Impalas, in 2019 they are churning out 10 million 2019 Honda Accords. OK, modern Accords are light-years better than the Impalas of long ago,  but we wouldn’t say that American industry across the board had improved. 

That’s the mistake that economists made. Take away improvements in the computer industry, and American manufacturing really hasn’t made any progress at all - and still there are 4.5 million fewer jobs in manufacturing than there were at the end of 1999. And all of those jobs outside of the computer industry were due not to automation, but to trade.

Since the 2016 election, I’ve been leery of choosing sides between the “economic anxiety” trope and the “they’re all racists” theory, because I don’t see them as necessarily inconsistent. A white racist who is content with how things are going might vote for, e.g., Barack Obama, while that same racist, if stressed, will look for a scapegoat - like Mexicans and Muslims - to blame. Obama himself in a “Kinsey gaffe” referred to people “who cling to their guns and their religion.” That’s why in 2016 the national election result tracked so well with the economic voting models, while among the hardest-hit places in the 2016 “shallow industrial recession” were those of the upper Midwest that put Trump over the top.
Monday, November 11, 2019

November leading reports point to slowdown, no recession


 - by New Deal democrat

The leading indicators reported so far this month show that, while manufacturing continues flat or even in contraction, there’s no significant indication that it has spread to other important sectors like residential construction or motor vehicle sales. And without the weakness spreading to their sectors, this looks similar to 2016, where there was a slowdown but no recession.
This article was posted last week at Seeking Alpha. As usual, clicking over and reading rewards me with a penny or two for my efforts.