- by New Deal democrat
In the conclusion of my latest Weekly Indicators post, I wrote that, except for temporary staffing, I didn’t see any signs of weakness spreading out beyond manufacturing and import/export. Manufacturing, as measured by industrial production, has been in a shallow recession all year. By contrast, the consumer - 70% of the economy - continues to do ok, boosted by lower interest rates for mortgages and somnolent gas prices.
Since there isn’t any other economic news today, let’s take a look at that one yellow flag - temporary hiring.
As I’ve pointed out each month for the past few months, each monthly jobs report this year has started out with a nice, positive number for temporary jobs. But then, with one exception, the number gets revised downward, sometimes substantially, and usually into negative territory.
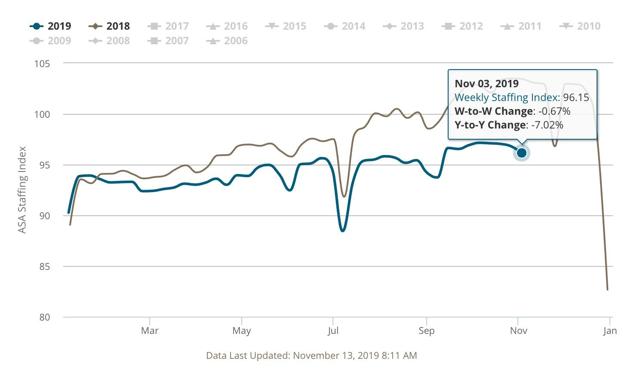
My weekly check on this is the Staffing Index from the American Staffing Association. And that number has been getting progressively worse.
Here is the most recent number, from last week (-7.02% YoY):

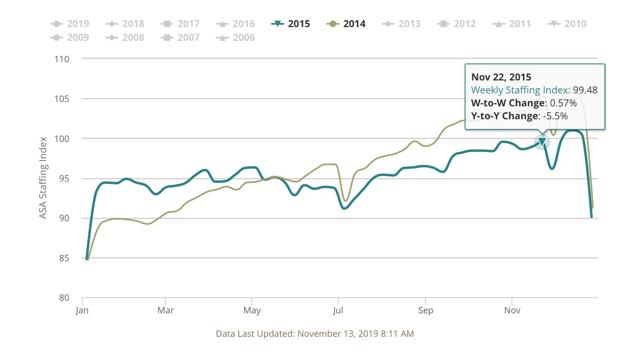
Now let’s compare with the worst number during the 2015-16 slowdown that was centered on the Oil Patch (-5.5% YoY):

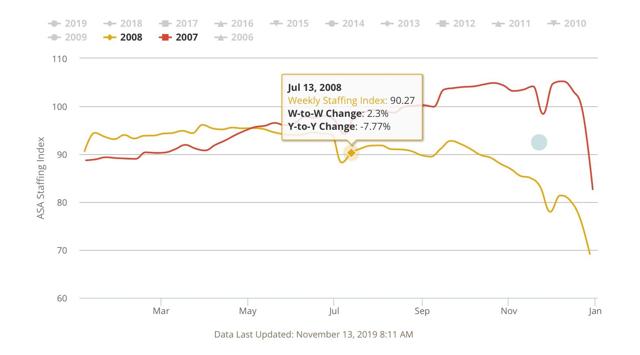
Finally, here is the 2007-08 comparison:

The YoY comparison declined below -7% in July 2008. By that time, the economy as a whole had already been in a recession for over half a year (although Q2 GDP was positive, and was less than -0.1% away from its Q4 2007 peak).
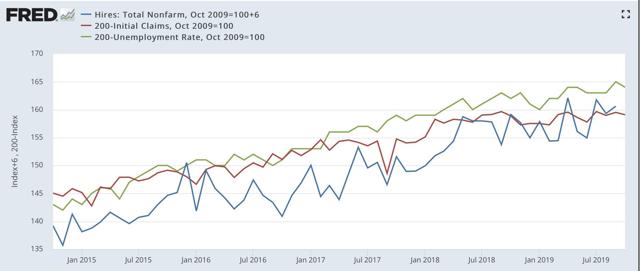
Finally, let’s take a look at hiring (via JOLTS), firing (initial claims, averaged monthly and inverted), and the unemployment rate (also inverted) for the past five years:

Hiring has slowly trended higher, while new jobless claims are essentially flat. Presumably as a result, the unemployment rate has been ticking slowly lower.
I would expect a decrease in hiring to show up very quickly, and maybe first, in a decline in new temporary hires. But so far the yellow flag in temporary staffing has not shown up in the wider data, and in particular hiring.