- by New Deal democrat
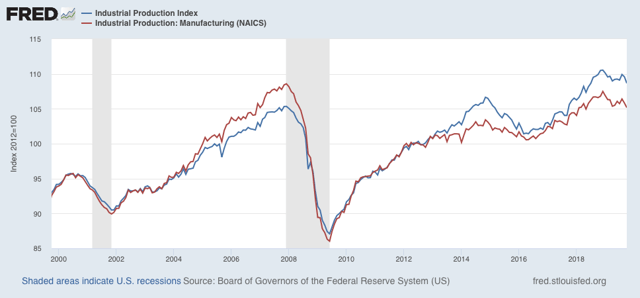
First, let me briefly address industrial production, which fell -0.8% in October. On its face this is an awful number. But take it with a big grain of salt: mainly it reflected the GM strike.
Here’s the applicable note from the Federal Reserve:
Manufacturing output fell 0.6 percent in October to a level 1.5 percent lower than its year-earlier reading. In October, the strike in the motor vehicle industry contributed to a drop of 1.2 percent for durables. Excluding motor vehicles and parts, the output of durables moved down 0.2 percent.... The production of nondurables was unchanged.... The output of other manufacturing (publishing and logging) fell 1.0 percent.
Even without the GM strike, the number would have been negative. But not nearly as negative as it was. For the record, both utilities and mining (including oil production) were also down substantially, but these tend to be volatile.
So here is the relevant graph, which certainly does show a downturn in the past year. Just take the last downward blip with a grain of salt:
Now let’s turn to retail sales. Retail sales are one of my favorite indicators, because in real terms they can tell us so much about the present, near term forecast, and longer term forecast for the economy.
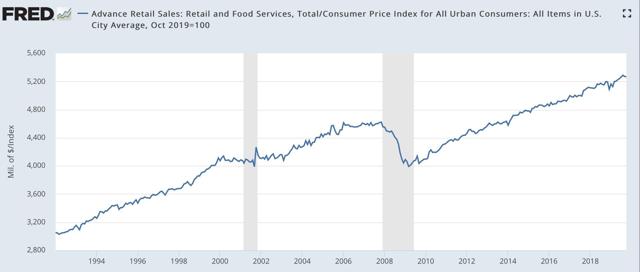
This morning retail sales for October were reported up +0.3%, taking back September’s -0.3% decline. Since consumer inflation increased by +0.4%, however, real retail sales declined -0.1% for the month, following another -0.1% decline in September. As a result, YoY real retail sales took a spill but are still up +1.3%.
Here is what the absolute trend looks like. The last two months’ decline remains well within the range of noise:
Others may use other deflators. I use overall CPI because:
1. I’ve been doing it this way for over 10 years.
2. This is the deflator used by FRED.
3. It has a 70+ year history.
4. Over that 70+ year history, it has an excellent record as a short leading indicator for employment and recessions. That’s the kind of track record I like.
Further, although the relationship is noisy, real retail sales measured YoY tend to lead employment (red in the graphs below) by about 4 to 8 months. Here is that relationship over the past 20 years:
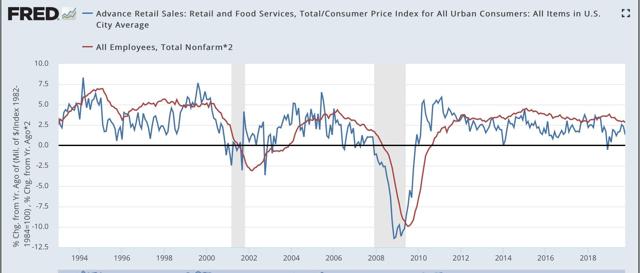
The recent peak in YoY employment gains followed the recent peak in real retail sales by roughly 6 months, and the downturn in real retail sales at the end of last year has already shown up in weakness in the employment numbers this year. Similarly even with the October decline I expect the recent improvement in retail sales YoY to show up in at least stabilization in the employment numbers by about next spring.
Finally, real retail sales per capita is a long leading indicator. In particular it has turned down a full year before either of the past two recessions:
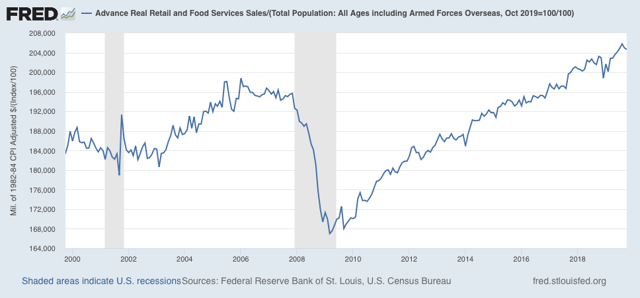
In the last 70 years, with the exception of 1973 and 1981 this measure has always turned negative YoY at least shortly before a recession has begun:
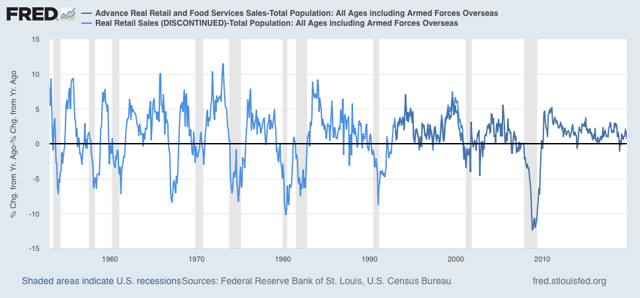
Thus this is a quite reliable indicator.
In summary, while a two month decline in real retail sales is a negative, this is a small one. It will take a significant further decline for me to become concerned.