Friday, August 30, 2019

Consumer spending, particularly on durable goods, continues to be strong


 - by New Deal democrat

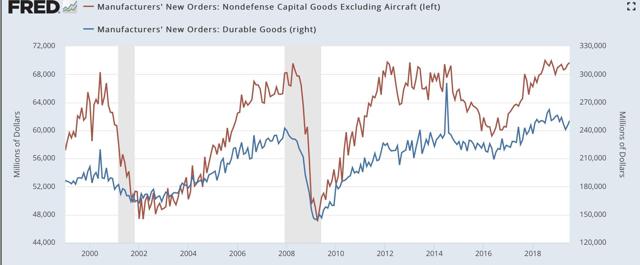
Earlier this week I wrote about the state of the short leading indicators. On Monday, manufacturers new orders came in positive.

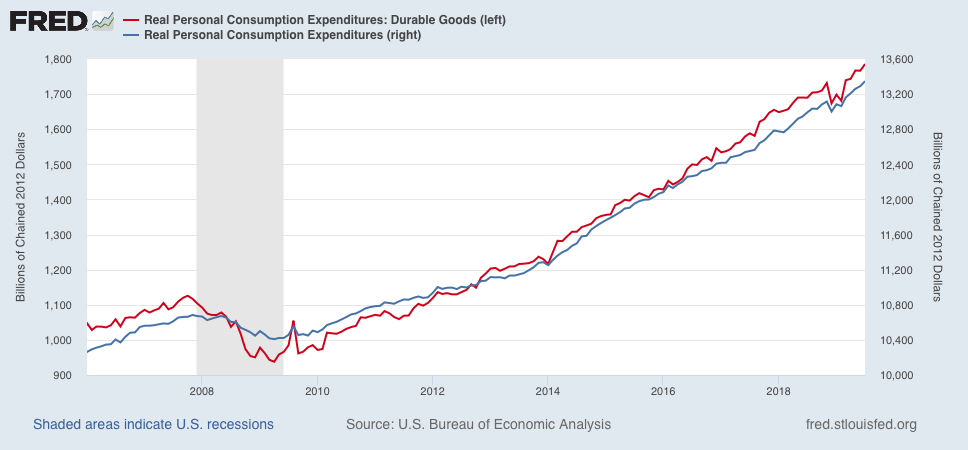
This morning, consumer spending on durable goods, as well as overall, also improved sharply:


If a consumer led recession were close at hand, I would expect consumer spending on durables to decline significantly. Obviously, that hasn’t happened.

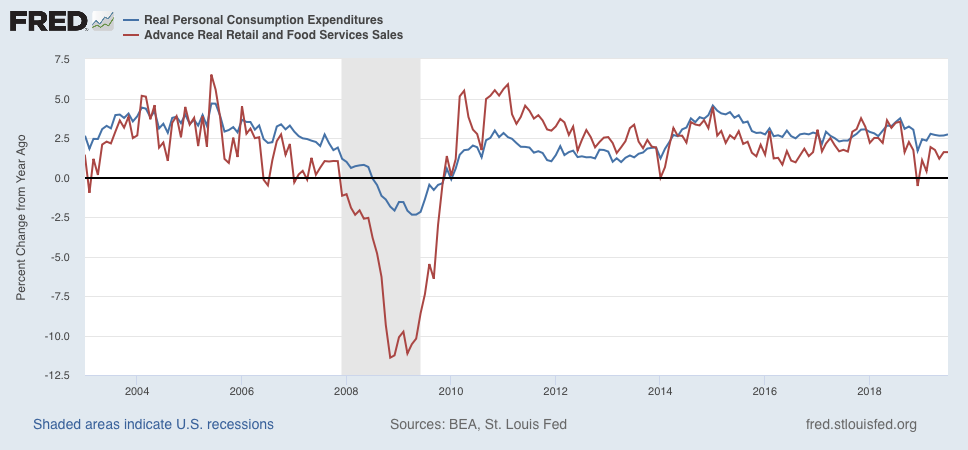
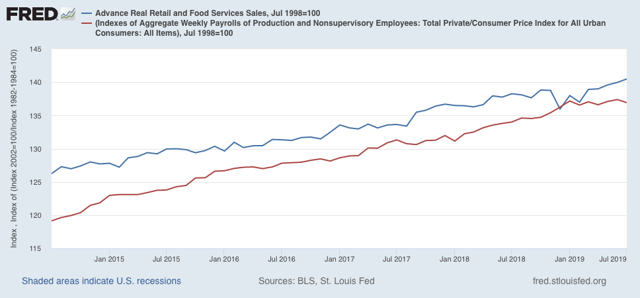
While I am at it, here is the updated comparison of real personal consumption expenditures with real retail sales, measured YoY:


Going back over 50 years, typically the latter has both improved more earlier in the cycle, and decelerated into decline first later in the cycle. The present picture continues to be late cycle with no imminent sign of any actual downturn.

Left to its own devices, the chances of a near term recession in the economy are receding dramatically.*

——
*subject to the next trade war tweet

Thursday, August 29, 2019

Initial jobless claims remain steadfastly, if weakly, positive


 - by New Deal democrat

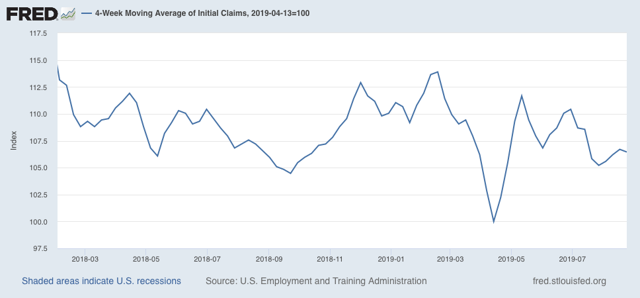
As per my usual practice for the past several months, let’s look at initial jobless claims to see if there are any signs of stress.

My two thresholds are:

1. If the four week average on claims is more than 10% above its expansion low.
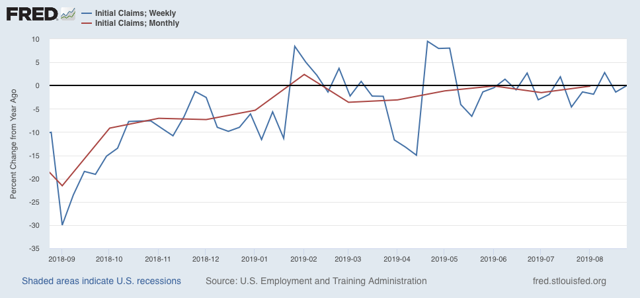
2. If the YoY% change in the monthly average turns higher.

Here’s this week’s update.  
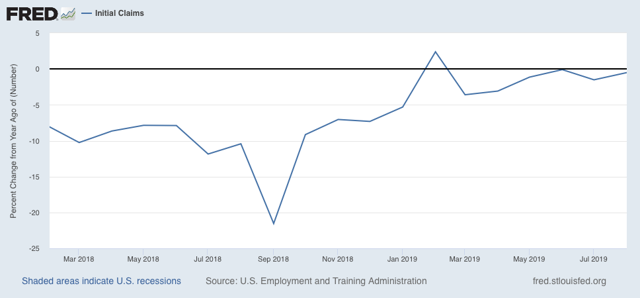
Initial jobless claims last week were 215,000. This is in the lower part of its range for the past 18 months. As of this week, the four week average is 6.5% above its recent low:
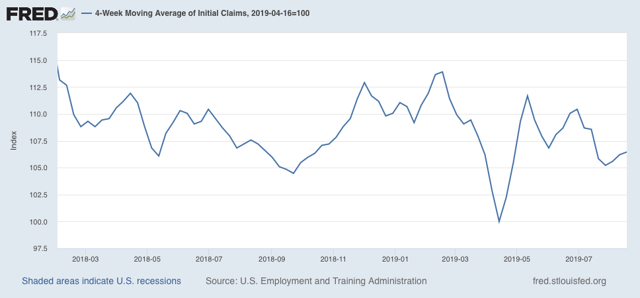

Additionally, the YoY change for the month of August as a whole (red) is -250 below where it was last year (weekly YoY change is shown in blue):


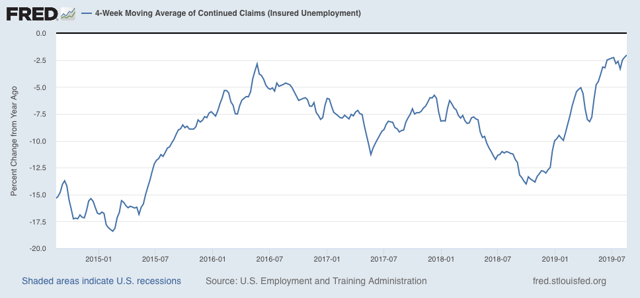
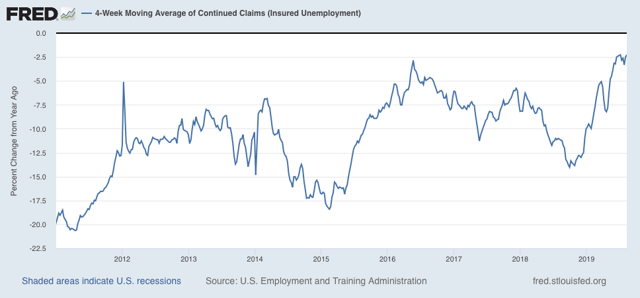
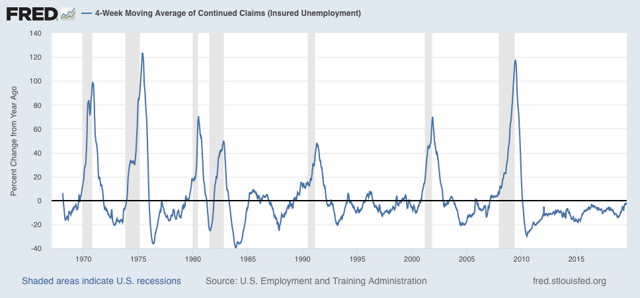
The less leading but also less volatile 4 week average of continuing claims rose slightly, and remains slightly (-2.0%) below its level of one year ago:


In summary, jobless claims have steadfastly remained positive, if very weakly so, against the toughest comparisons from one year ago. There is no imminent economic downturn so long as this remains the case.

Wednesday, August 28, 2019

The quick and dirty leading indicator watch has been stagnant for 18+ months


 - by New Deal democrat

[Note: I’ve been working on my “what leads consumer spending” opus, and as often happens, I don’t want to publish anything until I’m sure I’ve got something good - which means lots more research and saved graphs — and nothing whatsoever published! I owe you something for today, so here’s a little nugget ....]

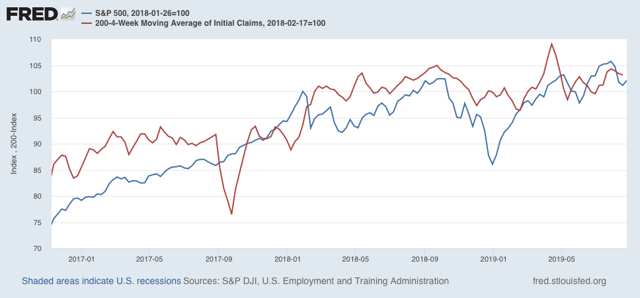
If you want a “quick and dirty” forecast for the economy over the next 4 to 6 months, the easiest approach is to look at stocks (vis the S&P 500 index) and initial jobless claims.

I’ve been noting for awhile that initial claims have gone basically nowhere since February 2018, and this afternoon I was reminded that it was the case for stocks as well. Here’s both (claims are inverted, red). Both are normed to 100 as of the week they started to go sideways:


Both were strongly positive in 2017. But for the last 18-19 months, both have with rare exception oscillated within 5% of that initial point, with the *slightest* of positive trends. Both continue to absolutely shout “SLOWDOWN” but neither points to recession in the immediate future.

Tuesday, August 27, 2019

Consumer spending leads employment — but what leads consumer spending?


 - by New Deal democrat

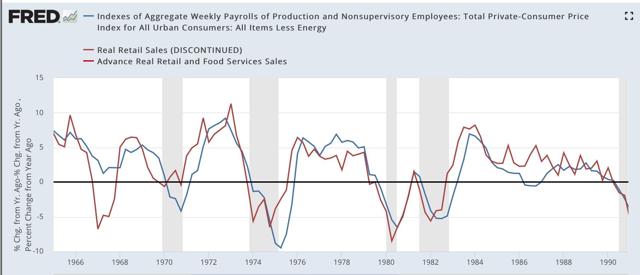
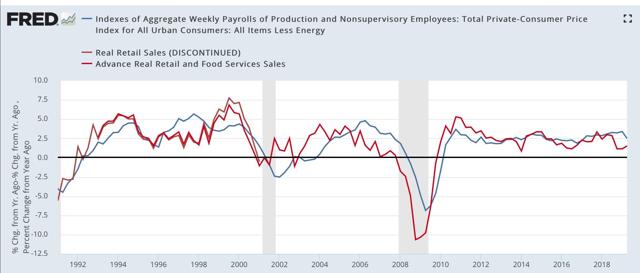
One relationship I have consistently flogged for the past decade is that consumer spending leads employment.  That’s still true. Here is one of the graphs on that score going back over 50 years, the YoY% change, averaged quarterly, in real aggregate payrolls (blue) vs. real retail sales (red):

1965-90: 

1991-2019:


It is absolutely crystal clear that sales have consistently led total payrolls by one to two quarters. (And yet I still see people making this mistake. The other day I read an article on Seeking Alpha that claimed that consumer spending was going to do well because employment was still doing well. NOT TRUE!) 

In fact, as shown on the graphs above, a decline below zero in the YoY% change of real retail sales on a quarterly basis has been a short leading harbinger of every single recession in the past 50+ years, with only two false positives (1966 and 2002).

But, in view of the current situation, in which the long leading indicators are strongly hinting at a steep slowdown or recession ahead, what best leads consumer spending?

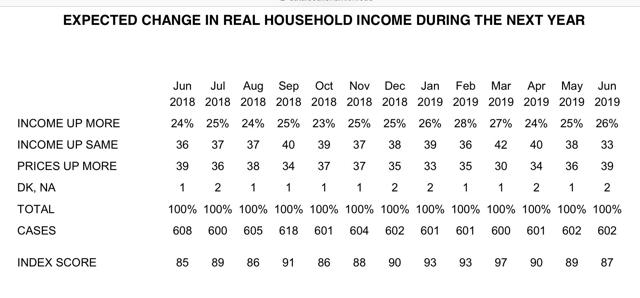
Over the weekend, Prof. Brad DeLong linked to the twitter thread of Fed economist Prof. Claudia Sahm in which she highlighted the role of household income expectations as measured by the University of Michigan consumer sentiment survey: Unfortunately, there’s no easy graph to look at for those, but here is the data is broken out in chart form:

[The data can be found here.] 
 
But is this just a case of “animal spirits?” Or are consumers reacting to real, hard data in deciding that their financial position is likely to improve, remain static, or decline in the coming months?

While there is no silver bullet, I think that consumers in the aggregate are reacting rationally to changes that they see affecting their pocketbooks. Among those changes are:
  • interest rates charged on loans
  • the tightening or loosening of lending standards
  • an increase or decrease in the underlying inflation rate that is not seen as short-term 
  • the improvement, stagnation, or decline of the “hiring” component of the jobs market (as opposed to the “firing” or overall job-leaving component)

I’ve probably downloaded about 100 graphs going through these components and more, most of which would bore you to tears. But I’ll go through some of the more salient relationships I’ve found in future posts.

Monday, August 26, 2019

Short leading indicators show slowdown, not recession (for now anyway)


 - by New Deal democrat

Amount 10 days ago, I wrote that backward revisions to adjusted NIPA corporate profits meant the long leading indicators were more negative than originally believed one year ago.  Which means that watching the short leading indicators for signs of rolling over became more important.

I took a comprehensive look at the short leading indicators late last week. This post is up at Seeking Alpha.

As always, clicking over and reading helps put a penny or two in my pocket for my efforts.

——

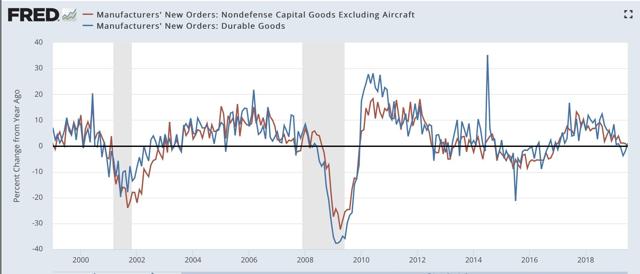
Addendum: Based on the outcome of the above post, one of the two data points I said I would particularly pay attention to this week was this morning’s durable goods reports. This came in positive as to both total new orders and “core” orders less defense and Boeing:


The YoY trend is still deteriorating, with total orders up +1% YoY, and “core” new orders down -0.5% YoY.:


“Core” orders are flat, but not suggesting recession, while manufacturers’ new orders are consistent with a recession. This does not change the conclusion of the Seeking Alpha article.

————

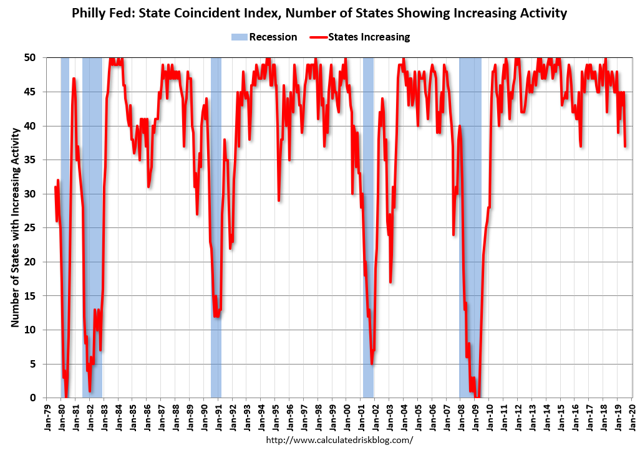
And while I am at it, the below graph of the Philly Fed state coincident indicators, which were updated last Thursday, comes by way of Bill McBride a/k/a Calculated Risk:


This is a diffusion index, showing how concentrated or widespread any weakness is. At 37 states, this shows weakness — but is equal or higher to 7 prior occasions in the past 40 years when no recession followed.

If this index were to fall to 35, the number of false positives falls to to 2 - a much stronger signal. Below 35 there is only one false positive.

Sunday, August 25, 2019

On Appeasement


 - by New Deal democrat

Sometimes on Sundays I leave the dreary world of economics behind and write of broader things.

Since most tomes covering American history have an underlying sunny optimism that is nowhere appropriate for our times, recently I’ve been reading more world history having to do with the rise of fascism or fall of democracy. Several of those books have been disappointing: they are thorough blow by blow descriptions, without organizing the material enough - or simply not including any material - to make a judgment about the underlying dynamics.

On such book is Tim Bouverie’s “Appeasement,” which as is obvious from the title, chronicle’s the UK’s, and in particular Neville Chamberlain’s, policies towards the rise of Hitler Germany in the 1930s.

There are three important issues with regard to the policy of Appeasement:

1. Was it at any point appropriate? (a question I never would have even included before reading this book)
2. Was it, at least temporarily, a necessary evil?
3. Did Chamberlain use it to “buy time” for the UK to re-arm in order to fight a war with Germany?

Only the second question gets an adequate answer from Bouverie’s book.

On the first issue, it is clear that Hitler’s initial moves into the Saarland and Rhineland, and to some extent even the Anschluss with Austria, were not opposed by either Britain or France not just because they believed they were not in a military position to do so, but also in substantial part because it was felt that Germany had an understandable grievance as to the former, and a reasonable claim for the unification of ethnic Germans as to the latter.

Since both of those acts by Germany were in direct violation of the Treaty of Versailles, it necessarily follows that by the 1930s there was a feeling on the part of Britain and France that the Treaty was indeed too draconian. As to which in a footnote on p. 46 Bouverie drops the  following bombshell:

“Keynes[‘s ‘The Economic Consequences of the Peace’] was later criticized by anti-appeasers for ... having produced ‘the Bible of the Nazi movement.’ ... [or being] one of the ‘most harmful’ books ever written. These views have been endorsed by recent scholarship which makes clear that the Treaty of Versailles was n[ot] as punitive as the Germans claimed ....”

This is quite simply a stunning, major assertion, and as the blog saying goes, “extraordinary claims require extraordinary evidence.” Bouverie produces exactly zero facts to back up this assertion. Since it completely contradicts at least an important portion of the appeasers’ initial motivations, the failure to do so is a remarkable failure by the author. After all, if the Treaty of Versaille wasn’t really so bad, why wouldn’t there be a much stronger impetus to nip any violation in the bud?

Especially since it wasn’t only Keynes who came to the conclusion that the Treaty of Versailles was a disaster. Herbert Hoover, who during World War I was personally and directly responsible for saving the lives of millions of Belgians and French in occupied German territory by organizing a massive food program that crossed enemy lines, also attended the peace conference, and also was aghast at the Carthaginian terms imposed on the civilian German populace. And Woodrow Wilson himself recoiled at the punitive terms, agreeing to the Treaty only because Lloyd George and Georges Clemenceau made sure that it was the only way he got his beloved League of Nations.

The second issue is better addressed. Unless the UK and France were willing to go against their own populations, and despite their poor preparation, Appeasement at least in the early stages was a necessary evil. While those who had read ‘Mein Kampf’ had no illusions about HItler’s aims, starting another World War without at least giving Germany a chance to demonstrate that it was acting in a good faith manner, with limited aims, was hardly an abdication of statesmanship. Only when Hitler showed that he intended to enforce his will on other states regardless of their own desires, as he first did with the Anschluss (invading Austria quickly in part to make sure that a plebiscite on the issue - that unification would likely have won - could not take place), did it become apparent that Hitler’s Nazi Germany was a malicious international actor.

But of course there were two ways of employing Appeasement. It could be one part of a dual strategy that actively pursued re-armament in case Germany was not to be trusted at the same time as Germany was being given a chance. Or it could simply be a  cowardly supplication. It seems that as originally envisioned by Britain’s Foreign Office, the first strategy was the case.

But it becomes quite clear throughout Bouverie’s book that Chamberlain proverbially “drank his own kook-aid,” believing that his own diplomatic ability (which was pitiful) would cause German grievances to be sated, and thereby ensure peace. Throughout the entire period of his Prime Ministership, Chamberlain undercut his own diplomats by signaling officially or through secret back channels that he was willing to give Germany pretty much whatever it wanted, so long as it did not affect the UK or France directly. Indeed, even *after* war was declared in September 1939, during the period of the “phony war,” Chamberlain employed back channels to signal that if Germany were willing to enter into a more permanent peace, the UK was willing to listen.

Which brings us to the third issue. There’s been a revisionist strain in the past ten years that asserts that Chamberlain was aware that war was likely, and used Appeasement to buy time so that the UK and France could be better prepared. This is an outgrowth of the “dual strategy” I mentioned above.

And here once again Bouverie’s narrative falls woefully short. Chamberlain agreed to certain re-armaments, but it is mentioned only in passing that he refused to do so at any scale that would have diverted resources from normal peacetime business (Americans would clearly recognize this as being the archetype of a country club Republican). This is a devastating point that deserved a much fuller explication. 

Further, in his concluding chapter, Bouverie only discusses the rearmament issue for three paragraphs on pp. 413-14, pointing out that the UK and perhaps even more importantly France had big advantages in 1938 if any conflict broke out along the Rhine. Further, pre-Munich, Czechoslovakia was no bantamweight. It could have tied down or at least slowed down any German advance to the East while Britain and France were attacking the Rhineland. The Soviet Union was a wild card, but it too had made commitment to Czechoslovakia. In any event, the anti-Bolshevik British Torres made no timely approaches to the Soviets.

Finally, on p. 419 - the last page of the book - Bouverie devotes a paragraph to noting that the “buying time” arguments are ex post facto, stating that Germany out-armed Britain during 1938-39, and that Chamberlain viewed Appeasement as a permanent, not temporary solution. Hence, his “reluctance to increase rearmament [even] after Munich.”

But a refutation to the “buying time” thesis demands much more than 4 paragraphs in an entire book about Appeasement. In particular all evidence of Chamberlain’s foot-dragging on rearmament after the Anschluss and after Munich deserves a much fuller examination.

In the end the book is a powerful indictment of 1930s Toryism in general. As mentioned above, not just Chamberlain but most of the party approached Nazi Germany much as a businessperson might have approached a fellow oligopolist about dividing a market. An American (FDR?) is quoted as calling Chamberlain “a City man,” and a member of his cabinet, Duff Cooper, in his memoir wrote:

“Nobody in Birmingham had ever broken his promise to [ ] Mayor [Chamberlain]; surely nobody in Europe would break his promise to the Prime Minister of England.”

With 80 years of hindsight, it is clear that the indictment of Appeasement as a failure stands. It is a shame that this book fails to adequately address two of the three central issues surrounding it.

Saturday, August 24, 2019

Weekly Indicators for August 19 - 23 at Seeking Alpha


 - by New Deal democrat

My Weekly Indicators post is up at Seeking Alpha.

There was marginal deterioration in a number of short leading and coincident indicators this week.

As always, clicking over and reading should bring you up to date on the economy as well as rewarding me a little bit for the effort I put in.

Friday, August 23, 2019

July new home sales disappoint, but improving trend intact


 - by New Deal democrat

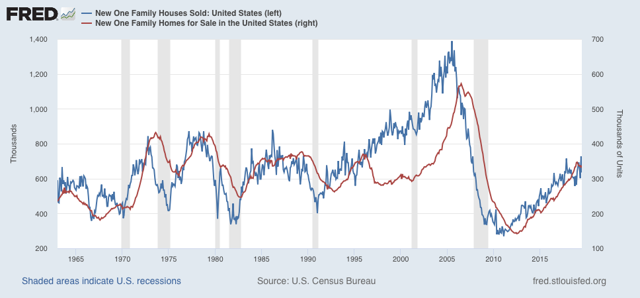
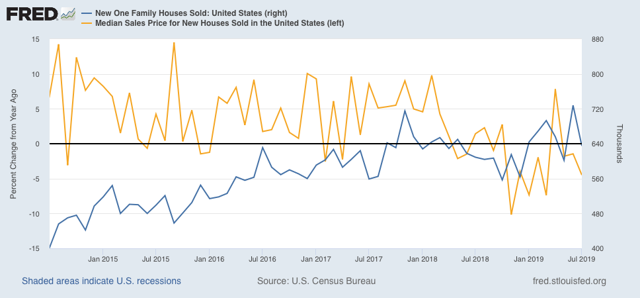
New home sales came in this morning at a light 655,000 annualized for July, the second lowest monthly amount this year. But at the same time, sales remain clearly higher than their bottom at the end of last year. This metric is very volatile and heavily revised, so I pay less attention to it than permits and starts. In the two graphs below, it is shown in blue, and compared with inventory of new homes for sale (red, right scale):


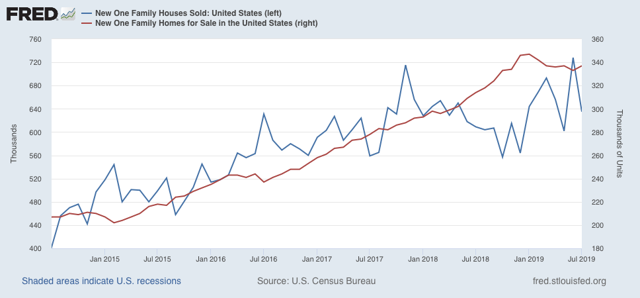
Note that sales clearly lead inventory. The below close-up of the past 5 years bears this out:


Sales are already recovering, while inventory remains slightly off its peak.

Prices (gold in the graph below, measured as YoY% change) usually lag sales (blue), but last year they followed sales down almost immediately, and remain negative YoY:


The combination of lower prices and lower mortgage rates should help out the rebound in sales from the end of last year.

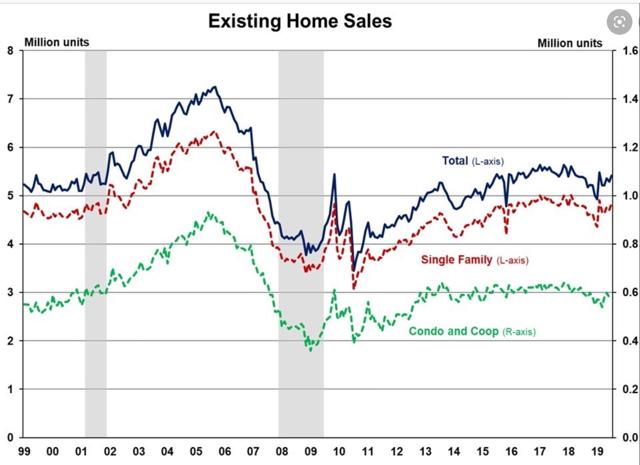
Meanwhile, the economically less important existing home sales, reported earlier this week, continued to rebound:


Housing is flashing weak positive signs for economic growth next year. The question remains whether it will be enough to overcome other headwinds, like a decline in corporate profits and a stall in capital expenditures.

Thursday, August 22, 2019

An extended look at jobless claims, and a note about payrolls


 - by New Deal democrat

Let’s take an extended look at jobless claims, with a side note about payrolls.
First, I have started to monitor initial jobless claims to see if there are any signs of stress.

My two thresholds are:

1. If the four week average on claims is more than 10% above its expansion low.
2. If the YoY% change in the monthly average turns higher.

Here’s this week’s update.  
Initial jobless claims last week were 215,000. This is in the lower part of its range for the past 18 months. As of this week, the four week average is 6.5% above its recent low:


Additionally, the YoY change remains -1,500 below where it was last year:


With one week to go, so far this month is averaging about -1,000 less than August of last year.

The less leading but also less volatile 4 week average of continuing claims was essentially unchanged, and remains slightly (-2.2%) below its level of one year ago:


Bottom line: jobless claims are still positive, if weakly.

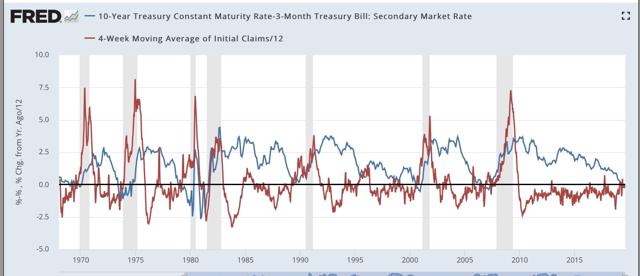
Second, with all the brouhaha about the yield curve inversion, I thought I’d take a look at the history of jobless claims (red in the graphs below) vs. the 10 year vs. 3 month yield curve (blue):


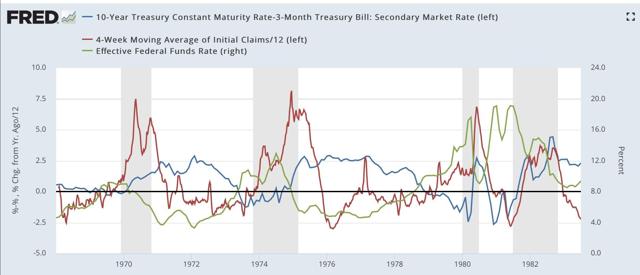
This is a 50+ year history, and every single time the yield curve inverted, during the period of that inversion initial claims turned higher YoY.

Here is a close-up on the past several years:
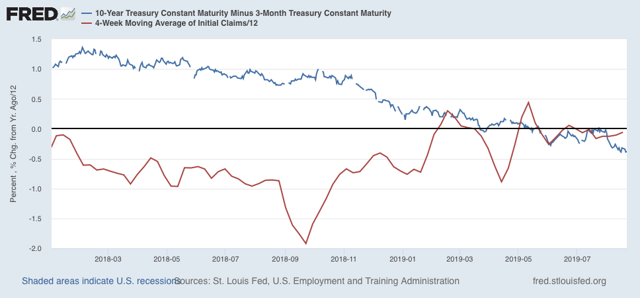


If the yield curve inversion persists, there is every reason to believe that jobless claims will increase YoY, which, as outlined above, would be a serious short term negative indicator for the economy.

In this next graph, I also added the Fed funds rate (green, right scale). All we care about here is when it declines in comparison with the other two data series:

The inflationary era:

The more recent disinflationary era:
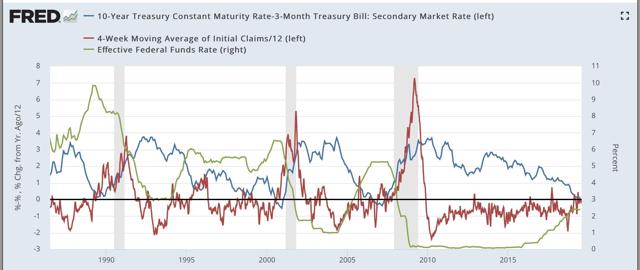
When the Fed has waited beyond the point where initial claims have turned meaningfully higher YoY to start to lower rates, that has meant a recession is on the way.  

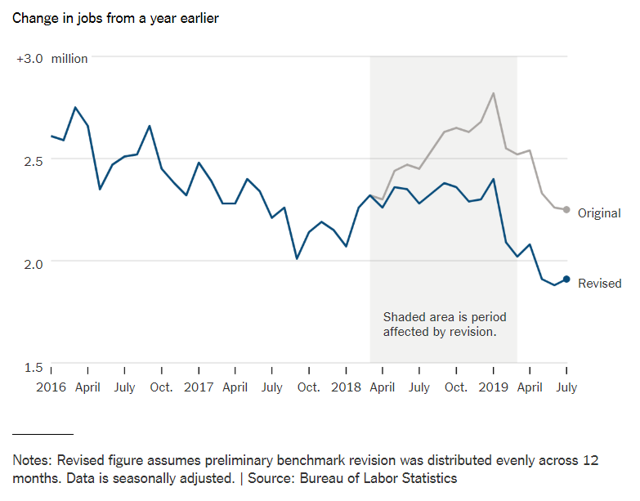
Third, and finally, yesterday the BLS indicated that the comprehensive measure of employment records from the states revealed that about -500,000 fewer jobs were added to the economy between March 2018 and March 2019. That’s a major downward revision.

While we won’t have precise monthly revisions for another 6 months, here is the best graphic estimate I found yesterday of what that will look like:


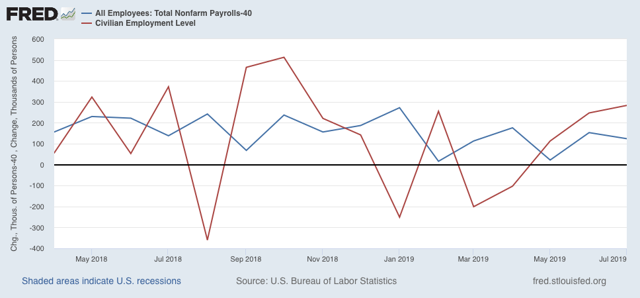
Since the average revision was about -40,000 jobs per month, if it were to have persisted through July, here is what that would look like (blue) compared with the existing alternative jobs number from the household survey (red):


This strongly suggests that the weak household employment numbers we’ve been seeing this year have been signal, not noise. According to that survey, only about 350,000 jobs have been added this entire year so far.

Beyond that, we’ve been seeing a series of important downward revisions to a variety of data recently, including in monthly payrolls reports and unit labor costs. This is the kind of thing that happens at negative turning points. Which means it is especially important to keep an eye on data, like jobless claims (after one week) and the ISM manufacturing index, that don’t get revised.
Wednesday, August 21, 2019

Not doomed yet v.2.0: beware recession porn


 - by New Deal democrat

Way back when I first started writing online almost 15 years ago, my very first post on Daily Kos was a little note called “Not Doomed Yet.”  It was pretty pathetic compared with the standards of my writing since the Great Recession, but the point of it was, back in 2005, that the conditions necessary for an economic downturn hadn’t quite happened yet.

Needless to say, it went nowhere. To the contrary, my big recollection is that my posts that got the most attention by far were the ones I wrote once I did see that a recession looked baked in the cake. The simple fact is, when it comes to online clicks and reads, DOOOM sells.

This is a timely reminder, because I have noticed across a variety of platforms in which the economy is discussed, including back at Daily Kos, but also including financial sites and Twitter feeds, a surge in recession porn, I.e., why we are DOOOMED. Usually although not always this is because people have suddenly discovered that whatever portion of the Treasury yield curve they have focused upon has an infallible record of predicting the end of the world.

Now, over a year ago I forecast a sharp slowdown during this year. Over six months ago I went on “recession watch” with a starting date of Q4. So I’ve seen this coming for a long time.  But I am disappointed to remind you, once again, that we are Not Doomed Yet.

There are at least three reasons for that.

First, while the “infallible” yield curve (except for the 1950s, 1966, and 1998) is forecasting recession, the *equally* “infallible” housing market (except for 2001) says no. 

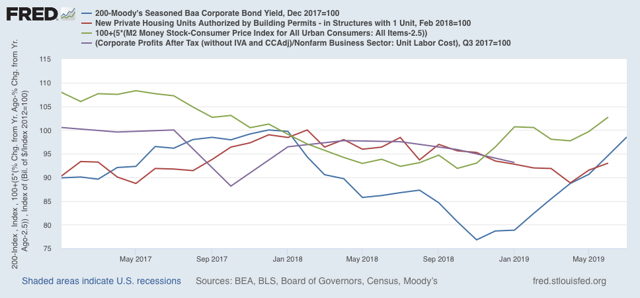
Additionally, long term interest rates have to fallen to, or at least near, expansion lows. Real money supply has been accelerating since the beginning of this year. Here’s what these long leading indicators look like together for the past 3 years:


This is at very least as consistent with a near-miss as it is with an actual downturn.

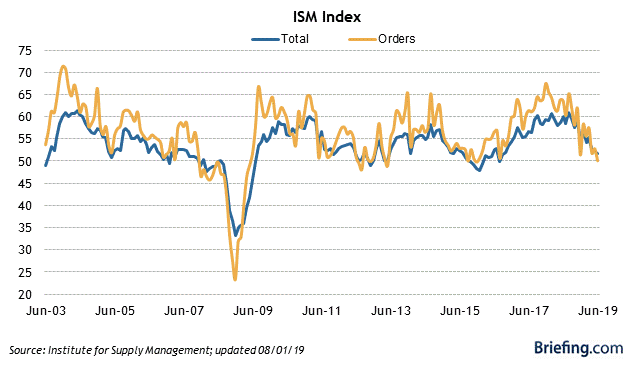
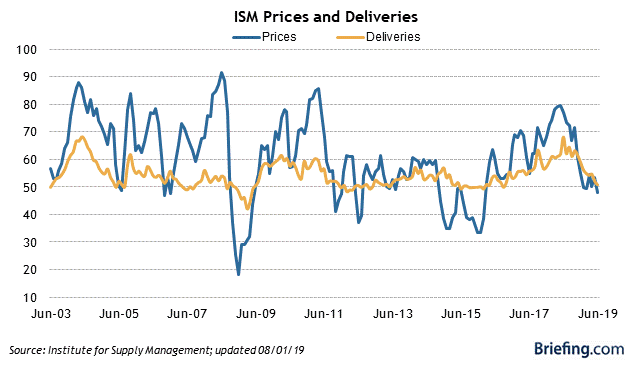
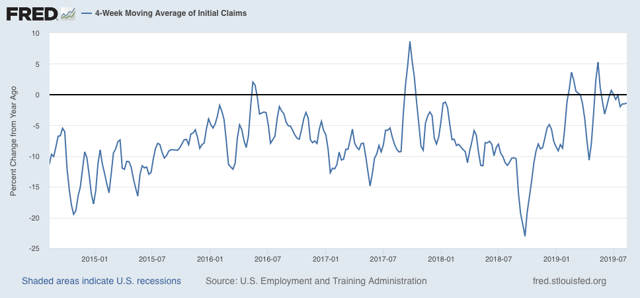
Second, the short leading indicators really haven’t confirmed the long leading indicators (of which the yield curve and housing are two) yet. In particular, neither the ISM manufacturing indexes (first two graphs  below) nor initial jobless claims (third) have turned negative yet:


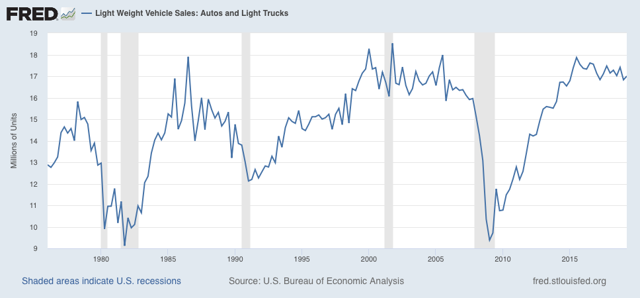
Additionally, durable goods orders and sales, most notably motor vehicles, (as highlighted by the model of Prof. Edward Leamer of UCLA, haven’t declined the 10% or so that they typically have before the onset of recessions:


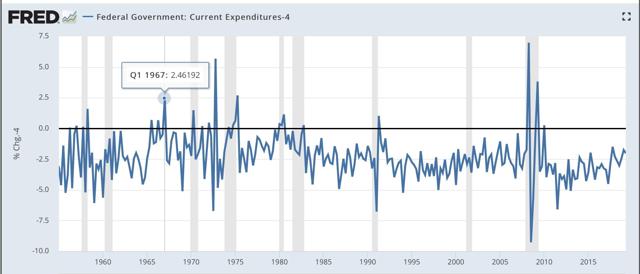
Third, as I pointed out when I went on “recession watch,” the economy is a “second order chaotic system.”  That occurs when the thing being observed has the ability to observe right back, and react to your “infallible” forecast. In the case of the economy, that means either fiscal stimulus (LBJ’s 1966 “guns and butter” budget - note that in the graph below I have subtracted  4% so that the actual q/q increases in expenditures during 1966-67 are as much as 6.5% ):


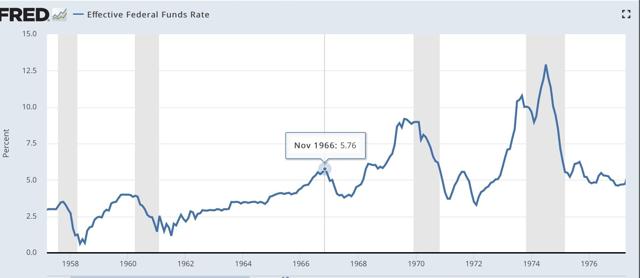
and/or monetary (the 0.75% easing by the Fed at the end of 1966 into early 1967):


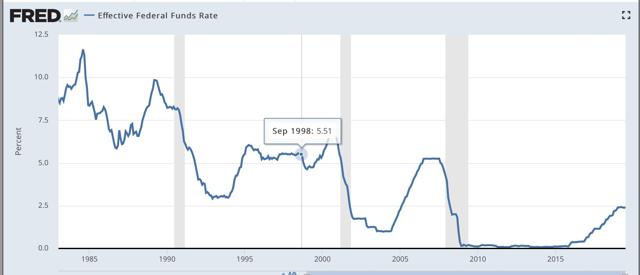
(or the 1% easing in the three months immediately after the implosion of Long Term Capital Management in 1998):


So far, there has been neither (the recent 0.25% drop in the Fed funds rate merely took back the 0.25% *increase* the Fed implemented *after* the mid-portion of the yield curve started to invert last December). But that could still change.

Finally, there are some people already trumpeting the “Trump recession” with not-so-hidden glee. Let me point out that if a recession happens several million of their family, friends, neighbors, and countrymen will be thrown out of work, and in general there will be a lot of suffering. Also, there is a substantial chance no recession happens — in which case Trump can crow about his “economic stewardship” and besting his critics. Is that something his critics really want to chance? If people want to make political hay about a poor economy, personally I would suggest waiting until there is an actual decline in monthly payrolls before declaring it so.

In the meantime, I suggest lots of caution in your reading of recession porn.

Tuesday, August 20, 2019

What would need to happen next for a producer-led recession


 -by New Deal democrat

If you clicked over and read my last post at Seeking Alpha, I mentioned that I wanted to follow up with examinations of the state of the producer side of the economy, as well as the short leading indicators.

The first half of that is done, and is up at Seeking Alpha. I don’t think all the shoes have dropped, that need to drop if the producer side is going to turn into contraction.

As usual, clicking over and reading drops a coin or two into the till for me.

Monday, August 19, 2019

Why the revised Q2 GDP report next week may be the most important release in 10 years


 - by New Deal democrat

Last Thursday there were major backward revisions to unit labor costs. Since corporate profits deflated by unit labor costs are a long leading indicator, this had a big negative effect on the forecast for the next six months or so. Corporate profits for Q2 of this year will be released next week as part of the first revision of the GDP report, and because of the effect on the forecast, might be the most portentous report in 10 years.

This post is up at Seeking Alpha.

As usual, clicking over and reading helps reward me a little bit for my work.

Saturday, August 17, 2019

Weekly Indicators for August 12 - 16 at Seeking Alpha


 - by New Deal democrat

My Weekly Indicators post is up at Seeking Alpha.

The data continues to be dominated by a steep decline in long term interest rates. These have both inverted further portions of the yield curve and reinvigorated the housing market.

As usual, clicking through and reading should not only be educational for you, but put a penny or two in my pocket to reward me for my efforts.

Friday, August 16, 2019

Positive July housing permits and starts


 - by New Deal democrat

The housing starts and permits report this morning for July adds to the positive data looking forward to H2 2020 (or, possibly, less bad - but that’s another discussion).

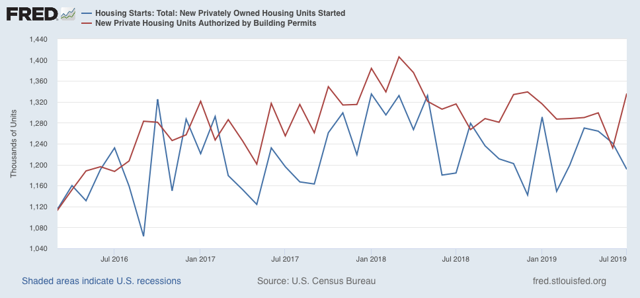
First, here are overall permits (red) and starts (blue):


While the very volatile starts declined, the slightly more forward looking and less volatile permits rebounded off their low to a 6 month high.

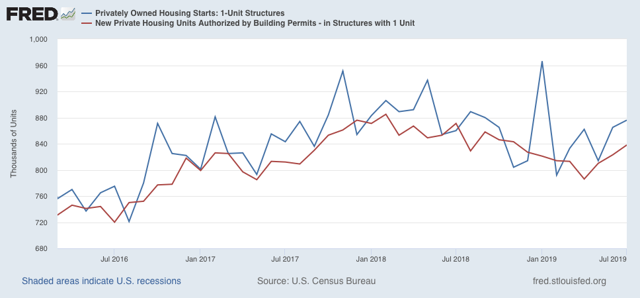
The less volatile single family permits (red) and starts (blue) were even more positive:


Single family starts were at an 8 month high. The more forward looking and least volatile single family permits made a 9 month high.

Lower interest rates are now clearly feeding into the housing construction market. This is a positive 12+ months out.

There are two issues. The first is whether house prices advance so quickly that they eat up the savings purchasers would otherwise pocket. This is the “housing choke collar” theory I have recently advanced. The second is that this in no way negatives the potential for a recession this winter, much as the advance in housing in 2000-01 did not prevent the 2001 producer led recession.

Thursday, August 15, 2019

Industrial production, jobless claims, and retail sales


 - by New Deal democrat

As I noted this morning, a slew of important data was released. Let me deal with the “normal” weekly and monthly data in this post. 
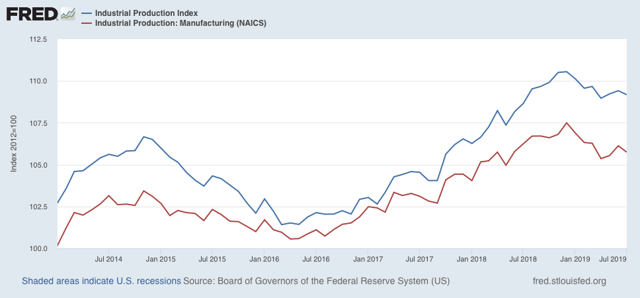
First, industrial production continues to languish, down significantly from the end of last year, whether measured in total or just as to manufacturing: 


The saving grace here is that it has not declined as much as it did during the 2015-16 “shallow industrial recession” which was not sufficient to cause the economy as a whole to contract.

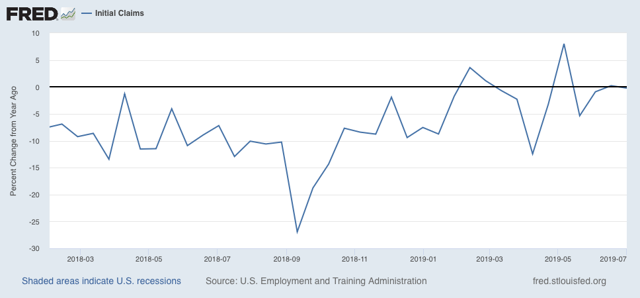
Second, initial jobless claims rose, and are (slightly) higher YoY for the first two weeks of August:


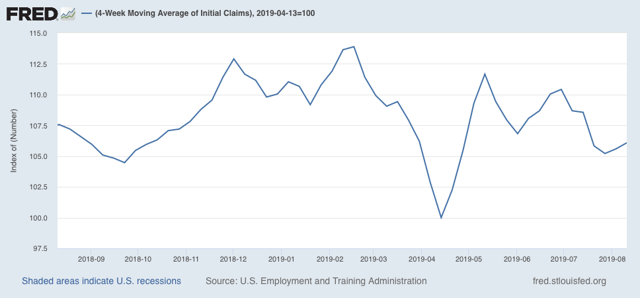
The 4 week average is only about 6% higher than their trough this past April:


The four week average of continuing claims, which is much less volatile, is about -2.5% lower than it was a year ago. Should it turn higher YoY, that would be a yellow flag; if it were to reach 10% higher, that has always meant recession:


For now, jobless claims are just showing a slowdown.

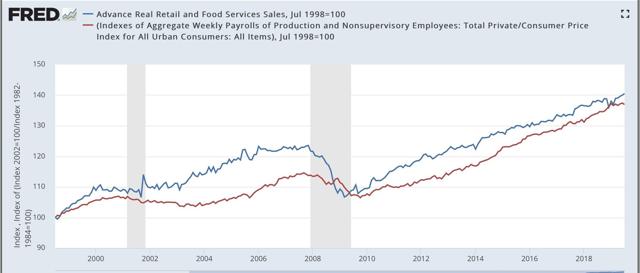
Finally, real retail sales (blue) rose 0.4% to another new high in July:

Here’s the longer term look for the past 20+ years:


The red line is real aggregate payrolls. Since sales tend to lead payrolls (note the former flattened out about 6 months before the latter prior to each of the last two recessions), this is an encouraging sign. 

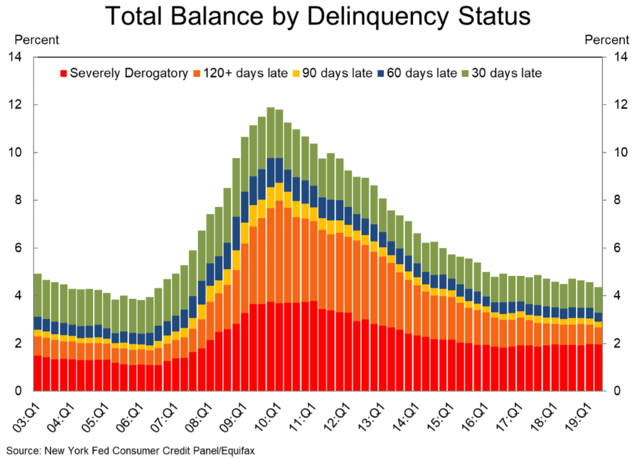
A couple of other recent data points also suggest that the consumer continues to be in decent shape. The NY Fed’s report on consumer debt delinquencies was released this week, showing a slight decline to expansion lows:


If the consumer were getting stressed and ready to cut back, I would expect this metric to be rising.

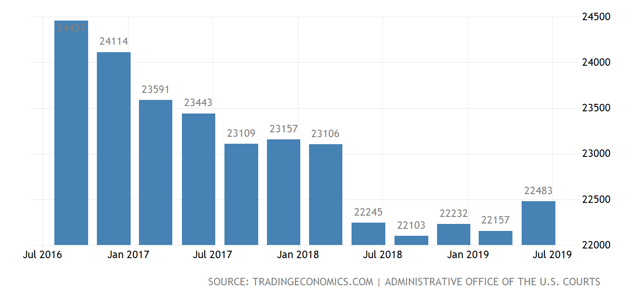
Also, the American Banking Association’s report on consumer bankruptcies showed only a small uptick from expansion lows during the 2nd Quarter:


Right now the consumer, relatively speaking, is doing pretty well. If we are on the cusp of a recession, it is almost certainly going to be producer led.
Quick hits on a major Thursday economic news blitz


 - by New Deal democrat

There has been a ton of significant economic news this morning. I’m not going to be able to get to all or even most of it in depth. So I am going to leave a quick rundown here.

Starting with the positive:

-nominal retail sales up +0.6%, up +0.3% in real terms, up +0.2% Per Capita. This is another new high and suggests the US consumer continues to be in good shape (relatively speaking). Note that much of this apparently has to do with Amazon “Prime Day” purchases, and if the seasonal adjustments are off, this could easily be a false positive.
-Both the NY and Philly Fed indexes higher, including new orders for both. No indication here that manufacturing is rolling over.
-The manufacturing component of industrial production higher, again suggesting that manufacturing is not rolling over (although this is still below its December high point).

The negative:

- overall industrial production was negative - again! Industrial production as a whole has remained in a decline off its high in December of last year. This is the premier coincident economic indicator, even more than payrolls.
- initial jobless claims higher YoY on both a weekly and monthly measure. It is not more than 10% higher than its recent lows, so overall is a neutral not a negative.
- the 2 year to 10 year treasury spread briefly inverted again this morning, although once again it has rebounded to positive.
-a MAJOR negative: unit labor costs for the last five years revised higher, meaning that adjusted corporate profits (a long leading indicator) peaked back in 2014, and were almost 15% lower than that as of Q1 of this year. The placeholder proprietors income is also slightly lower through Q2 than its peak in Q4 of last year.

I’ll try to post one or two things in detail later.

Wednesday, August 14, 2019

A note on the stock and bond markets


 - by New Deal democrat

No economic data releases today, but a little kerfluffle in the markets.
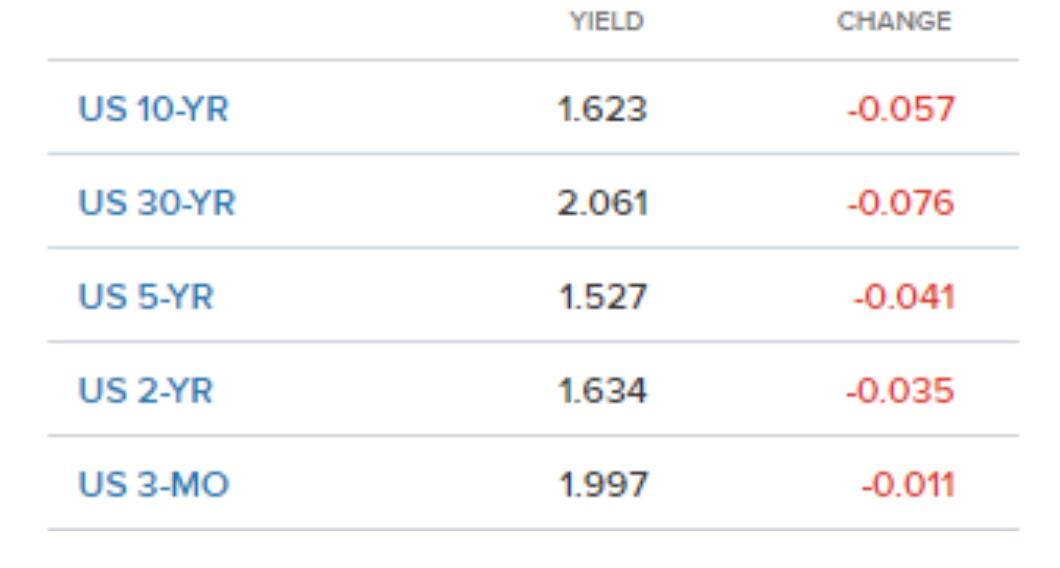
First of all, in case you missed it, the 10 year to 2 year bond spread briefly inverted early this morning. Here’s the screenshot from CNBC:

As I say, it was brief. As I type this, the spread has reverted to normal.
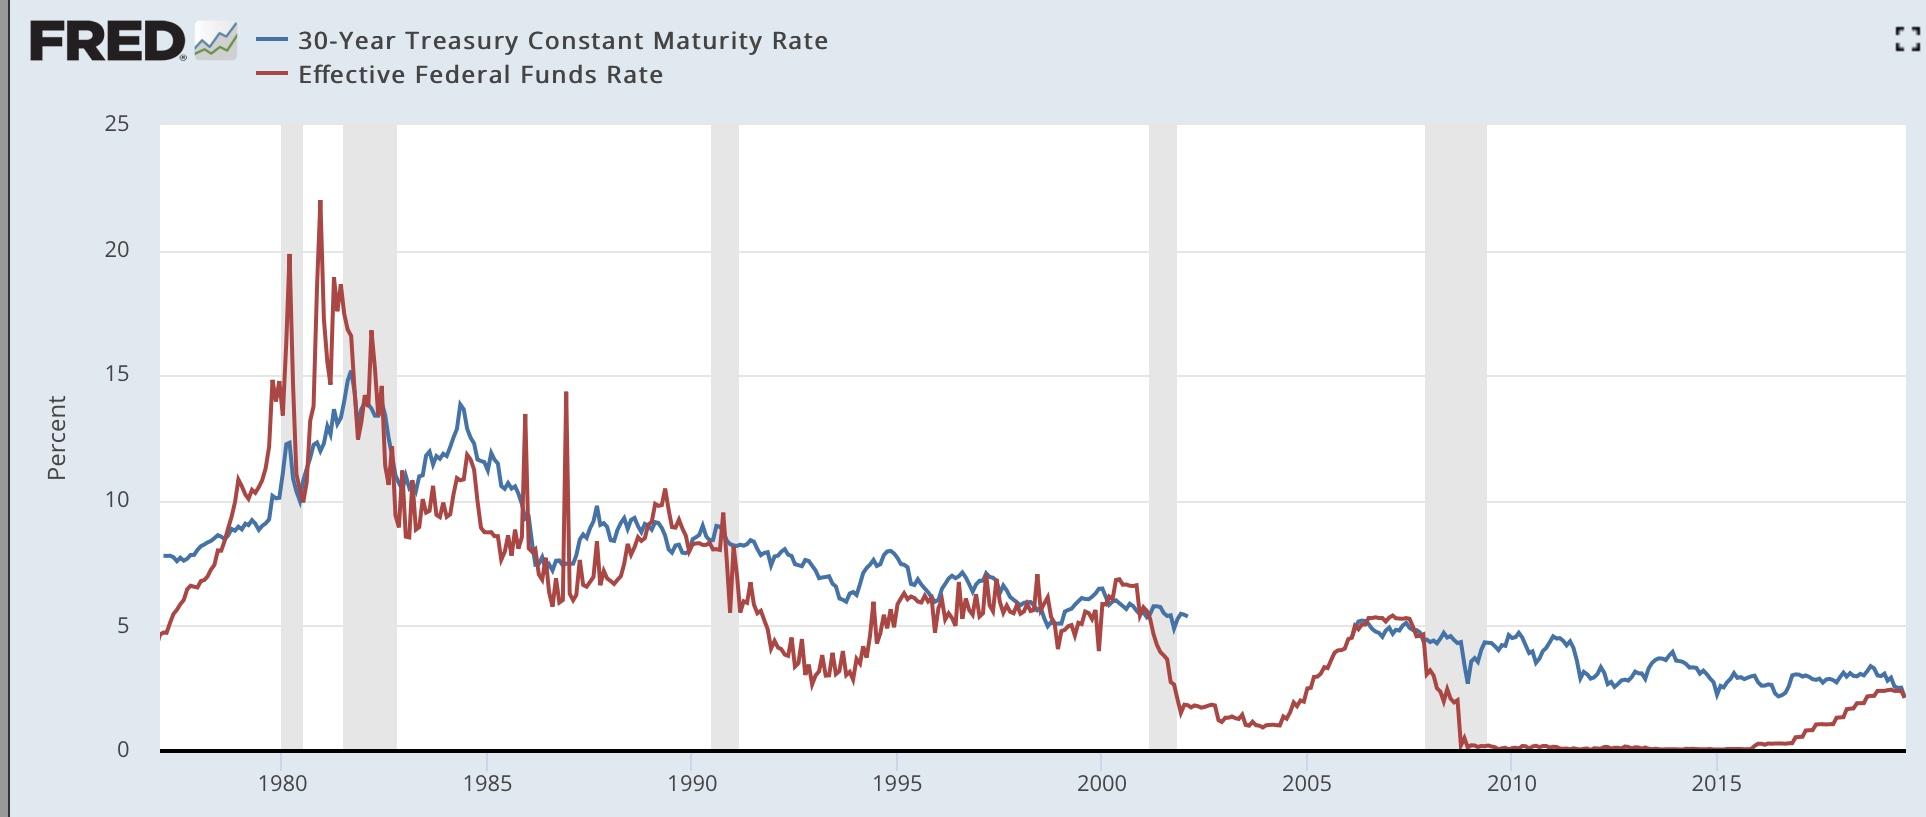
But another significant spread inverted yesterday, and has remained inverted today: the 30 year bond vs. the Fed funds rate. The Fed funds rate is currently at 2.12%, and beginning yesterday afternoon, the 30 year bond yield went lower than that. As I type this, the long bond is yielding 2.05%, an all-time low. Here’s the lifetime chart:

As a caution, note that this spread also inverted for a few days several times in the mid-1980s and mid-1990s, as well as for a month and a half in 1998, without signaling recession. Most importantly, the Fed acted swiftly in 1998 to cut rates.
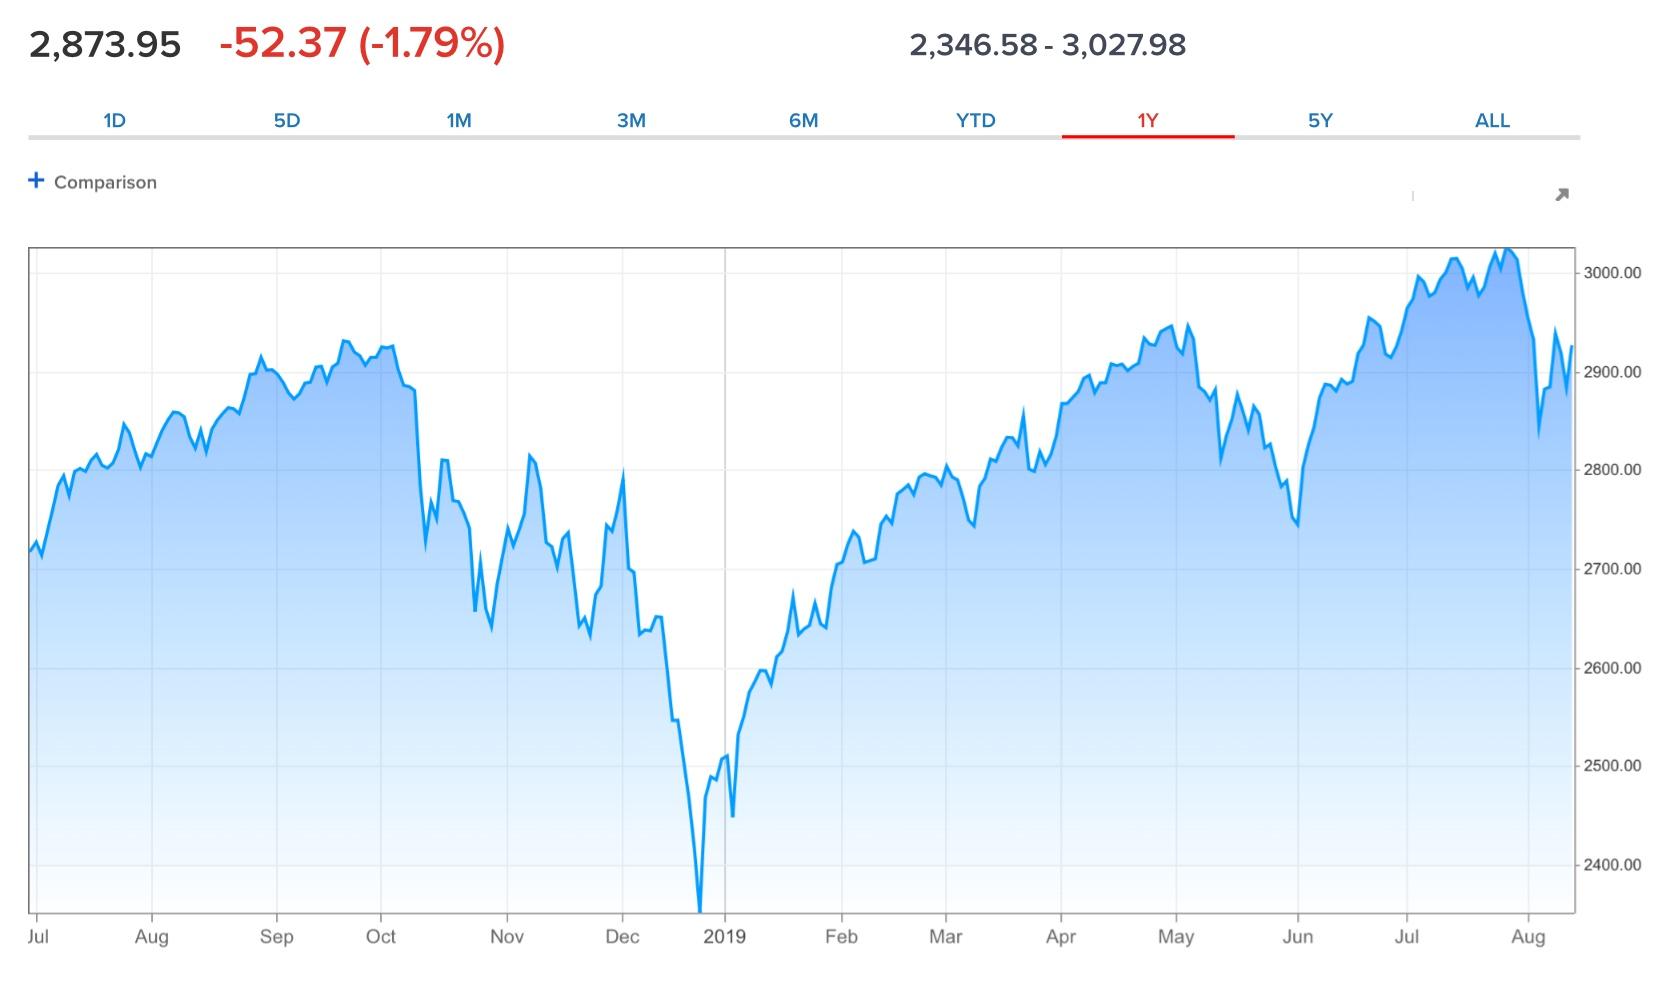
As it did last December when the first portions of the yield curve inverted (in the 2 to 5 year range), the stock market is taking this badly:

The stock market is up over 20% since that bottom.
Here is my takeaway from this morning:
1. The more portions of the bond yield curve invert, the stronger the negative signal.
2. BUT, we still have the counter-examples of 1966 and 1998, where the inversions were met with fiscal stimulus (1966) or prompt interest rate cuts (1998) and no recession occurred.
3. Even if the yield curve is signaling a recession in the near future, it doesn’t mean there is one arriving imminently. A strong stock market sell-off like December’s would be an overreaction.
4. If the further yield curve inversions mean a recession this coming winter, we ought to be seeing signs of either consumer weakness in retail sales (reported tomorrow) or corporate profits (reported for Q2 in two weeks in the revised GDP report).
I plan on doing a more detailed look at the consumer tomorrow after retail sales for July come out.

Tuesday, August 13, 2019

Real average and aggregate wage growth for July 2019: yellow flag for aggregate wages


- by New Deal democrat

Now that we have the July inflation reading, let’s take a look at real wages.

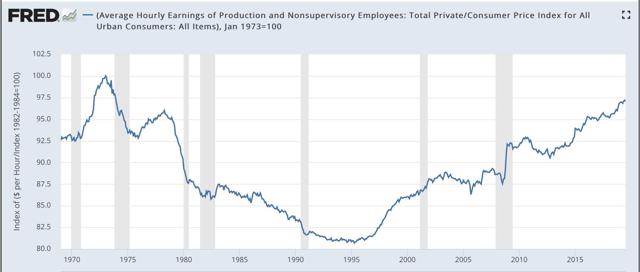
First of all, nominal average hourly wages in June increased +0.2%, while consumer prices increased +0.3%, meaning real average hourly wages for non-managerial personnel decreased -0.1%. This results in a slight decline of real wages to 97.0% of their all time high in January 1973:


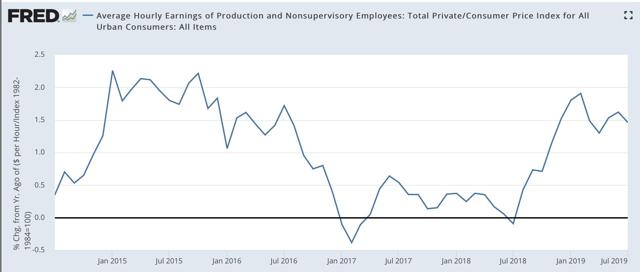
On a YoY basis, real average wages were up +1.5%, a decline from their recent peak growth of 1.9% YoY in February:


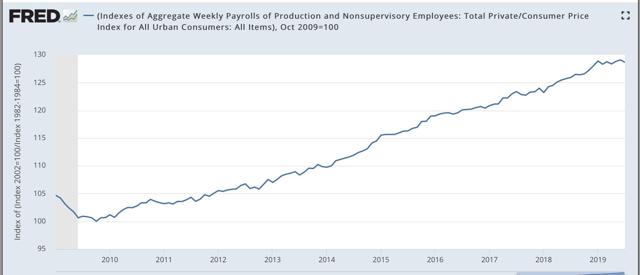
Updated through July, real aggregate wages - the total amount of real pay taken home by the middle and working classes - are up 28.7%  from their October 2009 low:


For total wage growth, this expansion remains in third place, behind the 1960s and 1990s, among all post-World War 2 expansions; while the *pace* of wage growth has been the slowest except for the 2000s expansion.

Finally,  two months ago I raised a concern that real aggregate wages had decelerated sharply this year, writing that “real aggregate wage growth has typically decelerated by 1/2 or more from its 12 month peak just at the onset of recessions, although there have been 3 false positives coincident with slowdowns.” Last month that concern  disappeared. As of this month it re-appeared, as YoY growth has declined to 2.2% vs. 4.9% at the beginning of this year, and is actually -0.2% below its level in January:


Still, we have had two similar declines already during this expansion, so I would characterize th is metric as a yellow flag vs. a red flag at this point.

Monday, August 12, 2019

My preliminary long leading forecast through midyear 2020


 - by New Deal democrat

This post is up at Seeking Alpha.

This is my first look at economic conditions into next summer. I suspect that it is contrary to most punditry that you will read.

In any event, as usual clicking over and reading helps reward me for the effort I put in to this endeavor.