- by New Deal democrat
Amount 10 days ago, I wrote that backward revisions to adjusted NIPA corporate profits meant the long leading indicators were more negative than originally believed one year ago. Which means that watching the short leading indicators for signs of rolling over became more important.
I took a comprehensive look at the short leading indicators late last week. This post is up at Seeking Alpha.
As always, clicking over and reading helps put a penny or two in my pocket for my efforts.
——
Addendum: Based on the outcome of the above post, one of the two data points I said I would particularly pay attention to this week was this morning’s durable goods reports. This came in positive as to both total new orders and “core” orders less defense and Boeing:
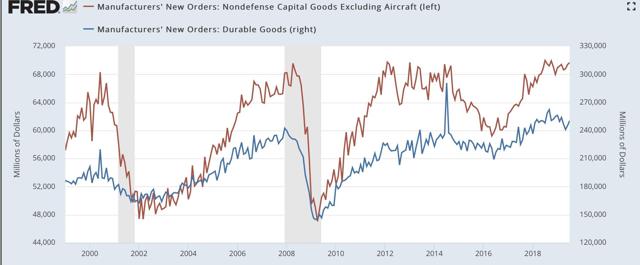
The YoY trend is still deteriorating, with total orders up +1% YoY, and “core” new orders down -0.5% YoY.:
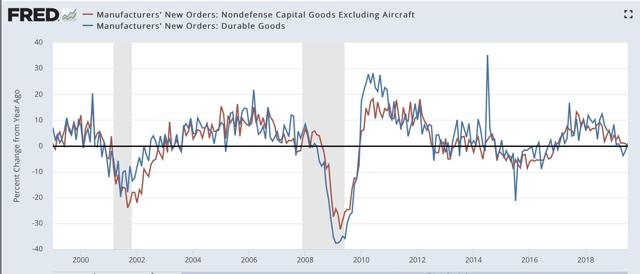
“Core” orders are flat, but not suggesting recession, while manufacturers’ new orders are consistent with a recession. This does not change the conclusion of the Seeking Alpha article.
————
And while I am at it, the below graph of the Philly Fed state coincident indicators, which were updated last Thursday, comes by way of Bill McBride a/k/a Calculated Risk:
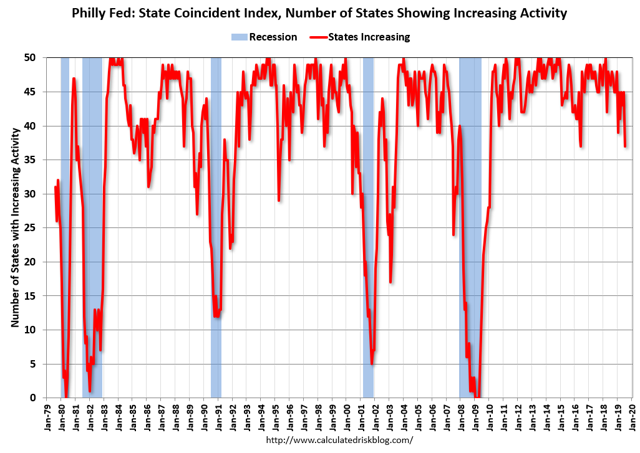
This is a diffusion index, showing how concentrated or widespread any weakness is. At 37 states, this shows weakness — but is equal or higher to 7 prior occasions in the past 40 years when no recession followed.
If this index were to fall to 35, the number of false positives falls to to 2 - a much stronger signal. Below 35 there is only one false positive.