Tuesday, February 5, 2013

Is the US Economy Moving Into A Higher Growth Phase? Part I; the Positive

I wrote a four part series last week discussing the possibility of a new bull market opening up.  While the technical side of the markets favored the bulls, I was deeply concerned that the overall economic environment was too negative to support a strong move higher.  Here was my conclusion:

To sum up the national and international position, I just don't see strong enough overall growth in any economy to warrant a strong long position right now.  The best reading of the data is that we'll see a stronger second half, with the US housing market providing sufficient domestic stimulus combined with a more settled fiscal situation.  This would also allow the EU to continue strengthening or bottoming. The stronger second half argument leads could lead into the fact that the market is a leading indicator of anticipated future activity -- a fair point as far as it goes, but I just don't see the overall underlying strength to support the rally long term.

Then came Friday's move higher, which led me to question my analysis yet again.  Over the weekend, I realized that my conclusion was based on a macro reading of other world economies, and not the fact that the US being the largest world economy could achieve a level of growth sufficient to propel it beyond the 2% GDP growth rate we've seen for the last few years.  In addition, for the last few years I've been wedded to an analysis that calls for US growth between 0%-2% (an analysis that has been mostly correct).  

So, as a thought exercise, let's look at a few data points that support the idea the US is about to move into a period of higher growth.

Housing

If any sector can help to move the economy into a higher gear, it's housing, largely because it provides a tremendous multiplier.  When a house is built, it requires a large amount of raw materials converted into useful items (wood, copper, etc..).  There is also a decent amount of labor involved.  Finally, there is a large amount of durable goods that go into a house (furniture and appliances).  All of these factors add up to a decent multiplier for the macro economy as a whole.

For me, the real story of housing is the low inventory levels we're seeing at the macro level, as shown in the following two charts.


The top chart of new homes inventory shows levels at some of their lowest levels in 40 years, while the lower chart if existing homes shows that levels are now at far more normal levels.  These inventory levels have led to price increases, as shown in the year over year percentage change in the Case Shiller index:


Finally, the low levels of inventory have led to a big increase in new home construction, as shown in the housing starts figures:
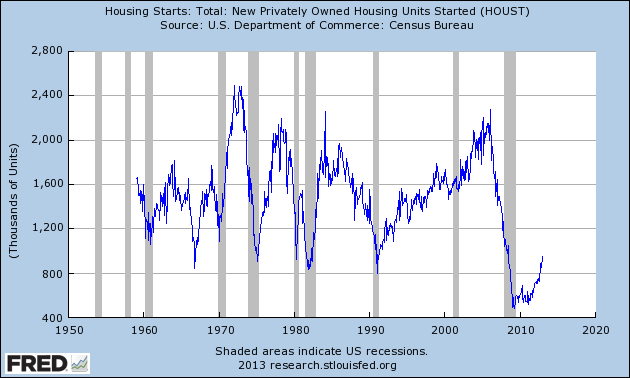

Although they are coming off a low level, housing starts have clearly picked up and are rising at a strong clip.

Also note residential construction increased 22.3% last year -- a very strong number.

In short, housing still remains a big reason why the US economy may kick into a higher growth rate.

Auto Sales

Sales of cars and light trucks have been in a strong uptrend since the bottom of the recession.


The top chart shows the figures for the last five years.  While we do have some dips in the figure, the overall upward trend is clear.  The longer chart (lower chart) puts the action in overall historical context.  The drop in activity during the Great Recession was the sharpest we've seen since 1980.  But now overall figures are at levels seen with the mid-1990s expansion.

The reason for the importance of auto sales is, like housing, they have a decent multiplier effect on the economy.  There are still a fair number of employees in this industry -- especially in the industrial Midwest -- the the process of making a car still requires a large amount of ancillary activity.

Manufacturing

The strongest evidence of a manufacturing resurgence is found in the latest ISM report, issued last week.  


The report was issued today by Bradley J. Holcomb, CPSM, CPSD, chair of the Institute for Supply Management™ Manufacturing Business Survey Committee. "The PMI™ registered 53.1 percent, an increase of 2.9 percentage points from December's seasonally adjusted reading of 50.2 percent, indicating expansion in manufacturing for the second consecutive month. The New Orders Index registered 53.3 percent, an increase of 3.6 percent over December's seasonally adjusted reading of 49.7 percent, indicating growth in new orders. Manufacturing is starting out the year on a positive note, with all five of the PMI™'s component indexes — new orders, production, employment, supplier deliveries and inventories — registering above 50 percent in January."

Of the 18 manufacturing industries, 13 are reporting growth in January in the following order: Plastics & Rubber Products; Textile Mills; Furniture & Related Products; Printing & Related Support Activities; Apparel, Leather & Allied Products; Electrical Equipment, Appliances & Components; Miscellaneous Manufacturing; Fabricated Metal Products; Transportation Equipment; Petroleum & Coal Products; Machinery; Primary Metals; and Food, Beverage & Tobacco Products. The four industries reporting contraction in January are: Nonmetallic Mineral Products; Computer & Electronic Products; Wood Products; and Chemical Products.


Simply put, the report above is very bullish.  It shows a broad path of growth over a variety of internal ISM figures (overall index, new orders, employment, supplier deliveries and inventories) along with a majority of industries growing.

The US report is confirmed by the latest Markit report:

The final Markit U.S. Manufacturing Purchasing Managers’ Index™ (PMI™)1 signalled a strong expansion of the U.S. manufacturing sector at the start of 2013. Moreover, at 55.8, below the earlier flash estimate of 56.1 but higher than that recorded in December (54.0), the PMI signalled the fastest rate of growth in nine months.

Here is a chart of Markit's overall figures:

 When looking for the reasons of the manufacturing increase, consider these points from the latest ISM report:
  • "Fiscal cliff, uncertainty in general and EU economic weakness are factors causing our customers to be very tentative with commitments for product purchases in 2013." (Machinery)
  • "Midwest drought impact will be felt at least through midyear, impacting protein, sweeteners, eggs, oils, emulsifiers, etc." (Food, Beverage & Tobacco Products)
  • "Slowing interest in high-dollar purchases reflects continuing economic uncertainty." (Miscellaneous Manufacturing)
  • "Expenditure and investment are expected to remain high in North America in Q1 and Q2, 2013." (Petroleum & Coal Products)
  • "Housing sales are trending upward in light of overall market uncertainty, translating to improving optimism in appliance market." (Electrical Equipment, Appliances & Components)
  • "Still waiting for reaction to consumer tax increases." (Fabricated Metal Products)
  • "Government spending is very low, probably due to the fiscal cliff and the looming debt ceiling." (Transportation Equipment)
  • "Business is improving." (Furniture & Related Products)
  • "The general theme developing in our industry is that we can move suitable volumes. However, profit margin is elusive." (Wood Products)
  • "Overall production volume decreasing. Decrease is led by decline in exports of 10 percent." (Chemical Products)
The good news in the report is from the housing market.  We see a statement to that effect along with business improvement in furniture and related products and increased orders in wood products.

It is interesting that these reports are not in sync with the regional Fed reports, a situation that I cannot explain.  

All three of the above sectors -- housing, autos and manufacturing -- are bedrock components of the economy.  If all three are doing fairly well, the worst that can happen is slow growth.  There is simply too much of a multiplier effect of the combined total for a recession to occur with the above three expanding.

However, this is before we get to the latest and upcoming fiscal follies from the idiots in Washington.  We'll touch on that tomorrow.


Morning Market Analysis; European Sell-Off Edition


The big story yesterday was the equity market sell off in Europe caused by political scandal in Spain (top two charts) and an upcoming election in Italy (bottom two charts).  The Spanish market's daily chart (top chart) shows that prices have dropped about  10% over the last few days.  PRices have fallen through all the shorter EMAs and the 10 day EMA is about to move through the 20.  Also note that technically, prices are already at the 50% Fib level -- a very strong technical shellacking.  On the Spanish weekly chart (second from top) prices have already broken the trend established in July of last year.

The Italian market charts (bottom two charts) have similar technical profiles, albeit a bit less several in their implications.  The daily chart (second from bottom) has only sold off to the 38.2% Fib level while the weekly chart shill has its long-term trend intact, albeit barely.


The sell-off also hit the French market, shich dropped over 3%, breaking a short, month-long trend.  The market is now in retreat, with the next logical target being the 61.2% Fib lever or the top Fib fan level.


Finally, there is the German market, which sold off right to technical support. 


Monday, February 4, 2013

The Super Bowl Power Outage and Our Terrible Infrastructure

There was a 30 minute black out during the Super Bowl last night, which seems like an appropriate time to bring up the terrible state of the US' infrastructure.

Here's the report card of the US' infrastructure:

Why the "Currency War" Meme Is Useless

I'm not sure who first coined the phrase "currency war."  By my recollection, it was first used over the last four years by Brazil, as they started to complain about low US interest rates lowering the dollar's value.  This in turn raised the price of commodities, which hurt Brazil which is more dependent on commodity exports for growth.  Regardless, this term continues to be used by a variety of sources and people.  But while this is a great way to gain traction for your website, it's terrible analysis that is factually incorrect for a number of reasons.

First, the standard policy response to a recession from any central bank is to lower interest rates.  This is not with the intent to start a currency war; it occurs to stimulate the local economy.  And while this move may lead to a lower currency value, that is also an intended result of lowering rates, as a lower currency value makes the home country's goods more competitive on the world stage. 

But more importantly, the US was not the only country to lower interest rates after the Great  Recession: in fact, interest rates from all around the world are at record low levels.

For example, the ECB has interest rates at .75%.  And yet, we see the following chart for the euro:


Yes, the euro was declining from mid-2011 to mid-2012.  However, it was during this time that the entire trading world though the EU was going to implode.  Talk of a "Grexit" were rampant.  Editorial writers fell over themselves trying to predict the EUs imminent collapse.  In other words, the macro-economic and political background against which traders make their bets was uniformly bearish.

But, starting at the end of last summer when the ECB chief said he would do whatever it takes to save the EU union, the euro has been rallying despite it still has a 75 basis point discount rate.  The reason for the rally is a general impression that the economic and political environment is healing.

And then there is Japan, who's interest rate has been at record lows since the Clinton While House.  Yet, the month chart of the yen for the last five years looks like this:


We see an overall rally that lasts nearly five years.  It was only after the new government started to talk about deliberately devaluing the yen, accepting a higher inflation target and passive a stimulus bill that traders started to sell the yen.

And then there is the dollar:


Despite having record low rates since the end of the Great Recession, the dollar rallied from mid-2011 to mid-2012.  And while the dollar has dropped since then, it's not at a record low as one would think in the current rate environment.

And then there's the British Pound.  Although the Bank of England has kept rates at low levels since the beginning of the expansion, the Pound has been trading in a range for two years:


In times of economic hardship, central banks lower interest rates -- that's central banking 101.  If they didn't lower rates because of a fear of starting a currency war, there would be an uproar from traders and economists about their non-movement.  In short, the idea that there is a global currency war going on just doesn't play out in the charts.


Morning Market Analysis


Of the four major averages, only one (the QQQs) are not in the middle of a rally.  All have strong EMA positions and all are above their respective 200 day EMA.  There are a few warning signs to consider, however.  First, notice the large valume spike on the transports (bottom chart).  That could be interpreted as a buying frenzy.  In addition, all the MACDs are weakening.  The IWMs and IYTs (bottom two charts) have flashed sell signals while the SPYs (top chart) is weakening.

However, these negative  developments could just as likely be interpreted as the beginning of a consolidation rather than a sell off.


At the same time, we're finally seeing the treasury market begin to sell off.  The longer end (bottom two charts) are clearly in a downward trend with prices below the 200 day EMA and the shorter EMAs crossing below the 200 day EMA.  Also note that prices have moved through support established in early September.  The 7-10 year section of the market (second from top), is right at support with a weakening technical position. 

The next few weeks will be critical to seeing of the treasury market is finally going to meaningfully sell-off, thereby providing much needed funds for the equity markets.


Saturday, February 2, 2013

Weekly Indicators: austerity bites edition


- by New Deal democrat

In the rear view mirror, 2012 4th quarter GDP unexpectedly declined -0.1%, due mainly to the largest cutback in military spending in 40 years, plus inventory reductions. November Case-Shiller house prices increased. December monthly data included a big increase in durable goods spending and personal income, and an increase in construction spending and personal spending. January auto sales were virtually unchanged from November and December. Both the Chicago and PMI January manufacturing indexes surprised to the upside. One measure of consumer confidence rose and the other declined in January.

This week appears to give the first indication that tax increases may be affecting the economy. So Let's start this look at the high frequency weekly indicators by checking what is happening with tax withholding:

Employment metrics
Daily Treasury Statement tax withholding
  •  $127.6 B (adjusted -13.1% for 2013 payroll tax withholding changes) vs. $149.0 B, -14.4% YoY last 20 days

  •  $149.5 B (adjusted -13.1% for 2013 payroll tax withholding changes) vs. $158.7 B, -5.8% YoY for all of January
Initial jobless claims
  •   368,000 up 38,000

  •   4 week average 352,000 up 250
American Staffing Association Index
  • unchanged at 89 w/w up 3.5% YoY
Employment metrics were poor this week. Initial claims increased back into their 2012 range this week. In the second half of 2012 the ASA index's performance compared with 2011 declined significantly, although the absolute index was higher. This week, however, the Index declined slightly compared with 2007 and remains below 2008. Tax withholding was the worst since the last recessioin after being particularly weak for two weeks in a row. Since the 1st of each month tends to be a very big day for payment of these taxes, the 20 day average is something of an aberaation this week. But the monthly January reading is not so affected. Thus the YoY decline is a real concern. Please note I am adjusting my YoY figures to reflect the increase in personal withholding taxes, and it is possible that the adjustment is off.

Consumer spending
  • ICSC -1.0% w/w +2.0% YoY

  • Johnson Redbook +1.6% YoY

  • Gallup daily consumer spending 14 day average $76 up $12 YoY
Gallup remains significantly positive. The ICSC varied between +1.5% and +4.5% YoY in 2012. This week was close to the bottom end of that range. Johnson Redbook is also in the lower part of its YoY growth range from 2012.

Housing metrics

Housing prices
  • YoY this week. +2.6%
Housing prices bottomed at the end of November 2011 on Housing Tracker, and have averaged an increase of +2.0% to +2.5% YoY for the last year.

Real estate loans, from the FRB H8 report:
  • 0.0% w.w

  •  +2.0% YoY

  • +2.6% from its bottom
Loans turned up at the end of 2011 and averaged about 1% gains YoY through most of 2012, and have recently shown somewhat more YoY strength. This week remained near the top of its recent range.

Mortgage applications
  • -2% w/w purchase applications

  • +2% YoY purchase applications

  • -10% w/w refinance applications
Purchase applications have been going sideways for 2 years. This week's reading remained close to the top of that range. Refinancing applications were very high for most of last year with record low mortgage rates, are responding to an increase in rates.

Interest rates and credit spreads
  • +0.03% to 4.72% BAA corporate bonds

  • +0.03% to 1.90% 10 year treasury bonds

  • 0.0% change at 2.82% credit spread between corporates and treasuries
Interest rates for corporate bonds have been falling since being just above 6% two years ago in January 2011, hitting a low of 4.46% in November 2012. Treasuries have fallen from about 2% in late 2011 to a low of 1.47% in July 2012. Spreads have varied between a high over 3.4% in June 2011 to a low under 2.75% in October 2012. This weak was slightly negative, although the YoY changes remain very positive.

Money supply

M1
  • +0.6% w/w

  • +0.9% m/m

  • +10.3% YoY Real M1

M2
  • -0.5% w/w

  • +0.2% m/m

  • +5.7% YoY Real M2
Real M1 made a YoY high of about 20% in January 2012 and has generally been easing off since. This week's YoY reading remained above a new low set several weeks ago. Real M2 also made a YoY high of about 10.5% in January 2012. Its subsequent low was 4.5% in August 2012. It weakened this week. Both are still quite positive in absolute terms.

Oil prices and usage
  •  Oil $97.77 up $1.89 w/w

  •   gas $3.34 up $.04 w/w

  • Usage 4 week average YoY +3.0%
Gas prices are increasing seasonally. Unusually for the last year plus, the 4 week average for the second week in a row was positive YoY.

Transport

Railroad transport
  •  -18,000 or -6.3% carloads YoY

  • -100 or virtually unchanged carloads ex-coal

  • +3,800 or +1.6% intermodal units

  • -14,200 or -2.7% YoY total loads

  • 10 of 20 types of carloads up YoY, an increase of 1 from last week
Shipping transport
  • Harpex unchanged at 359

  • Baltic Dry Index down 40 to 758
Rail transport has been whipsawing between very positive and very negative readings over the last 2 months. This may well be the aftermath of the dock strikes. That traffic is off YoY even ex-coal, however, is cause for concern. The Harpex index is still near its 3 year low of 352, and the Baltic Dry Index is declining towards its 52 week low from last February.

Bank lending rates
  • 0.240 TED spread down +0.010 w/w

  • 0.2006 LIBOR down -0.0031 w/w
The TED spread is near its 52 week low. LIBOR is again at a new 52 week low and is close to a 3 year low.

JoC ECRI Commodity prices
  • up 0.36 to 129.89 w/w

  • +4.40% YoY
The most important issue at the moment is whether the 2% increase in withholding tax rates is having an effect on consumers. We can add to that the issues of the impending austerity of the budget sequestration, and the potential consequences of moving income and spending forward into 2012 from 2013 due to tax increases. This week we got strong evidence for the first time that there is indeed an effect.

Tax withholdings were the weakest in a long time. Rail was weak. Initial jobless claims spiked. Shipping rates are low, although much of that is likely seasonal. Gas prices are rising seasonally. Consumer spending as measured by same store sales are now at or near the weak end of their 2012 YoY comparisons. Consumer confidence is declining precipitously, at least as measured by one survey, although the other shows an improvement.

Continuing positives include the housing market, money supply (although more weakly positive than in the last year or two), bank lending rates, and commodity prices. Gallup consumer spending is still strong. Manufacturing conditions surprisingly improved in January.

If austerity measures emanating from Washington are enough to tip the economy into contraction, the evidence should accumulate in the next few weeks.

Have a nice weekend.

Is the US Economy Moving Into A Higher Growth Phase? Part I; the Positive

I wrote a four part series last week discussing the possibility of a new bull market opening up.  While the technical side of the markets favored the bulls, I was deeply concerned that the overall economic environment was too negative to support a strong move higher.  Here was my conclusion:

To sum up the national and international position, I just don't see strong enough overall growth in any economy to warrant a strong long position right now.  The best reading of the data is that we'll see a stronger second half, with the US housing market providing sufficient domestic stimulus combined with a more settled fiscal situation.  This would also allow the EU to continue strengthening or bottoming. The stronger second half argument leads could lead into the fact that the market is a leading indicator of anticipated future activity -- a fair point as far as it goes, but I just don't see the overall underlying strength to support the rally long term.

Then came Friday's move higher, which led me to question my analysis yet again.  Over the weekend, I realized that my conclusion was based on a macro reading of other world economies, and not the fact that the US being the largest world economy could achieve a level of growth sufficient to propel it beyond the 2% GDP growth rate we've seen for the last few years.  In addition, for the last few years I've been wedded to an analysis that calls for US growth between 0%-2% (an analysis that has been mostly correct).  

So, as a thought exercise, let's look at a few data points that support the idea the US is about to move into a period of higher growth.

Housing

If any sector can help to move the economy into a higher gear, it's housing, largely because it provides a tremendous multiplier.  When a house is built, it requires a large amount of raw materials converted into useful items (wood, copper, etc..).  There is also a decent amount of labor involved.  Finally, there is a large amount of durable goods that go into a house (furniture and appliances).  All of these factors add up to a decent multiplier for the macro economy as a whole.

For me, the real story of housing is the low inventory levels we're seeing at the macro level, as shown in the following two charts.


The top chart of new homes inventory shows levels at some of their lowest levels in 40 years, while the lower chart if existing homes shows that levels are now at far more normal levels.  These inventory levels have led to price increases, as shown in the year over year percentage change in the Case Shiller index:


Finally, the low levels of inventory have led to a big increase in new home construction, as shown in the housing starts figures:


Although they are coming off a low level, housing starts have clearly picked up and are rising at a strong clip.

In short, housing still remains a big reason why the US economy may kick into a higher growth rate.

Auto Sales

Sales of cars and light trucks have been in a strong uptrend since the bottom of the recession.


The top chart shows the figures for the last five years.  While we do have some dips in the figure, the overall upward trend is clear.  The longer chart (lower chart) puts the action in overall historical context.  The drop in activity during the Great Recession was the sharpest we've seen since 1980.  But now overall figures are at levels seen with the mid-1990s expansion.

The reason for the importance of auto sales is, like housing, they have a decent multiplier effect on the economy.  There are still a fair number of employees in this industry -- especially in the industrial Midwest -- the the process of making a car still requires a large amount of ancillary activity.

Manufacturing

The strongest evidence of a manufacturing resurgence is found in the latest ISM report, issued last week.  


The report was issued today by Bradley J. Holcomb, CPSM, CPSD, chair of the Institute for Supply Management™ Manufacturing Business Survey Committee. "The PMI™ registered 53.1 percent, an increase of 2.9 percentage points from December's seasonally adjusted reading of 50.2 percent, indicating expansion in manufacturing for the second consecutive month. The New Orders Index registered 53.3 percent, an increase of 3.6 percent over December's seasonally adjusted reading of 49.7 percent, indicating growth in new orders. Manufacturing is starting out the year on a positive note, with all five of the PMI™'s component indexes — new orders, production, employment, supplier deliveries and inventories — registering above 50 percent in January."

Of the 18 manufacturing industries, 13 are reporting growth in January in the following order: Plastics & Rubber Products; Textile Mills; Furniture & Related Products; Printing & Related Support Activities; Apparel, Leather & Allied Products; Electrical Equipment, Appliances & Components; Miscellaneous Manufacturing; Fabricated Metal Products; Transportation Equipment; Petroleum & Coal Products; Machinery; Primary Metals; and Food, Beverage & Tobacco Products. The four industries reporting contraction in January are: Nonmetallic Mineral Products; Computer & Electronic Products; Wood Products; and Chemical Products.


Simply put, the report above is very bullish.  It shows a broad path of growth over a variety of internal ISM figures (overall index, new orders, employment, supplier deliveries and inventories) along with a majority of industries growing.

The US report is confirmed by the latest Markit report:

The final Markit U.S. Manufacturing Purchasing Managers’ Index™ (PMI™)1 signalled a strong expansion of the U.S. manufacturing sector at the start of 2013. Moreover, at 55.8, below the earlier flash estimate of 56.1 but higher than that recorded in December (54.0), the PMI signalled the fastest rate of growth in nine months.

Here is a chart of Markit's overall figures:

 When looking for the reasons of the manufacturing increase, consider these points from the latest ISM report:
  • "Fiscal cliff, uncertainty in general and EU economic weakness are factors causing our customers to be very tentative with commitments for product purchases in 2013." (Machinery)
  • "Midwest drought impact will be felt at least through midyear, impacting protein, sweeteners, eggs, oils, emulsifiers, etc." (Food, Beverage & Tobacco Products)
  • "Slowing interest in high-dollar purchases reflects continuing economic uncertainty." (Miscellaneous Manufacturing)
  • "Expenditure and investment are expected to remain high in North America in Q1 and Q2, 2013." (Petroleum & Coal Products)
  • "Housing sales are trending upward in light of overall market uncertainty, translating to improving optimism in appliance market." (Electrical Equipment, Appliances & Components)
  • "Still waiting for reaction to consumer tax increases." (Fabricated Metal Products)
  • "Government spending is very low, probably due to the fiscal cliff and the looming debt ceiling." (Transportation Equipment)
  • "Business is improving." (Furniture & Related Products)
  • "The general theme developing in our industry is that we can move suitable volumes. However, profit margin is elusive." (Wood Products)
  • "Overall production volume decreasing. Decrease is led by decline in exports of 10 percent." (Chemical Products)
The good news in the report is from the housing market.  We see a statement to that effect along with business improvement in furniture and related products and increased orders in wood products.

All three of the above sectors -- housing, autos and manufacturing -- are bedrock components of the economy.  If all three are doing fairly well, the worst that can happen is slow growth.  There is simply too much of a multiplier effect of the combined total for a recession to occur with the above three expanding.

However, this is before we get to the latest and upcoming fiscal follies from the idiots in Washington.  We'll touch on that tomorrow.


Friday, February 1, 2013

Weekend Weimar, Beagle and Pit Bull; In Memorial

As regular readers of this blog know, I usually put up pictures of our dogs on Friday afternoon.  Unfortunately, we lost one of our pups this week,  Scooby Doo.  Words don't come close to expressing how important animals are to me and Mrs. Bondad, so I won't even try.  Instead, I'll just leave you with these pictures or our girl.  She will be missed.


A quick note about the ISM manufacturing report


. - by New Deal democrat

As you can probably tell from my recent posts, I am in a quandary as to whether the increase in payroll taxes plus other government austerity measures are enough to put this country into an actual recession. If anything, my outlook is getting gloomier.

The shame is that, left to itself, it looks like the economy wants to keep growing. Today's ISM manufacturing report of 53.4 is very potent evidence of that. The index has been reported since 1948. Since that time, only once - for the first six months or so of the 1973-74 recession - has the index ever recorded a reading above 53 during a recession.

Interestingly, or ominously, that recession occurred when a strongly growing US economy ran into the brick wall of the Arab oil embargo. So if a recession is starting, you can blame it squarely on ridiculous contractionary austerity coming from Washington, DC.

Europe Still A Mess

Consider these two charts of European Consumer Confidence (top chart) and Business Climate (bottom chart).


These are bearish reports.

Also note that most county's respective PMIs are below 50:


The Financial Times is reporting that EU residents and business leaders are looking at the top chart and saying the "worst is behind us."  From the story:


The European Commission’s “economic sentiment indicator” rose from 87.8 in December to 89.2 as managers predicted that the service and construction sectors would pick up across the 17 countries in the currency bloc. The strongest improvement in sentiment was registered in Germany, the Netherlands and Spain. 
“The third successive, and appreciable, rise in eurozone economic sentiment to be at a seven-month high in January adds to the evidence that eurozone economic activity bottomed out around last October and growth prospects are brightening,” said Howard Archer, economist at IHS Global Insight. 

However, a look at the charts accompanying the report show that various sectors are still printing negative readings (see links above).