Thursday, September 30, 2010

A Closer Look at Gold


From the US Geological Survey:

Gold has been treasured since ancient times for its beauty and permanence. Most of the gold that is fabricated today goes into the manufacture of jewelry. However, because of its superior electrical conductivity and resistance to corrosion and other desirable combinations of physical and chemical properties, gold also emerged in the late 20th century as an essential industrial metal. Gold performs critical functions in computers, communications equipment, spacecraft, jet aircraft engines, and a host of other products. Although gold is important to industry and the arts, it also retains a unique status among all commodities as a long-term store of value. Until recent times, it was considered essentially a monetary metal, and most of the bullion produced each year went into the vaults of government treasuries or central banks.


According to the World Gold Council, here are the demand statistics for gold:


  • Total gold demand in Q2 2010 rose by 36% to 1,050 tonnes, largely reflecting strong gold investment demand compared to the second quarter of 2009. In US$ value terms, demand increased 77% to $40.4 billion.
  • Investment demand was the strongest performing segment during the second quarter, posting a rise of 118% to 534.4 tonnes compared with 245.4 tonnes in Q2 2009.
    The largest contribution to this rise came from the ETF segment of investment demand, which grew by 414% to 291.3 tonnes, the second highest quarter on record.
  • Physical gold bar demand, which largely covers the non-western markets, rose 29% from Q2 2009 to 96.3 tonnes.
  • Global jewellery demand remained robust in Q2 2010. In the face of surging price levels, consumption totalled 408.7 tonnes during the second quarter of 2010, just 5% below year-earlier levels.
  • Gold jewellery demand in India, the largest jewellery market, was little changed from year-earlier levels, down just 2% at 123.0 tonnes. In local currency terms, this translates to a 20% increase in the value of demand to Rp216 billion.
  • China saw demand for gold jewellery increase by 5% to 75.4 tonnes . While growth in demand in tonnage terms was hindered by extreme weather conditions, the growth in the local currency value measure of demand was 35% to RMB 19.8 billion.
  • With the return of demand for consumer electronics, industrial demand grew by 14% to 107.2 tonnes, compared to Q2 2009.

Let's take a look at some of the basics, also from the World Gold Council:


Mine production is the largest source of gold and jewelry is the largest area contributor to demand.


Notice that gold -- unlike copper -- is found in many parts of the world.


Also note that the use of scrap gold as a source of supply has been increasing.


Also note that world output has been increasing for over a century.

Investment demand is the primary reason for the increase in gold demand over the past few years.


And finally is a chart of total world gold holdigns.

Let's take a look at the charts:


The long-term chart is a massive rally. Notice there are three uptrend support lines (A, B and C) and there have also been counter-rallies that consolidated gains (D).

On the weekly chart, there is also a strong uptrend (A) that has solid, counter-trend consolidation patterns (B).


In the last 6 months we have a standard advance (A), consolidation (B) and advance (C). Notice the EMA are very bullish and the MACD indicates there is plenty of momentum (E).

Yesterday's Market


In general, prices have been in a very tight range for the last few days.


Yesterday, prices gapped a bit lower at the open (a), fell to previous support (c) and then rallied a bit, only to fall again (d). After a brief move higher, prices formed a double top before selling off into the close (f) on higher volume (g).


Note the tight range of the last few days is also apparent on the daily chart (a).


The Russell 2000 is just below support, trying to get above key resistance -- as is


The Dow and


The Transports.

Right now, equity prices just can't get over the hump. While the NASDAQ has moved through resistance, it is not pulling the other averages through.

Cotton continues in its uptrend (A). Notice that prices have consolidated in downward sloping pennant patterns throughout the rally (B). Prices have recently peaked (C) and are moving a bit lower to consolidate gains. Notice the EMA picture is very bullish (D) and the MACD is also pointing to further gains (E).


After forming a strong base (A) lumber prices have broken through resistance (B) and are currently at important support levels (C).

Wednesday, September 29, 2010

The Great Currency War

From the FT:

An “international currency war” has broken out, according to Guido Mantega, Brazil’s finance minister, as governments around the globe compete to lower their exchange rates to boost competitiveness.

Mr Mantega’s comments in São Paulo on Monday follow a series of recent interventions by central banks, in Japan, South Korea and Taiwan in an effort to make their currencies cheaper. China, an export powerhouse, has continued to suppress the value of the renminbi, in spite of pressure from the US to allow it to rise, while officials from countries ranging from Singapore to Colombia have issued warnings over the strength of their currencies.

“We’re in the midst of an international currency war, a general weakening of currency. This threatens us because it takes away our competitiveness,” Mr Mantega said. By publicly asserting the existence of a “currency war”, Mr Mantega has admitted what many policymakers have been saying in private: a rising number of countries see a weaker exchange rate as a way to lift their economies.

A weaker exchange rate makes a country’s exports cheaper, potentially boosting a key source of growth for economies battling to find growth as they emerge from the global downturn.

The proliferation of countries trying to manage their exchange rates down is also making it difficult to co-ordinate the issue in global economic forums.


A Closer Look at Corn

From the USDA:

The major feed grains are corn, sorghum, barley, and oats. Corn is the primary feed grain in the United States, accounting for more than 90 percent of total feed grain production and use.

.....

Corn acreage in the United States has increased from a government-mandated low of 60.2 million planted acres in 1983 due to provisions in the Federal Agriculture Improvement and Reform Act of 1996. The Act permitted farmers to make their own crop planting decisions based on the most profitable crop for a given year. While the number of feed grain farms (those that produce corn, sorghum, barley, and/or oats) in the United States has declined in recent years, the acreage per corn farm has risen. Moreover, the number of large corn farms (those with more than 500 acres) has increased over time, while the number of small corn farms (those with less than 500 acres) has fallen.

.....

Corn production has risen over time, as higher yields followed improvements in technology (seed varieties, fertilizers, pesticides, and machinery) and in production practices (reduced tillage, irrigation, crop rotations, and pest management systems).

.....

Strong demand for ethanol production has resulted in higher corn prices and has provided incentives to increase corn acreage. In many cases, farmers have increased corn acreage by adjusting crop rotations between corn and soybeans, which has caused soybean plantings to decrease. Other sources of land for increased corn plantings include cropland used as pasture, reduced fallow, acreage returning to production from expiring Conservation Reserve Program contracts, and shifts from other crops, such as cotton.


In other words, corn is a raw material that is processed in various ways into other goods which are then sold in some form.

Let's take a look at some data:


Corn is obviously the dominant component in feed grains.


Notice the continued increased in yield, indicating farming is becoming much more efficient.


Also note that demand and supply continue to increase.


Ethanol use is clearly one of the primary drivers for increased corn use over the last few years.

Corn is very important to agricultural exports:

The United States is the world's largest producer and exporter of corn. Corn grain exports represent a significant source of demand for U.S. producers and make the largest net contribution to the U.S. agricultural trade balance of all the agricultural commodities, indicating the importance of corn exports to the U.S. economy. On average, corn grain (excluding popcorn or sweet corn) accounted for approximately 11 percent of all U.S. agricultural exports by value during the 1990s. In 2008, due to record exports of corn and other feed grains, that share grew to over 12 percent of the U.S agricultural export value.

Here are the relevant charts regarding exports and imports:


The US is obviously the largest corn exporter by far


Notice the developing countries have continually increased their corn imports for the last 20 years. The Middle East is also a strong source of growing demand.


Let's take a look at the charts:


For the first part of the decade, corn prices were fairly subdued with the exception of an early 2004 price spike (A). Like all commodities, corn rallied in a big way in 2008, but fell with the recession (B). It consolidated in a triangle pattern (C), but has since rallied (D) in concert with wheat.


The weekly chart shows the 2008 spike (A) along with the triangle price consolidation (B) and the recent rally (C).


Prices have been in a strong uptrend since the beginning of June with two uptrends (A and B) ini place. Prices have consolidated gains during the rally in a standard downward sloping pennant pattern (C). Prices have recently topped (D) and printed three strong downward sloping bars this week. The EMA picture is still bullish (E), but the MACD has given a sell-signal (F).

Money Supply: We're DOO ... oh, wait ...

- by New Deal democrat

A few months ago it was fashionable, pace Zero Hedge, to note the discontinued M3 money supply series, which was "crashing" in YoY terms. We were told that this big a collapse hadn't been seen since the 1930s. (Of course, we might counter with the fact that it's a good thing that less credit has been created compared with the fog-the-mirror loans of the recent past, but why get in the way of a good story?).


A current proxy for M3, we were told, and I agree, is MZM (total money supply from all sources). Now, one slight problem is that M3 (and MZM as well) tend to peak towards the end of or even after recessions, and bottom well into the ensuing expansion:


In fact, the Fed discontinued M3 because it did not believe it carried much utility, as real M1 and real M2 have a much better record forecasting economic activity in the near future, and M3's essential components are captured by MZM above. In fact, there has never been a recession, including the Great Depression, where real M1 wasn't negative YoY, and real M2 wasn't less than +2.5% YoY. That's why, as you know, I track both real M1 and real M2 weekly. Here's a graph of those two series going back 50 years (in the below graph, I subtract 2.5% from M2 so that the "danger line" for both is zero):


Hence my weekly report that M2 is in the danger zone but improving, and M1 is not and has not been in the danger zone all year.

So what is happening now? Sure enough, M3 looks like it may have bottomed on a YoY percentage basis:


And MZM? It is now positive again YoY:


I'm sure Zero Hedge has highlighted this fact, right?

P.S. This is a good example of what Barry Ritholtz called "intellectual jihadism" last week.

Yesterday's Market


The treasury market has been in a decent rally the last two days, largely as the result of successful auctions:

The Treasury Department sold $35 billion in 5-year notes at a yield of 1.26%, the lowest on record at an auction. It was also smaller yield than traders had anticipated, one indication of strong demand.

The amount sold was the smallest since May 2009, which also helps demand metrics look more positive.

Bidders offered to buy 2.96 times the amount of debt being sold, compared to an average of 2.8 times at the last four monthly sales of the securities.

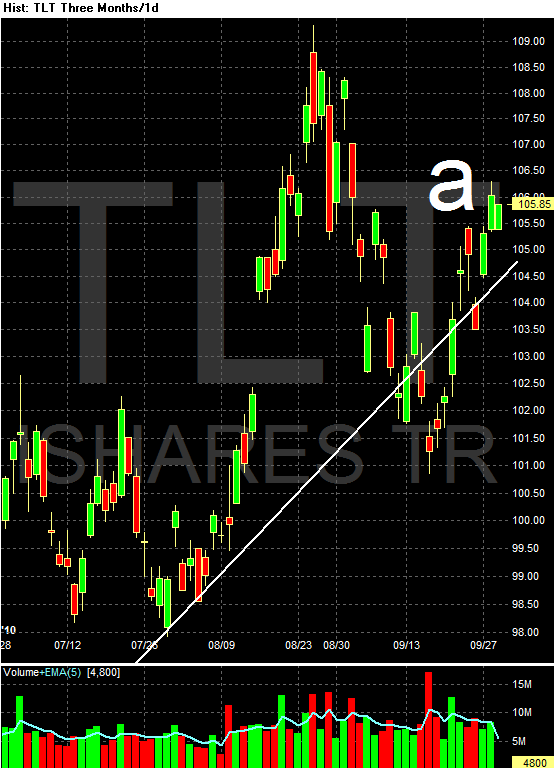
In addition, consider these charts of the daily price action of the IEFs and TLTs:


The IEFs are still right below the long-term trend line. Remember that on the other side of bonds is yield which should act as a natural brake on prices. But -- we're not seeing that.


In addition, notice the long end of the curve is above the long-term trend line.


On the daily chart, prices are still above key resistance (a), buy have broken the uptrend (b).


For the last few days, prices have mostly been in a very tight range.


Prices opened by moving lower yesterday (a) on higher volume. Prices consolidated once (b) about half-way down before hitting their low for the morning (c). The MACD signaled a reverse (which the 3/10 MACD also revealed a bit sooner). Prices rallied to previously established lows (f), consolidated gains (g) and then had a small rally (h), which was pretty quickly reversed (h). The sell-off reversed into the close and prices rallied on increasing volume into the close.


The dollar has formed a head and shoulders formation for the first part of this year. It caught a safety bid during the euro crisis (the head) but has since moved lower. With the Fed keeping interest rates low for the foreseeable future, expect this trend to continue. Remember that with a decreasing dollar comes higher commodity prices.


Negative Housing Equity and States

Did you know that California,Florida,Ohio,Michigan,Georgia,Arizona and Nevada make up 31%
of the populace of the United States BUT they constitute 62% of the mortgages that have negative equity,,,,,,

http://www.corelogic.com/About-Us/ResearchTrends/Negative-Equity-Report.aspx


or another way of looking at it.... California and Florida are 18% of the populace and have 40%
of the mortgages that are underwater.....

Tuesday, September 28, 2010

What's Keeping Oil Prices Low?


Click for a larger image

The above image shows weekly crude stock going back about 30 years. Notice that current crude oil stocks are at levels not seen in over 10 years. Excess supply = lower price.

A Closer Look At Copper


I'm going to continue my look at basic commodities with copper because it's a very important commodity:

Copper is usually found in nature in association with sulfur. Pure copper metal is generally produced from a multistage process, beginning with the mining and concentrating of low-grade ores containing copper sulfide minerals, and followed by smelting and electrolytic refining to produce a pure copper cathode. An increasing share of copper is produced from acid leaching of oxidized ores. Copper is one of the oldest metals ever used and has been one of the important materials in the development of civilization. Because of its properties, singularly or in combination, of high ductility, malleability, and thermal and electrical conductivity, and its resistance to corrosion, copper has become a major industrial metal, ranking third after iron and aluminum in terms of quantities consumed. Electrical uses of copper, including power transmission and generation, building wiring, telecommunication, and electrical and electronic products, account for about three quarters of total copper use. Building construction is the single largest market, followed by electronics and electronic products, transportation, industrial machinery, and consumer and general products. Copper byproducts from manufacturing and obsolete copper products are readily recycled and contribute significantly to copper supply.


Copper is often called the commodity with a Ph. D in economics because as economic activity increases more copper is needed which increases copper's price. The reverse is also true. Let's take a look at some of the basics:


Copper usage has been increasing for the last 30 years.


Asia (China and Japan) are the primary reasons for the increase in demand.


Mine production has been increasing at a steady rate for the last half century.


The Americas (think Chile) are the largest copper producers.


Notice that South America (again, think Chile) have been increasing their capacity for the last 30 years.


Notice that six of the largest 10 mines are in South America.

Let's take a look at the charts:


In the early part of the decade prices were in a lower range (A). They started to rally in 2004-1006 (B) and then hit big at the end of the last expansion (C), forming an upward sloping wedge. Prices then fell as the recession hit (D) but have since rallied back to near pre-recession levels (E).


The weekly chart gives us more detail of the pre-recession peak (A), the sell-off (B) and subsequent rally (C).


Notice the current rally (B) has been punctuated by several downward sloping pennant patterns (B and C) which helped to consolidate gains. Also note the EMA situation is very bullish with the shorter above the the longer and all moving higher. Note the MACD is giving more of a neutral reading.