- by New Deal democrat
As with any “Breaking News!” event, about half of what you read will be wrong. The problem is, nobody knows which item falls in which half. Recognizing that you need to step back a little bit and “wait a week” to see how the more breathless commentary plays out can save a lot of aggravation.
In that vein, here are a few items I read with interest over the weekend, that are slightly contrarian to the large majority of main stream media stories. Remember, almost certainly one is wrong! But there’s a pretty good chance one is right as well.
Plus - afterward - a few noteworthy graphs, one of which, on the demographics of vaccination, I have been wanting to see for months!
To begin . . . Via Prof. Peter Hotez, here is Dr. Jorge Caballero on why you should take stories about Omicron already being detected more or less all over the world with many grains of salt:
“Let’s discuss what S-gene target failure (SGTF) is/isn’t, and why it’s being used to screen for #Omicron cases . . .”
“you’ve probably seen scary looking graphs that look something like these but if you look at the fine print, you’ll note that they’re not actually measuring the variant— they’re measuring S-gene target failure (SGTF) and assuming that they’re due to #Omicron
“Here’s the problem with that assumption: SGTF isn’t unique to #Omicron— the mutation that gives rise to SGTF has been found in 1 out of every 5 viral genomes sequenced (globally) since the start of the pandemic (1 in 7 U.S. genomes sequenced)”
He goes on to say that cases originally thought to be Omicron in Italy were actually Alpha that had this mutation.
In short, until you know that the tests conducted were specifically tailored to Omicron (which seems almost impossible at this moment), they may just be finding the above pre-existing Alpha variant.
Next, Dr. Scott Gottlieb who has been too sanguine at times, but also firmly rebutted claims that the vaccines were not (or were no longer) effective.
"There's a possibility when you look at the data--that they oversampled an initial early cluster," says @ScottGottliebMD on South Africa data of Omicron. "They’re presuming that is very new when in fact it might have been circulating for quite some time."
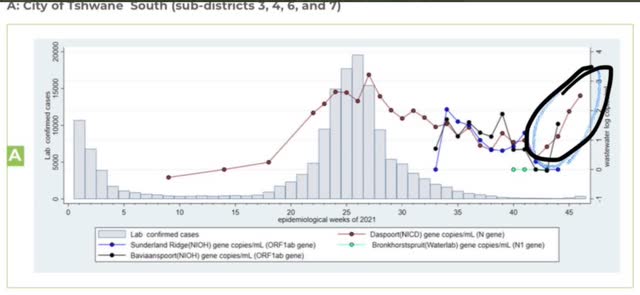
This is similar to what I’ve read in several other places, which is that it’s possible that the Omicron episode is a single superspreader event that is only responsible for a few hundred cases. Not sure about this, because in this morning I also saw the below graph of virus found in the Johannesburg, S.A. wastewater:
I don’t think a single superspreader even would create a metropolitan-wide spike equivalent to the worst of Delta.
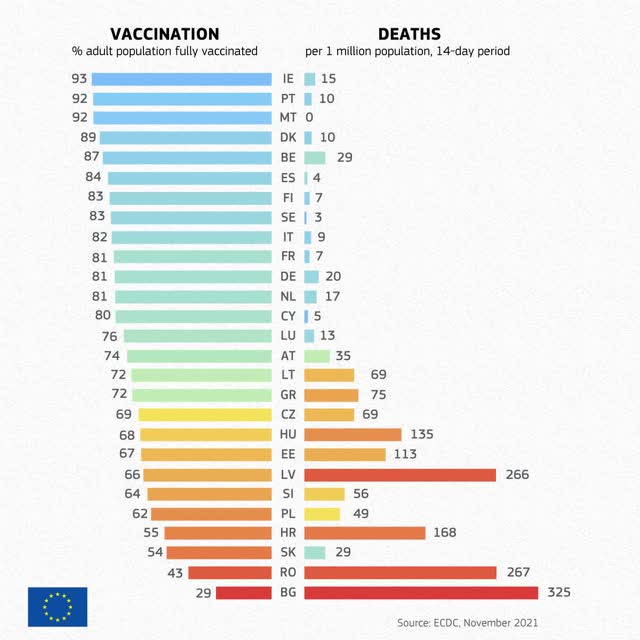
Next, last week I saw the below graph of the percentage of people in each of the EU countries who have been fully vaccinated vs. the death rate from COVID in each country:
It looks like there is an inflection point at roughly 75% fully vaccinated, at or above which the death rate becomes very low, on the order of 2 people per 100,000 per day on average.
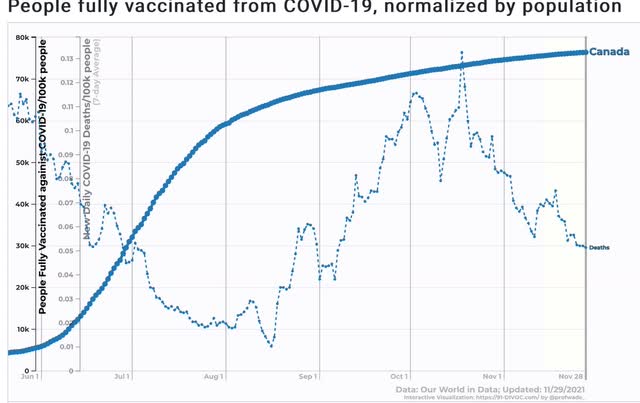
Canada is also a little past the 75% fully vaccinated mark. It’s death rate is 1 per 2,000,000:
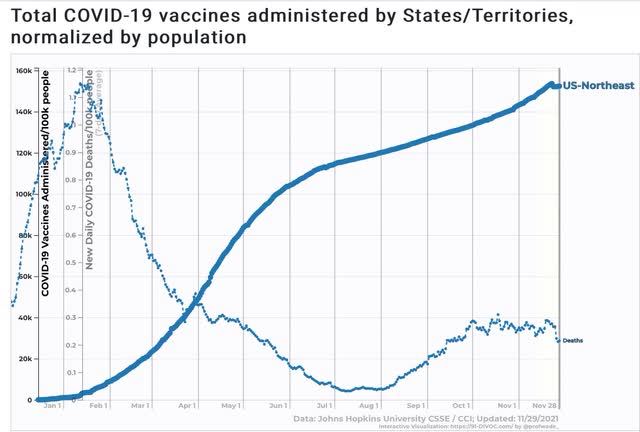
Most of New England is also very close to that 75% mark, and the rest of the Northeastern US Census region is not too far behind. Here’s what that region’s vaccination vs. death rates look like (1 death per roughly 400,000 per day):
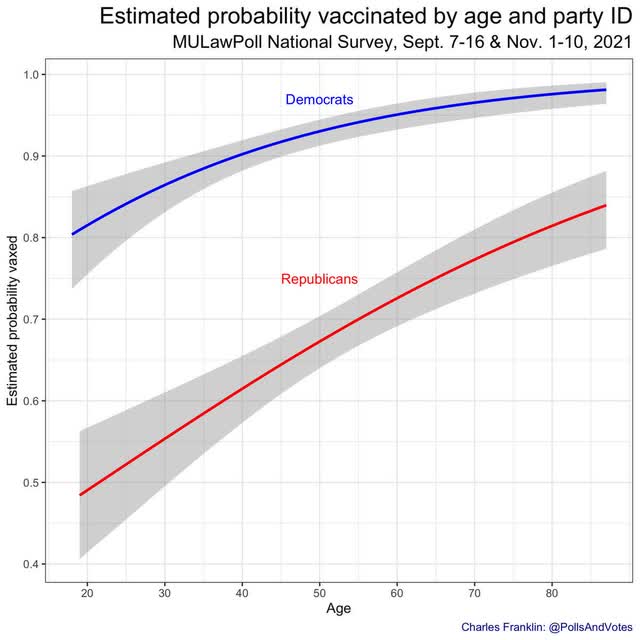
Finally, here is a graph that I have been wanting to see for months. Because whenever I look at my county or State data, what I mainly see is that over 80% of people older than 65 are fully vaccinated (despite the fact that many more than 20% of them are GOPers), and the least vaccinated are the Young Invulnerables (who skew much more heavily to the progressive side). So which factor is more important: political leaning or age? At last there is a graph that answers the question:
Political leaning is a much stronger indicator than age. The most vaccinated age group of GOPers is equivalent to the least vaccinated age group of Democrats.
Again, remember that half of what you read about Omicron now or for the next several weeks is going to be wrong or mistaken. But you won’t know that until later on. Accept that, wait a week before making any firm sort of conclusions, and continue with your personal safety protocols.