- by New Deal democrat
Five to ten years ago, I used to have a lot of fun taking the hide off DOOOMers. You know, the pundits who always find some new statistic or other that absolutely shows (for today only! Until the statistic goes the other way, in which case there’s radio silence) that the economy is DOOOMed!!!
Well, I am delighted to tell you (because I have a sadistic, warped sense of humor) that they’re ba-ack!
Via Mike Sherlock, here is today’s DOOOMer, Lance Roberts, formerly (iirc) of Time’s “Real Clear Markets”:

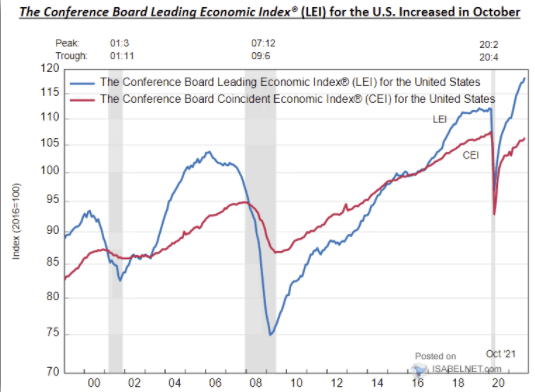
Now, the first thing to notice about those “large deviations” to the upside of the Leading Index is just how early they diverged in the last two expansions: by early 2004 in the 2001-07 expansion (i.e., nearly 4 years before the next recession began, and - as depicted in the graph - by the end of 2018 in the last expansion. And then you can see just the tail end of the 1990s expansion, where by 1998 - over two years before the next recession - there is already a big “deviation.”


“Large deviations of the #Leading #Economic index from the #Coincident index have been a good leading indicator of #recessions. Watch for the #LEI to begin to contract for a signal.”
And supplies the following graph from the Conference Board:

Now, the first thing to notice about those “large deviations” to the upside of the Leading Index is just how early they diverged in the last two expansions: by early 2004 in the 2001-07 expansion (i.e., nearly 4 years before the next recession began, and - as depicted in the graph - by the end of 2018 in the last expansion. And then you can see just the tail end of the 1990s expansion, where by 1998 - over two years before the next recession - there is already a big “deviation.”
So, you might want to know, how exactly did this alleged “good leading indicator” of the “large deviation” of the LEI work in longer expansions (like the 1990s)? Roberts doesn’t show you, so I noodled around and found the information courtesy of Edward Yardeni.
Unlike Roberts, Yardeni shows the same information over and over and over, each time it is updated. In other words, he doesn’t show bias in when he does or does not highlight any particular data series.
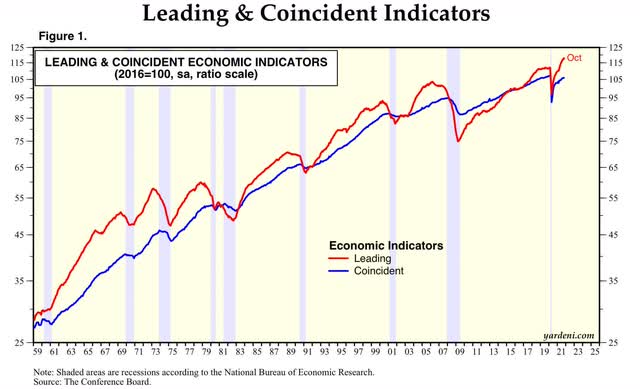
So here is what a 60+ year graph of what Roberts highlighted looks like:

Now we can see that the “large deviation” happened by 1994 in the 1990s expansion, and by 1984 in the 1980s expansion - in both cases, well before the midpoint of each expansion, and roughly 6 to 7 years before the next recession.
Oh.
And then cast your eye at the 1960s, in which even though the raw value of the LEI is less than the CEI, the Leading Index is clearly accelerating higher than the Coincident Index as early as 1962, 8 years before the next recession!
Oh dear, it looks like that “large deviation” is such a leading signal that it misses over half of most expansions!
And that isn’t the end of it, because the index levels (i.e., at what point is each index normed to 100) is more or less arbitrary. It’s the “large deviation” in the growth of the LEI vs. the CEI that is the alleged indicator.
So now look at the 2010s expansion again. The “large deviation” didn’t actually start only in 2019, it actually started by 2010! The only reason the LEI line overtakes the CEI line in 2019 is because of the arbitrary placement of the “100” index value.
In short, Roberts touts a “leading indicator” of the next recession that is a lot closer to a lagging indicator of the last one!
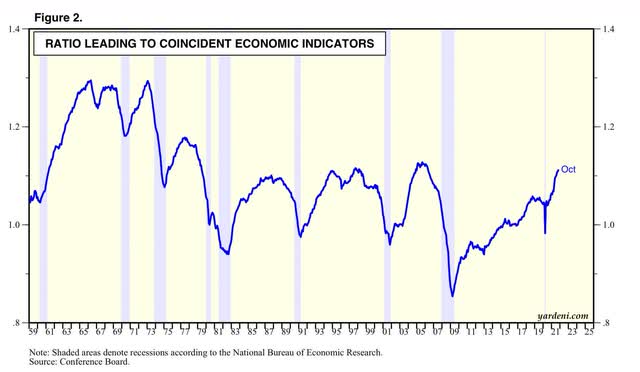
What *is* a legitimate indicator is when the ratio of the LEI vs. the CEI (i.e., both may be increasing, but the former is increasing less than the latter). The now-retired Doug Short used to follow this, and Ed Yardeni includes this as his very next graph:

A significant downturn in the ratio of the LEI to the CEI has more often than not indeed presaged a recession.
And it is not the situation at all at present.
This is the kind of analysis that would cause the late Jeff Miller to credit me with the even late-r “silver bullet” award. Ah, just like the good old days!