- by New Deal democrat
Here is the update through yesterday (April 24)
As usual, significant developments are in italics. Two days ago NY recorded almost no new infections, and yesterday it made up for that quirk. As a result, the total US recorded a daily new high in infections. Meanwhile testing has ramped up about 33% higher in the past few days compared with earlier in the month, and the ratio of total tests vs. positive results made a new high.
Here are yesterday’s numbers.
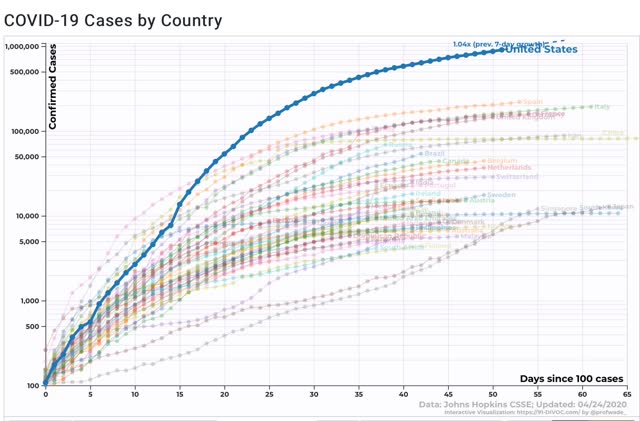
Number and rate of increase of Reported Infections (from Johns Hopkins via arcgis.com)
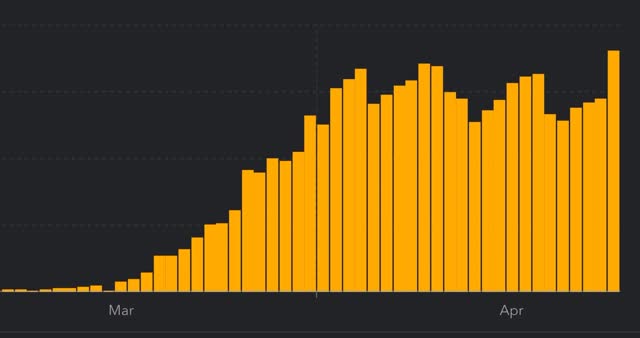
- Number: up +36,161 to 905,333 (new daily high)
- NY: 8,130 vs. 168 day/day; 3 day rolling average 4,410 vs. 10,569 at peak, or -58.3%
- US ex-NY: 3 day rolling average 31,156 vs. 33,437 at NY peak, or -6.8%
- ***US Rate of increase: day/day: 4% (vs. 4% for the past week, and 3% on April 22)
The new daily high in new infections is entirely an artifact of a day/day quirk in reporting from NY. The trend seems to be a slight decrease in the number of new cases. This is almost entirely due to New York, which is on track to “crush the curve.”
Number of deaths and infections and rate of increase of testing (from COVID Tracking Project)
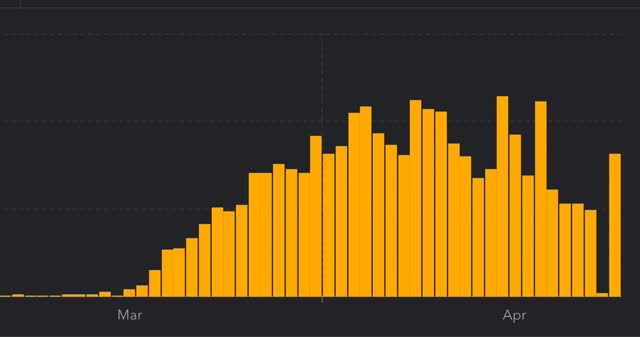
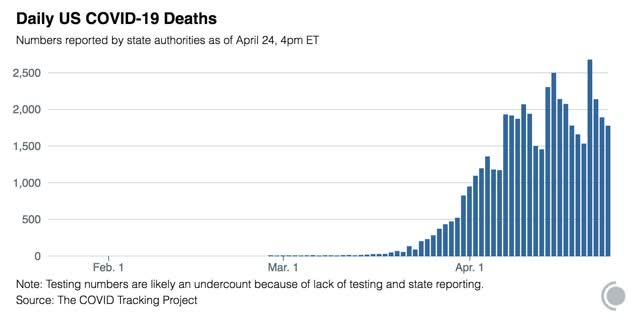
- ***Number of deaths: Total 45,786, increase of +1,772 day/day
- Rate: increase of 4% day/day vs. average of 5% in past week
- Number of tests: 223,552 (new daily peak*)
- Ratio of positive tests to total: 7.1:1 (new daily peak*)
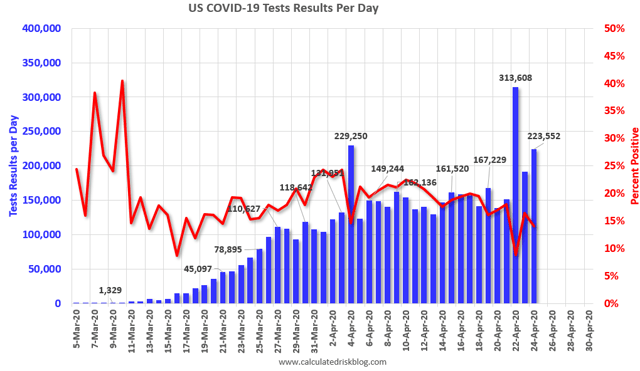
*ex.-Calif clearing its backlog
Summary for April 24
- The total US population remains under total lockdown has declined from about 95% to about 88% due to the three renegades in the Confederacy (which were also among the very last States to go to lockdowns a few weeks ago)
- The number of daily new infections made a new high yesterday, but that is entirely an artifact of NY recording only 168 cases the day before; NY increased about 8,000 day/day, while the US increased about 7,200 day/day. In other words, NY’s recording quirk accounted for the entire increase and then some. Average NY over two days and the overall US trend of a slight decline is intract.
- Deaths daily still appear to be increasing slightly.
- The trend number of daily tests has improved dramatically in the past few days from an average of about 150,000-160,000 to over 200,000. As a result we are picking up a higher number - but decreasing rate - of new infections.
- Nevertheless, we are continuing to miss a large percent of new infections. My personal suspicion remains that the actual number of total infections in the US is about 5x the official number, or roughly 4.5 million at present.
- New York and Hawaii are the only States that are “crushing the curve.” NY is the only State approaching a test regimen sufficient to begin opening its economy once a tracing regimen is put in place.
- In general, outside of New York, progress has stalled. There is no indication that testing, let alone tracing and isolation regimens, are ramping up in any meaningful sense anywhere else. This means that lockdowns will remain in place indefinitely.