- by New Deal democrat
No big changes today, and since a picture is worth 1000 words, let me let the graphs speak pretty much for themselves.
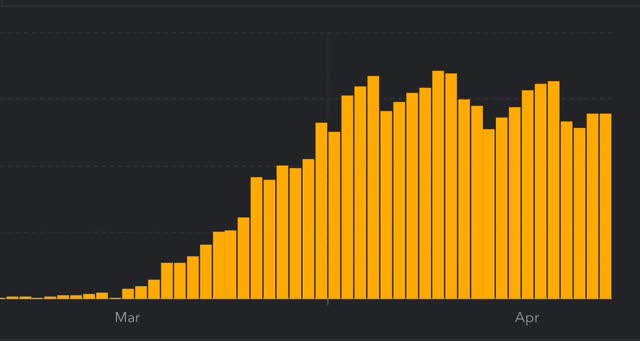
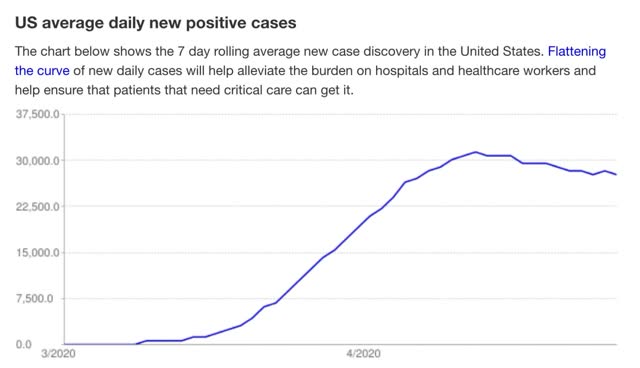
1. Daily infections for the US as a whole continue to look like they are trending slightly down (but more on that below):
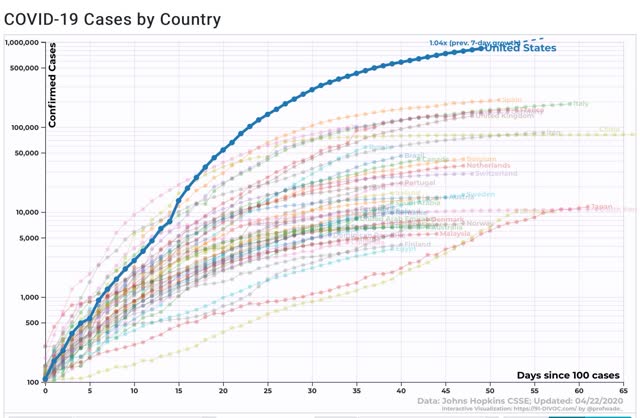
2. The 7 day rate of new infections remains stuck at +4%. There is very little evidence of this rate of increase slowing:
3. The trend in deaths has not peaked:

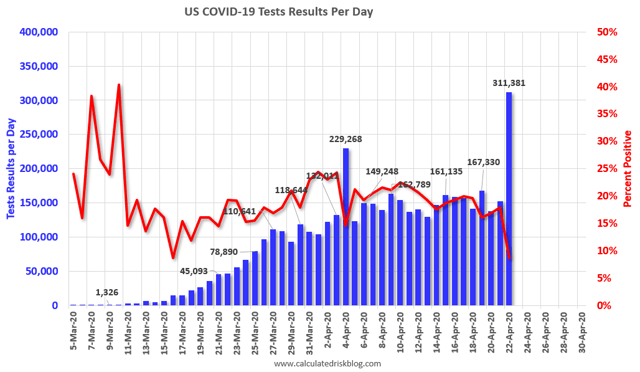
4. California cleared a big backlog in testing yesterday, which is why the number of tests spiked and the ratio of positive tests to total tests sharply declined:
5. BUT - when we look at the 7 day rolling average of new daily infections, New York State has steeply declined, by over 33%, from a peak of 9,651 on April 9 to 6,205 yesterday:
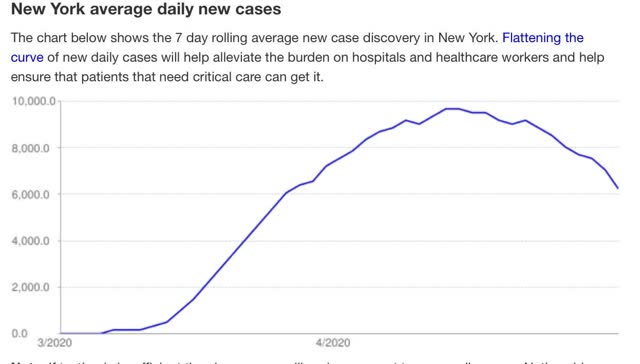
6. By contrast, during that same period the decline for the entire US has only been a little *under* 3,000 new infections daily, from 30,747 to 27,754:
(H/t Department of Numbers for graphs #5&6)
7. Which means that the 3,400+ decline in NY accounts for *more* than the entire decline in the US, I.e., ex-NY new infections have continued to *climb* slightly over the past 2 weeks. Not good at all, and certainly not a basis for any “opening up” of the economy.