First of all, let's date the recession. According to the NBER, the recession of the early 1990s lasted from 7/90 to 3/91 -- 9 months or three quarters (3Q90, 4Q90 and 1Q 91).

Above is a chart of the GDP for the three quarters of the recession and the give quarters after the recession. Notice that for the three quarters after the recession, GDP growth was positive but weak.

The recession started in 3Q90 when GDP printed 0% growth. However, notice that PCEs are still strong enough to offset the big negative contribution from gross private domestic investment.

By 4Q90, the negative impact of the drop in domestic investment had bled over into PCEs. This combination of weak consumer spending and weak gross domestic investment led to a contraction in GDP of 3.5% in 4Q90.

GDP contracted at a slower pace in the 1Q91, but the economy still had to contend with a massive cut in domestic investment.
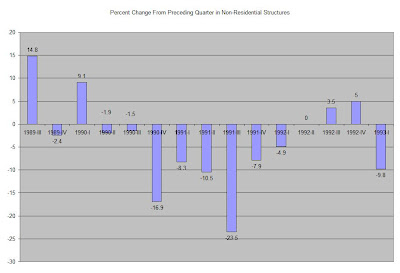
Here are two charts of the percentage change in investment:


Notice how both categories dropped hard during the three quarters of the recession (7/90 - 3/91).