Friday, March 1, 2024

Manufacturing and construction show softness to start the month


 - by New Deal democrat


As usual, the new month’s data starts out with information on manufacturing and construction.


The ISM manufacturing index has been a good leading indicator in that sector for 75 years. The difference over time, especially the last 20 years, is that manufacturing makes up a smaller share of the total US economy. As a result, even though it has almost consistently been in contraction ever since late 2022, to levels that before 2000 would always have meant recession, that didn’t happen in 2023.

In January, the total index rose to near its equipoise point of 50, and for the first time all year, the more leading new orders index surpassed that level. In February, the two retrenched, as the total index declined to 47.8, and the new orders index declined to 49.2:


Although this indicates softening, on the other hand neither of these is nearly as bad is their low levels last year. In terms of the economy as a whole, count this as a neutral.

After a string of reports indicating strong improvement, both total construction spending and the more leading residential construction spending declined -0.2% in January from their all time nominal highs:


This decline is amplified in real terms by the fact that producer prices for construction materials (red) rose a full 2.0% (note: graph normed to 100 as of December 2022 for better clarity):


This is the first negative construction spending report since last May.

In sum, both leading sectors showed softness in these reports, but not enough to suggest any significant change of trend to a downturn at this point.

Thursday, February 29, 2024

January personal income and spending: Goldilocks is knocking at the door


 - by New Deal democrat


Personal income and spending has become one of the two most important monthly reports I follow, because it nets out the impacts of higher interest rates and abating inflation due to the unlinking of the supply chain. Because real personal spending on services for the past 50 years has generally risen even during recessions, the more leading components of this report have to do with spending on goods. Additionally, there are several components that form part of the NBER’s “official” toolkit for determining when and whether a recession has begun.

Now, to the report for January . . . 

Nominally income rose a sharp 1.0% in January, the same increase as last January, suggesting that lots of people got big annual raises. Nominal spending rose 0.2%. Prices as measured by the PCE deflator increased 0.3% for the month, meaning that in real terms income rose 0.7% and spending declined -0.1%. Since just before the pandemic real incomes are up 7.0%, and spending is up 10.4% (NOTE: Data in all graphs below except for YoY comparisons, and the personal saving rate, is normed to 100 as of just before the pandemic):


On a YoY basis, the PCE price index is up 2.4%, the lowest since March 2021. For the past 16 months, the YoY measure has been declining at the rate of 0.25%/month, suggesting that it will hit the Fed’s 2.0% target in the next two months:


As I indicated above, for the past 50+ years, real spending on services has generally increased even during recessions. It is real spending on goods which declines. Last month real services spending rose 0.4%, while real goods spending declined -1.1%, reversing December’s revised 0.9% gain:


As per form, real services spending has risen consistently since the pandemic, while goods spending have been somewhat of a mirror image of gas prices, which peaked in June 2022.

Real durable goods spending tends to turn before non-durable goods spending. The former declined -2.1% for the month (vs. +1.5% in December), while the latter declined -0.5% (vs. +0.6% in December):


Durable goods spending had been very much affected over the past several years by the shortage of new vehicle inventory, which has largely abated as 2023 progressed.

Another important metric for the near future of the economy is the personal savings rate. In January it increased 0.1% to 3.8%:


On the positive side, the declining trend in this rate since last May indicates a lot of consumer confidence. But on the negative side it remains close to the all time low readings of 2005-07, indicating vulnerability to an adverse shock. One of my forecasting models uses such a shock as a recession warning indicator. In any event, there is no such shock indicated at the moment.

Also as indicated above, the NBER pays particular attention to several other aspects of this release. Real income excluding government transfers (like the 2020 and 2021 stimulus payments) continued to increase, up 0.3% for the month, to yet another new record high:


This has been something of a mirror image of gas prices, rising consistently since June 2022.

Finally, the deflator in this morning’s report is used to calculate real manufacturing and trade sales, another metric relied upon by the NBER. This increased a strong 1.0%,also to another new record high:


In summary, with the exception of real spending on goods - which really just took back December’s big increases - this was an excellent report.  Inflation is now very close to the Fed’s preferred baseline rate, and both incomes and spending are up substantially. As I wrote last month, you would be well within your rights to call this a “Goldilocks” economy.

Initial claims still very positive, especially YoY


 - by New Deal democrat


Before I get to this morning’s personal income and spending report, let’s get the latest weekly update to jobless claims out of the way.


New jobless claims rose 13,000 to 215,000, while the four week moving average declined -3,000 to 212,500. Continuing claims, contrarily, rose 45,000 to 1.905 million, their second highest reading in over 2 years (but remains extremely low compared with the 40 years before the pandemic):


On the more important YoY basis for forecasting purposes, both the one week and four week average of new claims are down -2.7%, while continuing claims are up 10.9%, which remains better than almost all readings in the past 10 months:


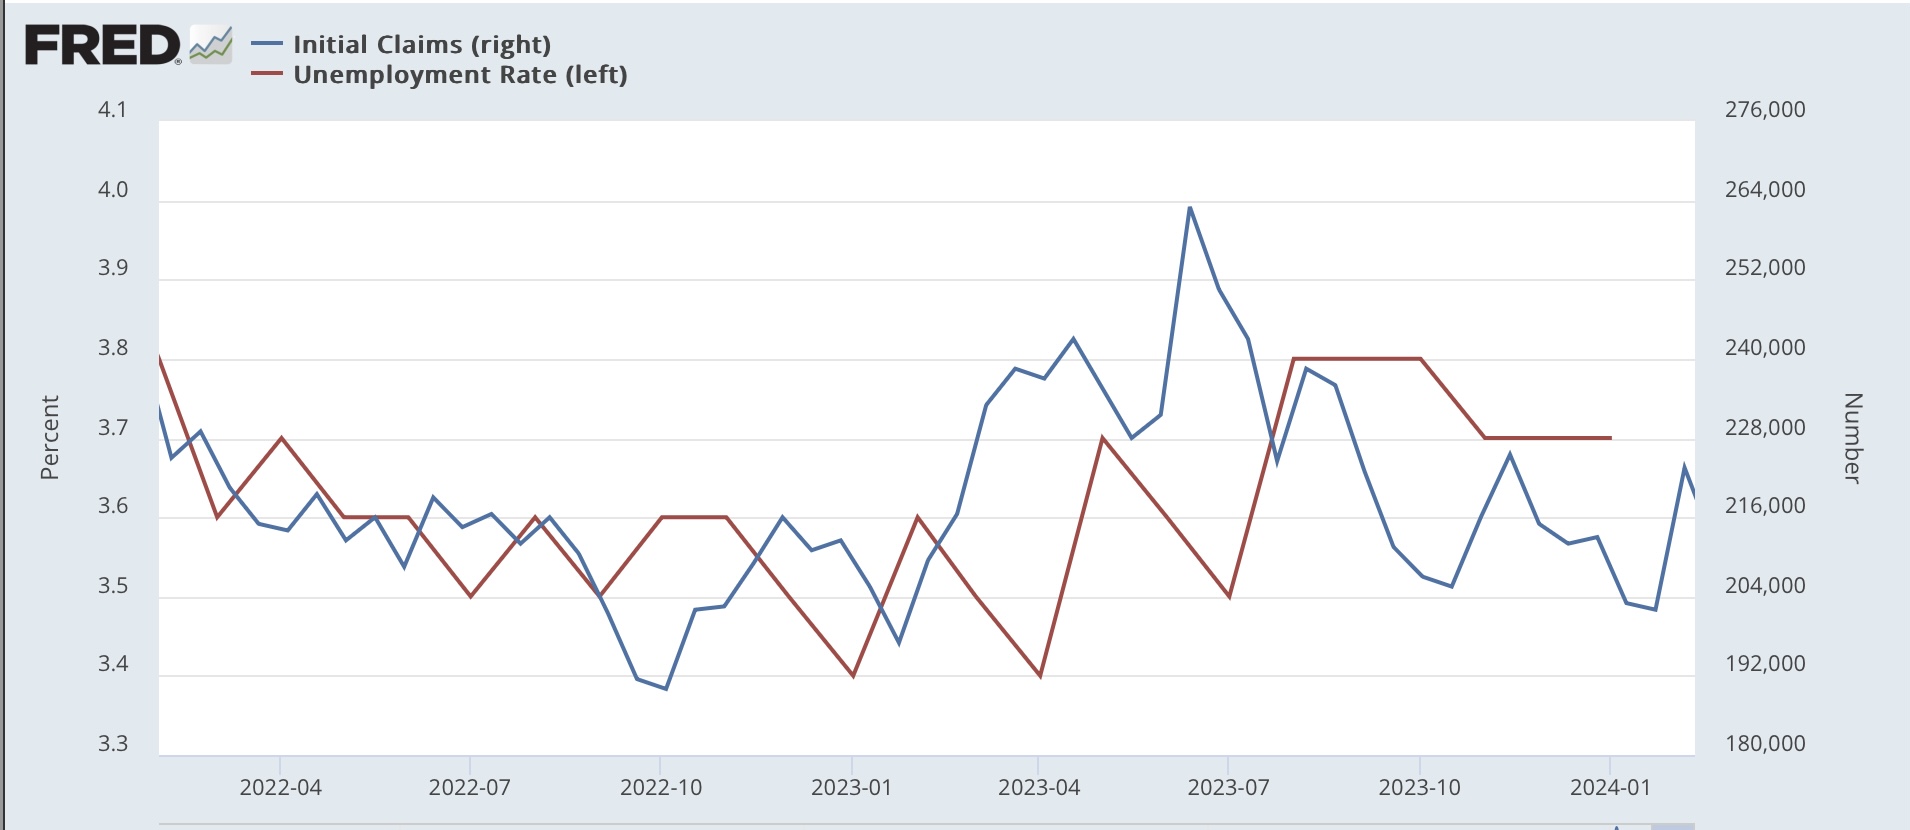
Finally, for purposes of forecasting the unemployment rate, the February average of claims continues to suggest that the unemployment rate will remain steady or decline in the next few months:


The Sahm rule for recessions is not going to be triggered in the nearest future.

Wednesday, February 28, 2024

The state of freight


 - by New Deal democrat


There’s no significant economic news today. Yesterday we did get durable goods orders, which are an official leading indicator. I don’t pay too much attention to them, because they are so volatile. Thus yesterday’s big -6.1% decline (blue in the graph below) is more likely than not just noise, particularly because “core” capital goods orders (red) increased 0.1%, and have been generally tending sideways. Another segment which is also an official leading indicator, consumer durable goods orders (gold), have been trending higher for the past six months:


Another important - and less noisy - way to look at the manufacturing and consumption aspects of the economy is to compare transportation with real sales. Note that comparing *production,* which seems logical, won’t work because so many products are imported and so are not caught in domestic production data. But they are caught in sales. The theory goes back to Charles Dow (he of the Dow Jones averages) who pointed out that every product that is produced, must be shipped to market before it is sold. Thus if there is a disconnect between production and transportation, something is amiss, and probably not to the upside.

To cut to the chase, here’s the comparison of real total sales and transportation going back to the start of the Millennium (which is when the freight index data starts):


You can see that they closely track one another, with a few exceptions that have gotten resolved within 12-24 months. Notably, before the 2001 and 2008 recessions, freight turned down significantly first.

Here is the close-up on the last several years:


We had a significant downturn in transportation early last year, but the trend has appeared to reverse higher in the past six months.

Another aspect of transportation, which has a solid historical leading quality is sales of heavy weight trucks. Here’s what they look like YoY (red) compared with passenger vehicles and light weight trucks (blue):


Not every downturn presages a recession, but every recession has been preceded by a downturn. And heavy weight truck sales always turn down before light vehicle sales.

Here’s the close-up of that for the past several years:


We have had a relatively minor downturn YoY during the autumn, but as of December that *may* have been resolving. We’ll find out in the next week when the January data is released.

Finally, trucks need to be driven (duh!). So employment in the trucking industry has also been a leading indicator. There, the news is definitely not good:


The big downturn in summer 2023 was the bankruptcy and closure of a major trucking company, with the resulting unemployment of its former employees. Some of that has been recovered since, but not that much, suggesting that the bankruptcy was signal, not noise. 

As indicated above, motor vehicle sales will be updated within the next week. Trucking employment will be a week from Friday as part of the February employment report.

Tuesday, February 27, 2024

Repeat sales house price indexes continue to increases on par with past expansions


 - by New Deal democrat


House prices lag home sales, which in turn lag mortgage rates. Yesterday we got the final January reading on sales. This morning we got the final monthly (for December) read on prices, for repeat sales of existing homes.


The FHFA purchase only price index rose 0.1% on a seasonally adjusted basis, and is up 6.6% YoY. Meanwhile the Case Shiller National index rose 0.2% for the month, and was is up 5.1% YoY. Here’s what the monthly numbers look like for the past five years:


Note that this month’s increase was the lowest since last January for both indexes.

Further, although the 6.6% and 5.1% YoY increases appear to be major, the long term graph of both of them below, compared with the CPI for shelter (red, *2.5 for scale) shows that this is actually similar to gains during the majority of the past 25 years outside of recessions:


For the month, the YoY increase in the FHFA index declined -0.1% from 6.7% in November, while the YoY increase in the Case Shiller index rose 0.5% from November’s 5.1%. As shown in the first graph above, this is because we had a period of actual declines in prices late in 2022. If present trends continue, these YoY comparisons will drop out in two months, and the YoY deceleration will continue.

It is likely that chronic under-building of houses in the decade after the Great Recession has much to do with such price increases outstripping worker pay.

Additionally, because house prices lead “Owners’ Equivalent Rent” in the CPI, the above graph shows that we can expect further declines toward the more normal 2.5%-3.0% YoY range over the coming months in that very important inflation metric. 

Monday, February 26, 2024

New home sales and YoY prices change little; expect sideways trend to follow similar recent trend in mortgage rates


 - by New Deal democrat


This week we conclude January’s housing market data with repeat sales prices tomorrow, and new single family home sales, which were reported this morning.


Per my usual caveat, while new home sales is that they are the most leading of the housing metrics, they are noisy and heavily revised. Which was the case this month, as last month’s number was revised downward by about 2%, or 13,000. January sales increased 10,000 from that revised number (blue in the graph below) to 661,000 annualized. The slightly less leading but much less noisy single family permits is also shown (red, right scale):


The likelihood is that single family permits will stall out at current levels and quite likely even decline in coming months, following the recent downward trend in sales.

Now let’s compare sales with the even more leading metric of mortgage rates. Both are shown YoY (rates inverted, and *25 for scale):


We are unlikely to see much more YoY improvement in new home sales. Since one year ago they stood at 649,000, this suggests their current absolute level is about where they are likely to remain in the next few months.

Finally, here’s the YoY update on median prices, which are not seasonally adjusted (red), which lag sales (blue):


We will probably continue to see negative YoY comparisons in prices for some months to come before the situation abates.

Generally speaking I am not expecting much in the way of big moves in new home sales or prices until there is a significant change in mortgage rates.

Saturday, February 24, 2024

Weekly Indicators for February 19 - 23 at Seeking Alpha


 - by New Deal democrat


My “Weekly Indicators” post is up at Seeking Alpha.

For an economy that seems to be crushing along, there sure are a lot of mixed signals. Some indicators, like the stock market, are soaring. Others, like temporary hiring, are at recessionary levels.

As usual, clicking over and reading will bring you up to the virtual moment as to the state of the economy, and will reward me just a little bit for my efforts in organizing and collating the data for you.

Friday, February 23, 2024

The “gold standard” of employment reports suggests that last summer’s job growth was even weaker than we thought


 - by New Deal democrat


While the monthly jobs report gets all the headlines, the “gold standard” for actual employment gains and losses is the Quarterly Census of Employment and Wages (QCEW), which as its name indicates, unlike the payrolls report is not a survey but rather an actual census of about 97% of all employers, via their withholding tax reports. The downside of the QCEW is that it is reported with a serious lag (4 or more months after the end of a quarter), and it also can be revised up until a year later. Once that happens, the nonfarm payrolls data from the previous year is also revised to be in accord.


Additionally, unlike the monthly jobs report, the QCEW is not seasonally adjusted. The Philadelphia Fed does estimate those season adjustments several weeks later, which is helpful.

All of which is by way of introduction to the fact that the QCEW for Q3 of last year was reported on Wednesday, and it suggests that job growth was weaker than officially reported.

Let’s start with the comparison data. Below are both the Establishment surveyand Household survey’s employment data YoY beginning January 2022 through the end of Q3 last year:


As remarked from time to time, while the Establishment survey is larger and less noisy, the Household survey numbers have been lower compared with the Establishment survey’s ever since March 2022.  As of June 2023, the Establishment survey showed a 2.1% YoY gain vs. a 1.8% gain in the Household survey. By September, that had decelerated to 2.0% and 1.7%, respectively.

Unfortunately, the QCEW does not come with adequate graphing data, and FRED doesn’t supply it either, so the below table will have to do:


With the annual revisions, the payrolls report reflects the YoY% changes in the QCEW quite well through June of last year. But with Q3, a significant downward divergence has opened up. 

This is primarily due to a much bigger than usual decline in July. To show you this, here are the non-seasonally adjusted comparison monthly numbers for the first nine months of 2023 for nonfarm payrolls (left) vs. the QCEW (right)(all number in thousands):

JAN. -2,523   -2,302
FEB.   1,129.     789
MAR.   436.     516
APR.    948.     834
MAY.    931.    1,116
JUN.    710.     828
JUL.    -861.   -2,122
AUG.    374.     795
SEP.    490.     791

TOTAL  2,634.   1,247

During the first six months of the year, the differences in the two measures largely netted out. The huge difference is in July, which was only partially made up in the next two months.

Let me reiterate that this is non-seasonally adjusted data. The seasonally adjusted payroll numbers for July through September (in thousands) were 184, 210, and 246, respectively.

But since the QCEW shows a net loss of -535,000 jobs in Q3 vs. the unadjusted nonfarm payrolls number, it’s at least possible that after the revisions are finalized, at least one of those three months is going to show an actual loss of jobs on a seasonally adjusted basis. 

Two final caveats: First, similar declines in Q3 jobs in the QCEW numbers were reported in 2017 through 2019, which also showed up in the unadjusted payrolls report (red), but the seasonally adjusted figures (blue) showed gains:


Secondly, we had a similar episode of a big decline in the Q2 2022 QCEW report, which resulted in an estimate of seasonally adjusted job losses by the Philadelphia Fed, but which were subsequently revised away in the next Quarter’s QCEW update.

But as you may recall, I have been increasingly concerned by the relatively poor performance of YoY tax withholding, which throughout 2023 decelerated from sharply higher levels to nominally negative by the end of December. Since tax withholding dollar amounts are affected by inflation as well as wages and hours worked, they don’t measure exactly the same thing as the QCEW, so caution is certainly in order. Nevertheless, on a preliminary basis, there is reason to believe that employment was even weaker last summer than the tepid monthly payroll gains have suggested.

Thursday, February 22, 2024

The bottoming process in existing home sales continues, as YoY price comparisons increase


 - by New Deal democrat


The bifurcation of the housing market between new and existing home components continues, as existing home sales continue near their bottom, but with a little improvement.


Specifically, in January sales increased 120,000 on an annualized basis from an upwardly revised (by 80,000) 3.88 million to 4.00 million. This is the seventh month in a row that the annualized rate has varied between 3.85 million and 4.11 million:


Because of the low inventory, the non-seasonally adjusted median price for an existing home increased to up 5.1% YoY, the highest YoY comparison since 2022:


The YoY improvement is consistent with what we have recently seen in the FHFA and Case Shiller repeat sales house price indexes:


It is also consistent with the slight improvement (to “less negative”) in the YoY comparisons in new apartment leases, as reported in the National Rent Index earlier this week:


The monthly non-seasonally adjustment in rentals better shows the bottoming process there:


Because of the all-time high in new apartment and condo completions, there has been more downward pressure on rents than on single family houses. The present situation remains that very few people are interested in trading in 3% mortgages for 7% mortgages, so existing home sales are somewhat frozen, while developers can adjust the footprint, amenities, mortgage rebates, and prices in new houses to generate more demand. 

The good news on jobless claims continues


 - by New Deal democrat


The good news on jobless claims continued this week, as initial claims declined -12,000 to 201,000. The four week moving average also declined, by -3,500 to 215,250. Continuing claims, with the usual one week delay, declined -27,000 to 1.862 million:


Needless to say, this also helped the YoY comparisons, which are more important for forecasting purposes. Initial claims are down -7.4%, the four week average is up a mere 1.1%, and continuing claims are up 8.6%. In the case of the last, that is the lowest YoY comparison since last March:


Recall that continuing claims, considered by itself, triggered some recession comparisons a few months ago. But that was not supported by initial claims, so was a false signal. For initial claims to even trigger a “watch,” let alone a recession warning, they need to be up over 10%, and remain so for over a month.

Finally, here’s the update on the monthly average of initial claims leading the unemployment rate, and thus also leading the Sahm rule for recessions:


The unemployment rate is like to decline in the next few months, or at worst remain steady. Any increase that would trigger the Sahm rule is off the table for now.

Wednesday, February 21, 2024

Perceptions of inflation vs. wage growth: why the divergence?


 - by New Deal democrat


My recent travels included visits to cousins and their children on both sides of my family. Without any prompting from me, inevitably the table talk turned to the state of the economy.

Rather than Bigfoot the opinions of my relatives, I decided to sit back and listen until they were all done before I weighed in.

The most important thing I learned by far is that inflation remains the #1 topic across the board. Nobody seemed to think that incomes were keeping up. There was skepticism even after I pointed to the relative better performance of average hourly wages in the past three years vs. inflation, and even after comparing their best guesses for things like eggs with the actual data.

Although we’ve seen improvement recently across measures of consumer confidence, I suspect there are two reasons for the persistence in the beliefs that inflation has made people in general worse off.

The first goes back to a principle of psychology: to be more effective, reinforcement has to be more frequent and more recent. When it comes to prices and incomes, prices of things like gas and groceries are encountered almost every day. Thus there is constant reinforcement of that data. But paychecks (and social security payments for retired people) are typically only received biweekly or even monthly, and they typically don’t increase except for once a year. Thus the reinforcement of the price data is far more powerful than the reinforcement of income data. There’s also the fact that “job switchers” have received much bigger pay increases than “job stayers.” For people in stable careers - who are much more likely to be job stayers - it’s entirely likely that a large minority at least have not received pay increases that have equaled inflation over the past three years.

The second issue is that real median household income might not have followed the positive trajectory of real hourly wages. The former have averaged being up 1.4% YoY for the past half a year, which historically is very good improvement (note: graph subtracts -1.4% from values to show current average at the zero line for easier comparison):


But here is the comparison of the annual changes in real average hourly wages (blue) with real median household income (red):


Through 2022, hourly wages (annually) and median income were both significantly below their pre-pandemic levels. Partly this is due to the fact that, even with better wages, the number of jobs still had not recovered to their pre-pandemic level until the middle of 2022. It is only when we measure more currently - only available in the wage series until this coming September- that we see an increase.

In my opinion, the very delayed, and only annual update, in real median household income  is one of the biggest shortfalls in the official government data. As shown above, real median household income for 2022 was only reported five months ago, and we’re already in 2024! 

Over the years there have been several private economic firms who have used data from the monthly Household survey to provide estimates of monthly changes in real household income. For example, Ironman at the Political Calculations blog has done this for more than 15 years. Here’s his most recent update:


But while annual real median household income, as measured officially, rose over 14% between 2007 and 2019, Ironman’s calculations only show an increase of less than 5% for the same period.

Recently, he has begun linking to another estimate by Motio Research, which appears to track the official government series far more closely, but is also updated monthly. Here’s their data through January 2024:


Note that until the middle of last year, real median household income had fallen back to 2019 levels. It is only in the past 6 months that it has risen sharply again, better than all levels except for those months during the pandemic where income included government stimulus payments.

If real median household income’s recent gains remain intact, or even improve further, I would expect the popular impressions of the relative impacts of wages and incomes vs. inflation to improve in the coming months as well.


Tuesday, February 20, 2024

Weekly Indicators for February 12 - 16 at Seeking Alpha


 - by New Deal democrat


I am back from my travels, so it’s time to catch up. There’s no significant economic news until tomorrow, but in the meantime I neglected to link to my weekly high frequency indicator wrap-up, which was posted at Seeking Alpha.

As usual, if you haven’t already done so, clicking over and reading will bring you up to the virtual minute on the economic data and forecast, and reward me a little bit for my efforts.

Friday, February 16, 2024

Housing construction essentially stable in January


 - by New Deal democrat


I’m on the road, so I need to keep this brief, but fortunately I can give you the essence of this most important housing report with little difficulty.


Mortgage rates have declined about 1% from their peak during the autumn, and are about equal to where they were one year ago:


As a result, we should expect some improvement in the housing market from its worst levels. And that’s what we got.

Housing permits declined 1.5% for the month, but are about average compared with the past 10 months. The more significant single family permits increased 1.6% to their highest level in over 18 months. The much more noisy starts decreased a sharp -14.8% for the month, to a level equivalent to their worst in the past year:


Because starts lag permits slightly, I do not think this decline presages a trend, but rather is mainly noise.

Housing units under construction, which are a measure of the “actual” economic activity in the new home market, declined -0.4%, but are only down -2.2% from their peak one year ago. Single family units declined -9,000, but multi family units increased 5,000:


To signify a likely recession, units under construction would have to decline at least -10%, and needless to say, we’re not there. With permits having increased off their bottom, I am not expecting such a 10% decline in construction to materialize. 

Retail sales faceplant; industrial production continues 16 month streak of weakness


- by New Deal democrat


Let’s take a look at two the big short leading and coincident indicators that were reported yesterday, respectively real retail sales and inducatrial production.

Retail sales can be volatile monthly, and about once in a typical year they either faceplant or unexpectedly soar. Yesterday we got the facelpalnt.

Retail sales declined nominally -0.8% in January. Because consumer prices rose 0.3%, in real terms sales declined -1.1%:


This is the lowest level in 10 months. It’s important to note that January sales, on a non-seasonally adjusted basis, are always awful, and while this year was even poorer than last year, it was better than in the years before the pandemic hit. So the seasonal adjustment may be a little askew due to pandemic-era comparisons.

On a YoY basis real retail sales (blue) are down -0.8%. Below I also show real personal consumption of goods (gold) and nonfarm payrolls (red), since the former two although noisy tend to forecast the trend in jobs:


If this were to persist, usually in the past is has meant recession (but not in the last 18 months!) - and note the unusual big divergence between the sales and consumption measures (for now!), which will probably resolve.

Meanwhile industrial production, one of the most important coincident indicators, also declined, by -0.1%, and is down -0.9% from its September 2022 peak. Manufacturing production declined sharply, down -0.5%, and is now -2.1% below its October 2022 peak:


This is the lowest reading for manufacturing production since the beginning of 2023.

On a YoY basis, total production is unchanged, and manufacturing is down -0.8%:


In the modern era since China’s accession to normal trading status in 2000, the 2023 downturn was not quite as negative as the 2015-16 downturn, which did not lead to a recession, although it was definitely as soft spot. 

While we did not get a recession in 2023, it is nonetheless true that both manufacturing and housing did decline from their respective peaks after the Fed began raising rates, and have not recovered them yet.

I am treating these reports as “more of the same” weakness for manufacturing, and a one-off volatile downward number for sales unless it is confirmed by further weakness for at least one more month.

Thursday, February 15, 2024

Initial claims remain positive


 - by New Deal democrat


Initial jobless claims declined this week -8,000 to 212,000. The four week average rose 5,750 to 218,250. With the typical one week lag, continuing claims rose 30,000 to 1.865 million:


On the more important (for forecasting purposes) YoY basis, initial claims are down -1.9%. The four week average is up 5.4%. Continuing claims are up 10.3%:


Initial claims indicate continued expansions. Continuing claims would be a significant issue if supported by initial claims, but this is their lowest YoY increase in eleven months. 

While the last several weeks of initial claims are higher than in January, they remain very low by historical standards, and continue to suggest that the unemployment rate will stay steady or decline in the next few months:


These remain good reports.

Wednesday, February 14, 2024

The long leading forecast for 2024 at Seeking Alpha


 - by New Deal democrat


A couple of times a year I update my long leading forecast. With the latest GDP and Senior Loan Officer Survey data, there is enough to take a look at what the next 12 months probably have in store.


This article is up at Seeking Alpha. 

Tuesday, February 13, 2024

January 2024 consumer inflation: still a tug of war between gas and housing


 - by New Deal democrat


As it has been for going on two years, consumer inflation has boiled down to a contest of strength between energy (mainly gasoline), which peaked in June 2022 and roughed in June 2023, and housing, which peaked in early 2023 and has been gradually disinflating since.


The headlines, as you presumably already know, are that total inflation rose 0.3% in January, and 3.1% YoY, while core inflation (less food and energy) rose 0.4% for the month and 3.9% YoY.

To spare you a bunch of graphs, here is the Census Bureau’s spreadsheet. Go down the column at the far right and it is easy to see where the remaining problem areas are:


The only sectors still up over 4% YoY are food away from home, transport services (mainly repairs and insurance), and - still - housing. The former problem areas of new and used vehicle prices are only up 0.7% and down -3.5% YoY respectively. Here’s what the first two remaining problem children look like YoY:


Inflation in food away from home is still gradually disinflating, although it is still running about 2% above its YoY rate before the pandemic. Transportation services, however, have stopped decelerating for over half a year. Some of this may be due to the reputed consolidation in the auto repair industry, where the remaining players have more pricing power. Some is undoubtedly also due to the fact that there is still a 5-10 million vehicle “hole” in cumulative new vehicle production since the pandemic hit, meaning there are many more older vehicles on the road, and those vehicles need increasing repairs.

To show the effects of the tug of war between energy and housing, below are the YoY% increases in headline inflation (which has been bouncing around between 3.1% and 3.7% for over half a year, core inflation, which has been very gradually trending downward, energy (now down -4.6% YoY, /3 for scale), and CPI ex-shelter, which is up only 1.5% YoY:


Once again, the only *real* inflation problem boils down to shelter.

Because an issue has been made by a few people about whether series like the Apartment List National Rent Index have been giving a true leading reading, here is the latest on that metric:


And here are the monthly% (blue, right scale) and YoY% (red, left scale) changes in the CPI for rent of primary residence:


Before the pandemic, monthly changes in rent typically were in the +0.2% to +0.4% range. Monthly rent just entered that range again, at 0.4%, in January. Similarly, YoY rents typically increased about 3.5%. In January, they were still at 6.1%, but the decelerating trend is very much intact. There is every reason to expect this decelerating trend to continue, and if it does so for the next nine months at the rate it has in the past nine months, YoY rent in the CPI will be about 3.4% - right in the middle of its pre-pandemic range.

Finally, here is this month’s update of the graph comparing house prices as measured by the FHFA Index (/2.5 for scale) with CPI for shelter; first, the long term historical view:


And here is the pandemic era close-up:


Although house prices have resumed increasing in the past half year, the pace of those increases is in line with their pre-pandemic trend. Which is to say that, although the pace of deceleration has itself decelerated, downward pressure is continuing on the CPI shelter index. And although CPI for shelter increased 0.6% in January, and is still up 6.1% YoY, that remains its lowest YoY increase since July 2022.

In other words, if there are no unpleasant surprises awaiting in the months ahead as to gas prices, we can expect headline inflation to continue to be fairly stable, and shelter to continue disinflating, leading to gradually lower core inflation readings as well.