Friday, August 18, 2023

The importance of 10 (and 20) year new highs in interest rates


 - by New Deal democrat

As you may have already read elsewhere, interest rates on the 10 year US Treasury just made a new 10+ year high. Perhaps more importantly, 30 year mortgage rates made a new 20+ year high:


Both rates are slightly above their previous highs from last October:


Almost always in the past, interest rates peaked *before* the Fed finished hiking interest rates. Which suggests that the Fed is likely to make at least one more rate hike. Typically, these rates have also peaked *before* a recession ever hit. In fact, their failure to make new highs for 4 months has typically been the first long-term event enabling a recovery after that recession. So the new highs in interest rates “re-set the clock” in terms of how far off in the distance a post-recession recovery might take place.

Secondly, as I wrote Monday, the “Big Story” of why it actually *is* different this time is the 10% decline in commodity prices occurring while the economy is still expanding. This has enabled, for example, home builders to lower the price of their new homes to offset the effects of Fed rate hikes.

So far this decline in commodity prices has been more important than interest rate increases. But once these declines are done, they’re done. In contrast, Fed rate hikes will affect future activity 1 and 2 years later. A contract for a new house that isn’t signed today will affect housing under construction a year from now, and the purchase of furnishings and landscaping items 2 years from now.

I expect housing’s recent recovery to reverse, probably to a level roughly equivalent to its lows 6 and 9 months ago. Will producers of consumer goods be able to lower their prices (even further in the case of home builders) to compensate for the increase in interest rates? We’ll soon see.

Thursday, August 17, 2023

Initial claims travelin’ man edition: still below cautionary levels


 - by New Deal democrat

Initial claims were 250,000 last week. The 4 week average increased to 234,250. Continuing claims with a one week delay were 1.716 million.


Most importantly, YoY the4 week moving average is up 9.5%:


This is well below the 12.5% YoY increase necessary to trigger a new caution.

Industrial production improves, with help from vehicle production: travelin’ man edition


 - by New Deal democrat

Industrial production increased 1.0% in July. Its manufacturing component increased 0.5%. Total production is still down -0.6% from its peak last autumn, while manufacturing is down -01.%:


These are not recessionary numbers. 

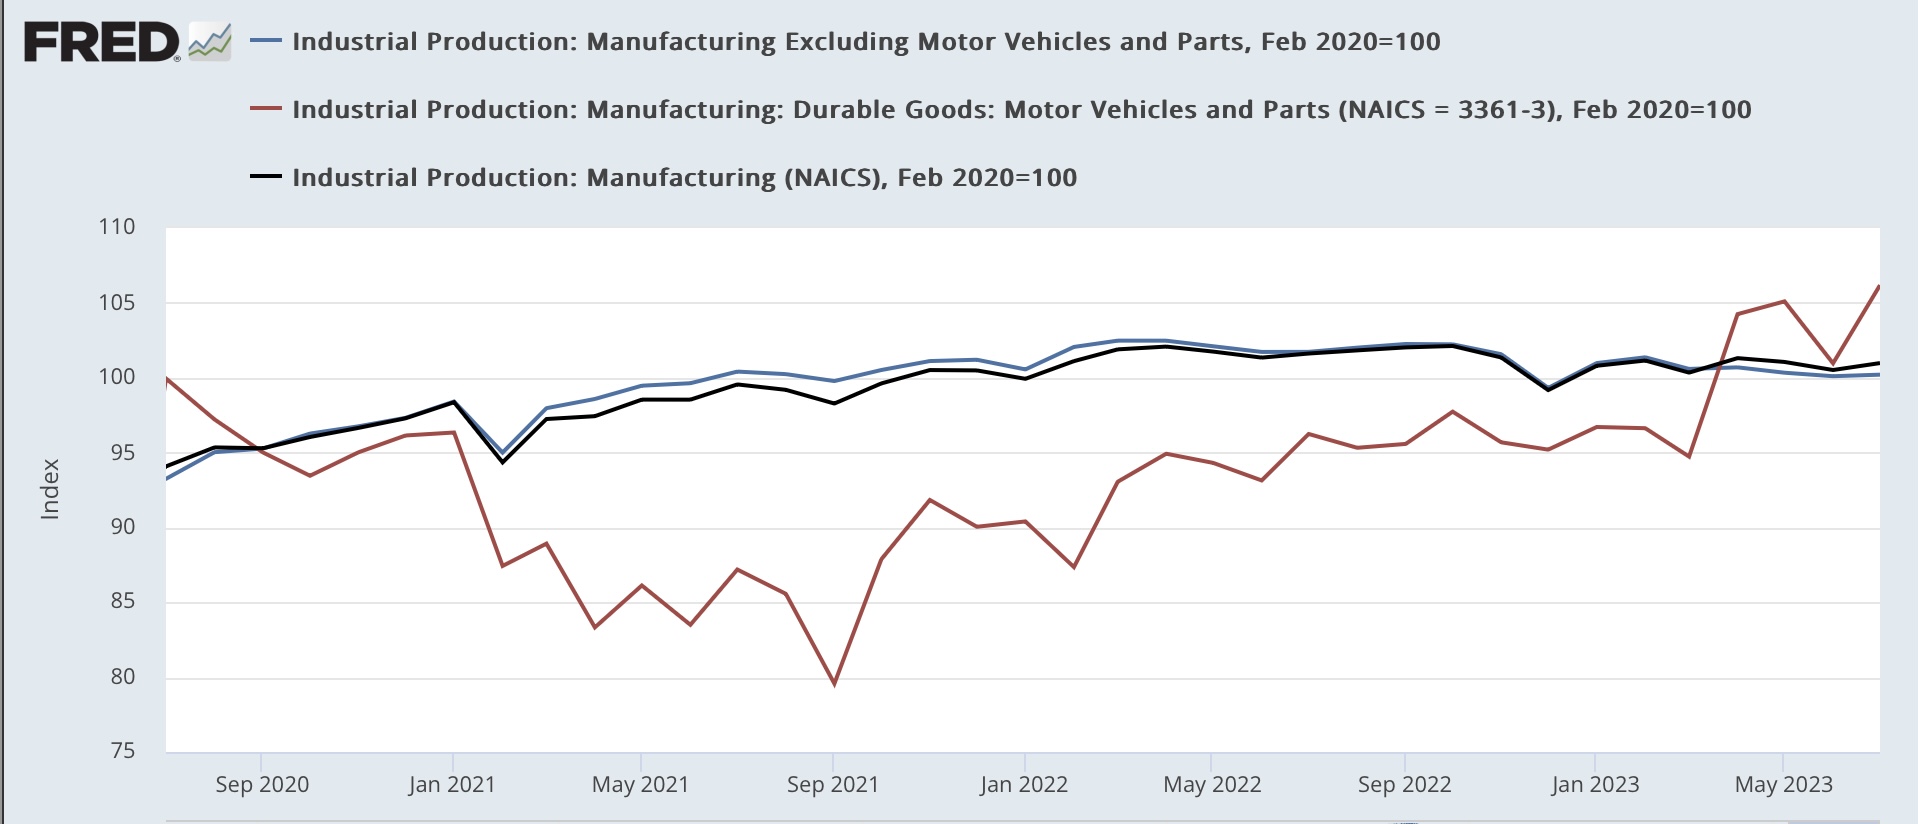
It’s worth emphasizing that the unspooling of pandemic related bottlenecks is significantly affecting these numbers. Below I show total manufacturing (black), manufacturing except for motor vehicles (blue), and vehicle manufacturing (red), all normed to 100 as of just before the pandemic:


Production of motor vehicles and parts is up about 10% this year. Were it not for that, manufacturing production would be down further.

Also, here is production of wood products, which has been tracking housing construction, and like construction has also had a little bit of a rebound this year:


This by the way shows an important difference between this metric and the ISM manufacturing index and Fed new orders indexes. The former is weighted by contribution, whereas the latter are diffusion indexes. The two types of indexes are telling us that while the bulk of manufacturing is down significantly, the ramping up of vehicle production is counterbalancing that.

Wednesday, August 16, 2023

In housing construction, the last domino still refuses to fall: Travelin’ Man edition


 - by New Deal democrat

[First, a blogging note: I will be traveling for the next week and a half. I’ll keep posting the data, but the posts are likely to be brief, and may be a day late. On days when there is no data, I will probably not post at all.]


When it comes to housing construction, I’ve been waiting for the last domino to fall. Once again in July, it didn’t.

Total housing starts rose 3.9%, but are -19% below their peak. Permits rose 0.1%, but are 22% below their peak. Units under construction, which is the “real” economic activity, rose 0.4% and is slightly, as in -2.7%, off its peak:


Single family permits are the most leading and least noisy data point. They were essentially flat, and both starts and permits are off about -25% from their respective peaks. Single family units under construction declined all of 5,000, and are -18.4% below their peak:


With the huge increase in the prices of houses after the pandemic, action shifted to multi-family units. Permits and starts for these were virtually unchanged last month. While permits are down -33% and starts are down -25% from their respective peaks, multi-family units under construction made yet another new all-time high:


The pace of construction for these multi-family units has barely slowed down at all:


Historically you have needed about a -10% decline in housing under construction before a recession actually began. Once again in July, the final domino - multi-family units under construction - did not fall. I suspect no recession will begun until it does.


Tuesday, August 15, 2023

July retail sales: gas and vehicle sales continue to dominate the trend


 - by New Deal democrat

As always, real retail sales tell us a great deal about what is happening in the consumer economy. July continued the recent trend since gas prices started declining over a year ago.


Nominally retail sales increased 0.7%. Since consumer prices increased 0.2%, real retail sales increased 0.5%. Here they are compared with real personal expenditures on goods since just before the pandemic:


Unsurprisingly, in the past year real retail sales have followed the trajectory of gas prices, declining in the second half of 2022 before increasing again in 2023.

Excluding gas sales, real retail sales have been almost relentlessly flat for the past 2 years:


Also, because there is potent evidence that motor vehicle sales have improved sharply since supply chain bottlenecks started to unspool last year, below I show total retail sales (blue) compared with retail sales for motor vehicles and parts (red), and retail sales excluding motor vehicles (black). Also shown are the number of cars and light truck sold (gold):


Clearly the improved sales of cars and light trucks are helping buoy retail sales.

To put it simply: the improvement in retail sales this year is coming from vehicle and gas sales, while consumers appear to be cutting back slightly on other purchases of goods.

Finally, because real retail sales /2 (blue below) are a short leading indicator for employment, here is the updated YoY graph comparing them as well as YoY real personal consumption of goods /2 (red) and YoY payrolls (black):


This relationship continues to forecast continued deceleration in jobs numbers in the months ahead, although not an outright decline at this point. In other words, basically more of the same.

Monday, August 14, 2023

This is the Big Story: a 100+ year near-record decline in commodity prices is enabling continued record wage growth and employment


 - by New Deal democrat

No important economic data today, so let me elaborate on the matter of “immaculate disinflation,” i.e., the decline in inflation without a decline in growth. I’m going to argue that, to the extent there is causation, it is the reverse of what is generally assumed, to wit: that there is decent growth without any meaningful hit to employment, which somehow is occurring while inflation is declining.


To the contrary, it is precisely *because* inflation is declining under the present set of circumstances that we are continuing to get good growth in employment and overall consumption.

Let me start by running a long term version of a graph I have highlighted many times over the years, average hourly wages YoY (red) vs. CPI (blue) and also CPI ex-fictitious shelter (blue green):


Going back 60 years, whenever wage growth exceeds inflation (the red line is higher than the blue or blue green lines), you are either in an economic expansion, or the end stages of a recession setting the stage for the next expansion. Consumers have an increasing amount of money to spend, and they are spending it.

Note the converse isn’t always true. Particularly from about 1970 to 1995, there were times when average wages weren’t keeping up with inflation but we were nevertheless in expansion. This is because that was the era of women entering the workforce by the millions. This operated to tamp down average wages. BUT, median household income grew. If that statistic were updated monthly or even quarterly, that’s what we would want to use. Unfortunately, it is only updated annually, so it’s realistically not available.

But do note that approaching recessions (with the exception of the pandemic), average wages either dip below inflation, or at least the gap is almost entirely closed. 

Currently average hourly wages are growing at a rate of 4.8% YoY, while headline inflation is up 3.2% and CPI ex-fictitious shelter is up only 1.0%. Consumers have more money to spend, and they are spending it.

But to look for why consumer inflation has become so tame, let’s look at commodity prices for producers.

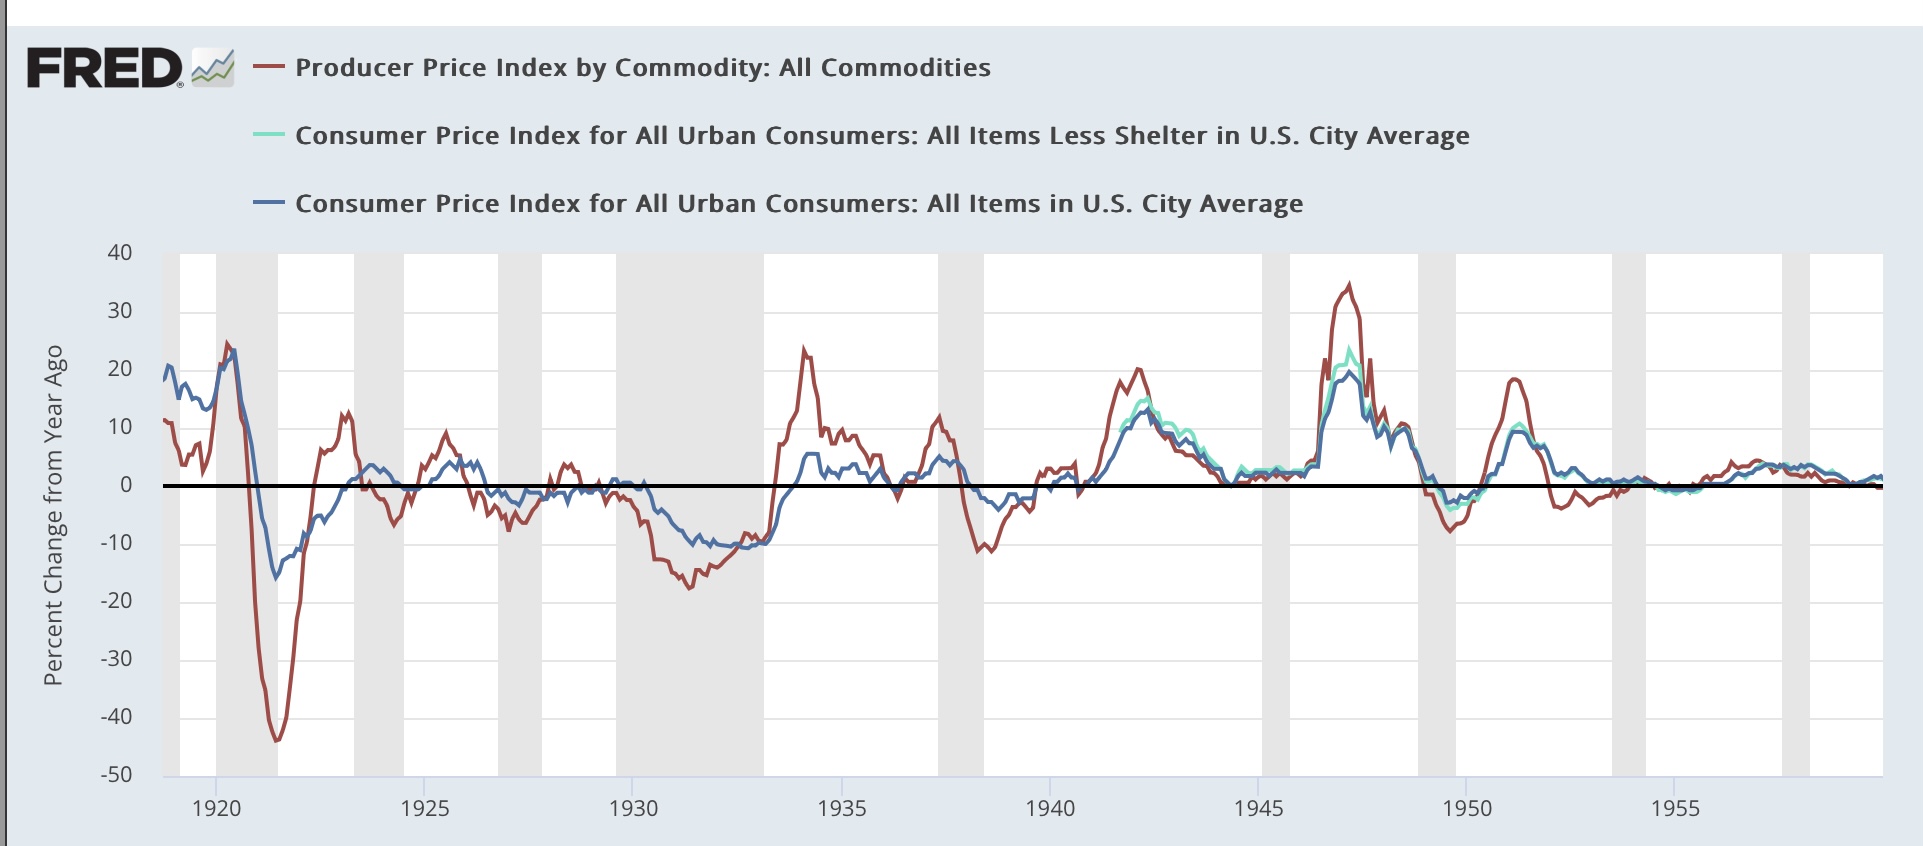
Here are two graphs of commodity prices (red) vs. headline consumer inflation and inflation ex-shelter going back 110 years:


At the far right of the second graph, you can see that producer prices were down close to -10% YoY one month ago. If you go back over the entire 110 year period, declines that steep only happened once in the past 70 years (at the end of the Great Recession). Before that, declines of -10% or more only happened late in or at the end of the recessions of 1920, 1938, and over -5% near or at the end of two recessions in the 1920s, and the 1950 recession. Recently declines nearly that steep happened at the end of the 2001 recession, during the 2015 “shallow industrial recession,” and the pandemic lockdowns.

It’s no coincidence that those steep declines are at or near the end of those recessions. Those big declines in costs to producers enabled them to cut sales prices to consumers (note that consumer inflation is also declining at those times), which made it earlier for consumers to buy those goods. And a new expansion began!

In fact, the disparity between producer commodity costs now and consumer inflation (shown in the graph below) is close to its most extreme in that entire 110 year period, as consumer prices YoY are running more than 10% above producer commodity prices). Only at the end of the Great Recession and the end of WW1 was the disparity so huge):


This huge decline in producer prices in the past year has enabled them to hire more workers at substantially higher wages and yet still pocket increased $$$, especially if they have market power and are able to maintain their recent price hikes.

As shown in the graphs above, typically sharp declines in producer prices occur because of demand destruction during recessions. But this time around, prices have declined because of the unspooling of pandemic-caused restrictions and bottlenecks. Because commodity prices are set globally, there may also be an element of a slowdown in Chinese manufacturing to the story as well, but for purposes of any impact on the domestic US economy, this is irrelevant.

This is the Big Story. This is why there hasn’t been any recession - at least not yet -despite huge Fed rate hikes. This is why I am temporarily paying much more attention to producer prices than I normally do. It’s also why I am looking for signs of that downdraft (hello, $3.80 gas prices again) ending.

Saturday, August 12, 2023

Weekly Indicators for August 7 - 11 at Seeking Alpha


 - by New Deal democrat

My Weekly Indicators post is up at Seeking Alpha.

For the moment we are in something of a holding pattern, in particular with the coincident indicators. Buoyed by the big downturn in commodity prices, and somnolence of consumer prices ex-fictitious shelter, the short leading indicators continue to be much more positive.

As usual, clicking over and reading will bring you up to the virtual economic moment. And while you are at it, I also updated my fundamentals-based “Consumer Nowcast” model, as to which this is the most important graph:


Both will reward me a little $$$ bit for my efforts.

Friday, August 11, 2023

July producer prices: economic tailwind weakens, but still in place


 - by New Deal democrat

Normally I don’t pay too much attention to the producer price index, but because the steep decline in producer prices has been such a boon to businesses, and a big tailwind for the economy as a whole, whether that continues or not is important.


And in July, the deflationary pulse generally continued. While final demand producer prices for goods edged up by 0.1%, intermediate stage prices for goods declined -0.7% and raw commodity prices declined -0.3%:


The YoY comparisons improved, because last July’s big initial decline (led by energy prices) rotated out of the comparisons:


Still, end state producer prices are down -2.5% YoY, intermediate stage by -7.8%, and raw commodities by -7.0%.

Bottom line: the tailwind is not as strong as before, but it is still in place.

Thursday, August 10, 2023

July CPI: almost everything except fictitious shelter costs are getting close to the Fed’s comfort range


 - by New Deal democrat

Gasoline prices and fictitious shelter prices are once again moving in opposite directions, in a direct reversal of what the situation had been in the past 12 months. During late 2022 into this year, energy prices came down sharply, while owners’ equivalent rent was increasing. Now energy prices are beginning to increase again, while fictitious shelter CPI finally catches up.


Here’s the closer look.

First, both headline and core CPI grew at a mild 0.2% pace in July. The former is only up 3.2% YoY (an increase from last month’s 3.0%), while the latter is up 4.7% YoY:


Headline inflation is really no longer a problem. But when we take out gas, and keep in shelter, it is still elevated.

Which brings us to shelter. Ex-shelter, CPI was unchanged last month, and is only up 1.0% YoY:


If we used actual monthly house price and rents, YoY CPI would probably be up only about 0.6%.

The fictitious owners’ equivalent rent increased 0.5% for the month, which is still better than the 0.7% and 0.8% it was increasing monthly late last year:


So let’s update OER (blue) with the FHFA (red) and Case-Shiller (gold) house price indexes:


Exactly as predicted, OER is following house prices down with roughly a one year lag. OER is up 7.7% YoY now, decelerating at roughly 0.2%/month. The big question is how quickly it will continue to decelerate. If it does so at the same pace as house prices did, it will take only about another 6-8 months to get back to the level of the Fed’s comfort zone. If it continues to decline at only 0.2%/month, it will take several years instead. I lean towards the former outcome, but we’ll see.

Another pocket of high inflation was food prices. This too continues to subside, up 0.2% for the month and 4.9% YoY:


At its current pace of YoY decline, it will be in the Fed’s comfort zone in about 3 more months.

Next, new and used car prices have also been a major driver of inflation. Both declined in July, the former by -0.1% and the latter by -1.3%. They are up 3.5% and down -5.6, respectively, YoY:


Again, it will probably take about 3 more months of this for new vehicles to get into the Fed’s comfort zone.

But the situation is different when we look at “transportation services,” which includes things like insurance, vehicle rentals and repairs. This was up 0.3% for the month, but is still up 9.3% YoY:


I’m giving you the full 35 year history of this series to show how, even with recent steep declines, the YoY rate is still extremely high by historical standards. A lot of this has to do with owners hanging on to older model cars rather than get the full force of new vehicle sticker shock. Those older model vehicles need lots of repairs, and lots of repair shop employees to do the work. Hence a spike in demand feeding a continued spike in prices. Even at the current pace of decline, we’re probably still about 6 months away from a more “normal” rate of inflation here.

Finally, let me show you the Fed’s preferred metric these days, which is sticky price CPI. On a headline basis, this continues to decelerate slowly YoY, but note that the 1 month and 3 month annualized rates are very close to the Fed’s comfort zone:


The same is true of the core sticky price metric:


I strongly suspect the Fed will still do at least one more rate hike, although there may be a brief pause. But if current trends continue for 3 more months, then nearly everything except fictitious shelter is going to be close to or within their comfort zone. Which may or may not make a difference to them.

A second final comment is that if there is a mild re-acceleration of headline inflation, but that is coupled with continued deceleration in wage gains, then I would expect to begin to see signs of consumes feeling squeezed within a few months. Which would not be good in tandem with a Fed continuing to raise interest rates.


Initial jobless claims: a little soft, but continued expansion signaled


 - by New Deal democrat

I’ll put up an analysis of this morning’s CPI later. In the meantime, initial jobless claims rose 21,000 last week to 248,000. The more important 4 week moving average rose 2,750 to 231,000. With a one week delay, continuing claims declined -8,000 to 1.684 million:


On an absolute level, all of this remains very good.

The YoY% changes are more important for forecasting purposes. There, for the week initial claims are up 15.9% YoY. However, the 4 week moving average is only up 7.9% - far too low an increase to be consistent with any imminent recession. Continuing claims remain very elevated YoY, up 24.6%:


Remember, because YoY claims did not cross the 12.5% threshold for 2 full months, we re-set the clock. While claims suggest a slight increase in the unemployment rate on the order of 0.2%-0.3% in the next few months, that is not nearly enough to trigger the Sahm Rule.

In short, a little softness, but no recession signaled.

Wednesday, August 9, 2023

What to look for in tomorrow’s CPI and Friday’s PPI


 - by New Deal democrat


We’re still in the post-jobs report lull in economic news today. That will end tomorrow with initial jobless claims, and also CPI and PPI tomorrow and Friday respectively.


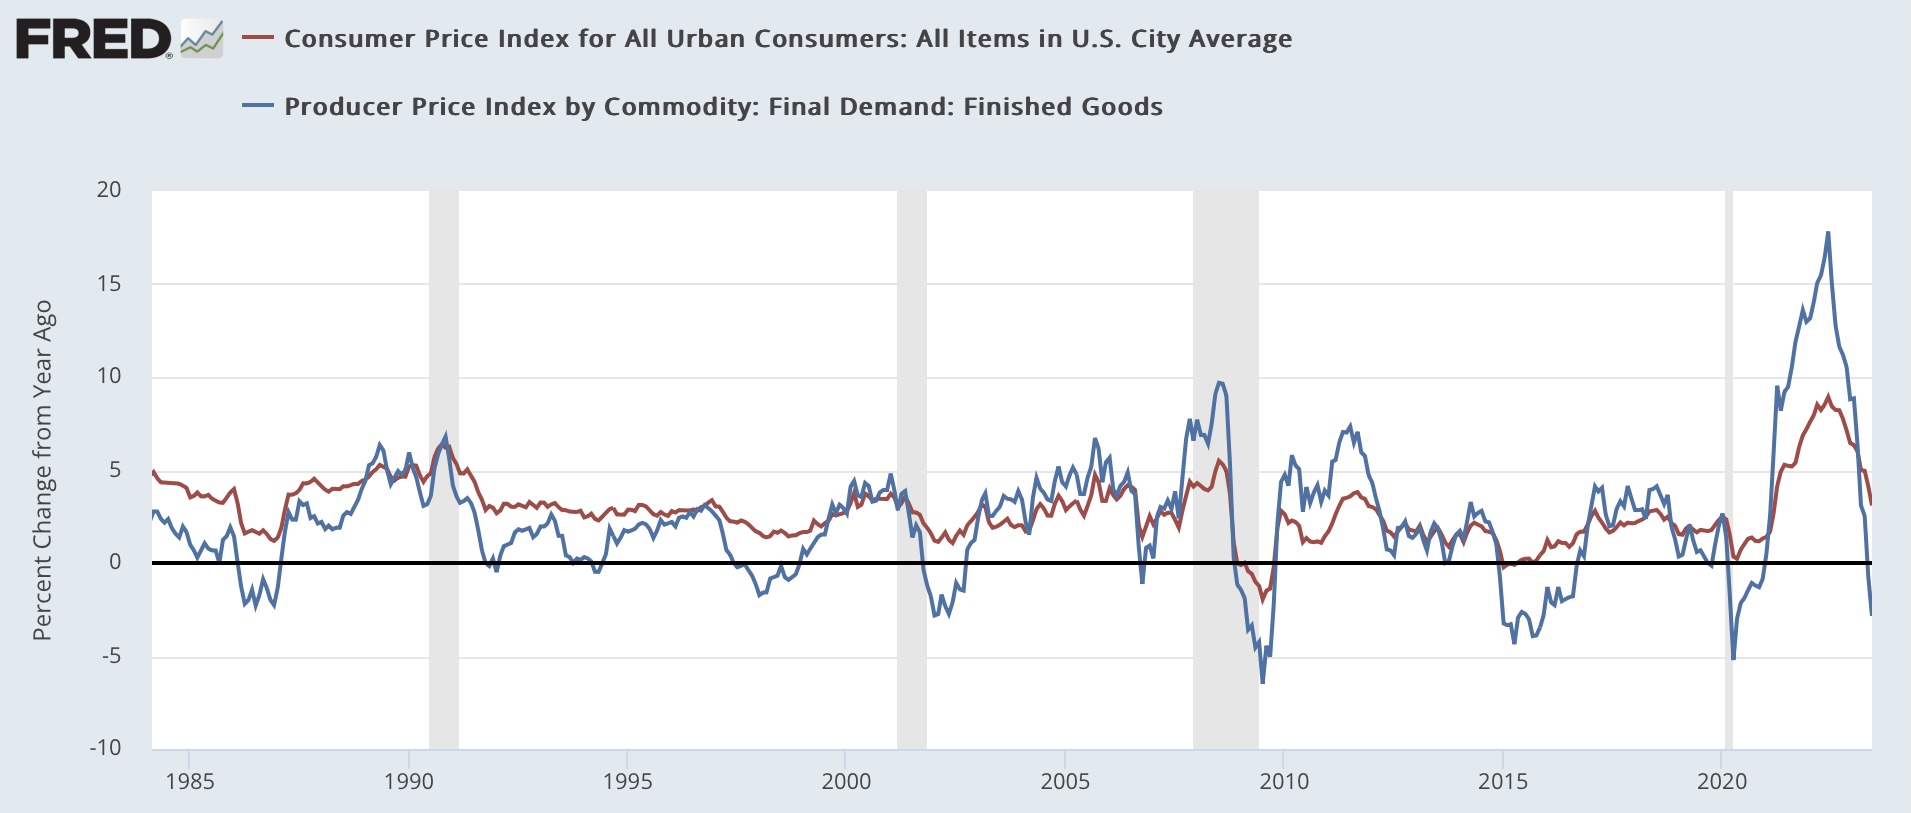
I always watch CPI, but I believe the PPI is uniquely important at present as well. To show you why, let me show you the YoY relationship between PPI and CPI for the past 75 years in two graphs below:


I’d like to focus your attention on those times when (1) both PPI and CPI were decelerating or declining YoY, and (2) PPI was decelerating or declining at a faster pace than CPI. 

Until recently, this relationship typically has occurred either in the latter part of recessions, or else early in recoveries just after the end of recessions. That’s because recessions kill demand, and since producer prices are more volatile than consumer prices, producer prices go down faster. Which lays the groundwork for the next expansion, as producers can produce goods more cheaply, enabling consumers to get a good deal - thus stimulating demand again.

But the relationship also has happened repeatedly in the middle of expansions in the past 40 years. Not always, but some of the time that has been not because of a decrease in demand, but rather an increase in the supply of commodities, chiefly but not necessarily limited to gas and oil. In those cases, consumers have just motored right through what otherwise would have looked like recessions.

Now cast your eyes to the far right. In the past year, commodity prices have declined almost 10% - one of the steepest declines ever. And that has *not* been because of a massive killing of demand, but rather because supply chain bottlenecks created by the pandemic have unspooled dramatically. 

At present the YoY% change in PPI prices are running -12.6% below that for the CPI, the highest in the entire 75 year period except for the very bottom of the Great Recession:


I am increasingly of the opinion that this amounts to a hurricane force tailwind behind the economy.

So tomorrow and Friday I will be looking to see if this trend continues, or if there are signs of a reversal. Tomorrow that may be evident in CPI ex-fictitious shelter, and on Friday we may see the first increase in PPI for raw commodities since January and only the second in the past year. If the downward trend continues, the tailwind is continuing. If the downward spiral breaks, then as the tailwind abates the lagged effects of Fed rate hikes will likely come to the fore.


Tuesday, August 8, 2023

Coronavirus special update: the annual summer wave has arrived


 - by New Deal democrat

As I wrote at the beginning of this year, I would only post Coronavirus updates if there appeared to be something significant happening. And there is.


There is a completely new alphabet soup of XBB subvariants that are competing with one another, and one of them, EG.5.1, has been surging in a number of countries worldwide and is now the fastest growing subvariant in the US as well:


Since the CDC and most States have stopped reporting, our only reasonably reliable metric for infections is Biobot’s waste surveillance, which shows that for the fourth summer in a row, from an all-time low in late June, particles in wastewater have more than doubled, to levels last seen back in April:


The increase is occurring across all four US Census regions:


Hospitalizations started increasing during the week of July 15, and are now about 50% higher than their recent nadir, although they are still lower than 10,000, which was their previous low in summer 2021 and spring 2022:


Deaths probably started rising from their all-time weekly low under 500 during the same week, although reporting is not final yet:


It’s too soon to tell how high the peak of this summer save will be, or when it will take place. But it is clear now that we are having yet another summer wave, aided no doubt not just be summer get-togethers, but also be an increase in indoor activities and the absence of any mitigation measures whatsoever. And also the facts that resistance due to prior infections and/or vaccinations are likely waning, and the next booster won’t be available until (apparently) sometime this autumn.

I have begun to temporarily revert to my prior precautions, mainly masking in any indoor public venues.

Monday, August 7, 2023

Scenes from the July employment report


 - by New Deal democrat

On Friday I noted that the July employment report was a perfectly good, solid one in absolute terms, but that almost all the leading components were soft and weakening, as I would expect to see near the final stages of an expansion.


Let’s take a look with some graphs today.

First, the good news.

The employment population ratio for the prime age working group, ages 25-54, at 80.9%, is the highest it has ever been except for the tech boom of the late 1990’s:


And the unemployment rate, at 3.5%, is only 0.1% higher than its lowest level during this expansion, and is tied with the lowest levels of 2019, which are the lowest in over 50 years:


Wages for non-managerial workers rose 0.5% for the month, and at an annual rate of 4.8%, which is 1.7% higher YoY than the last monthly read on inflation:


Wages rising at 1.7% over inflation is better than all but about 7 the last 60 years:


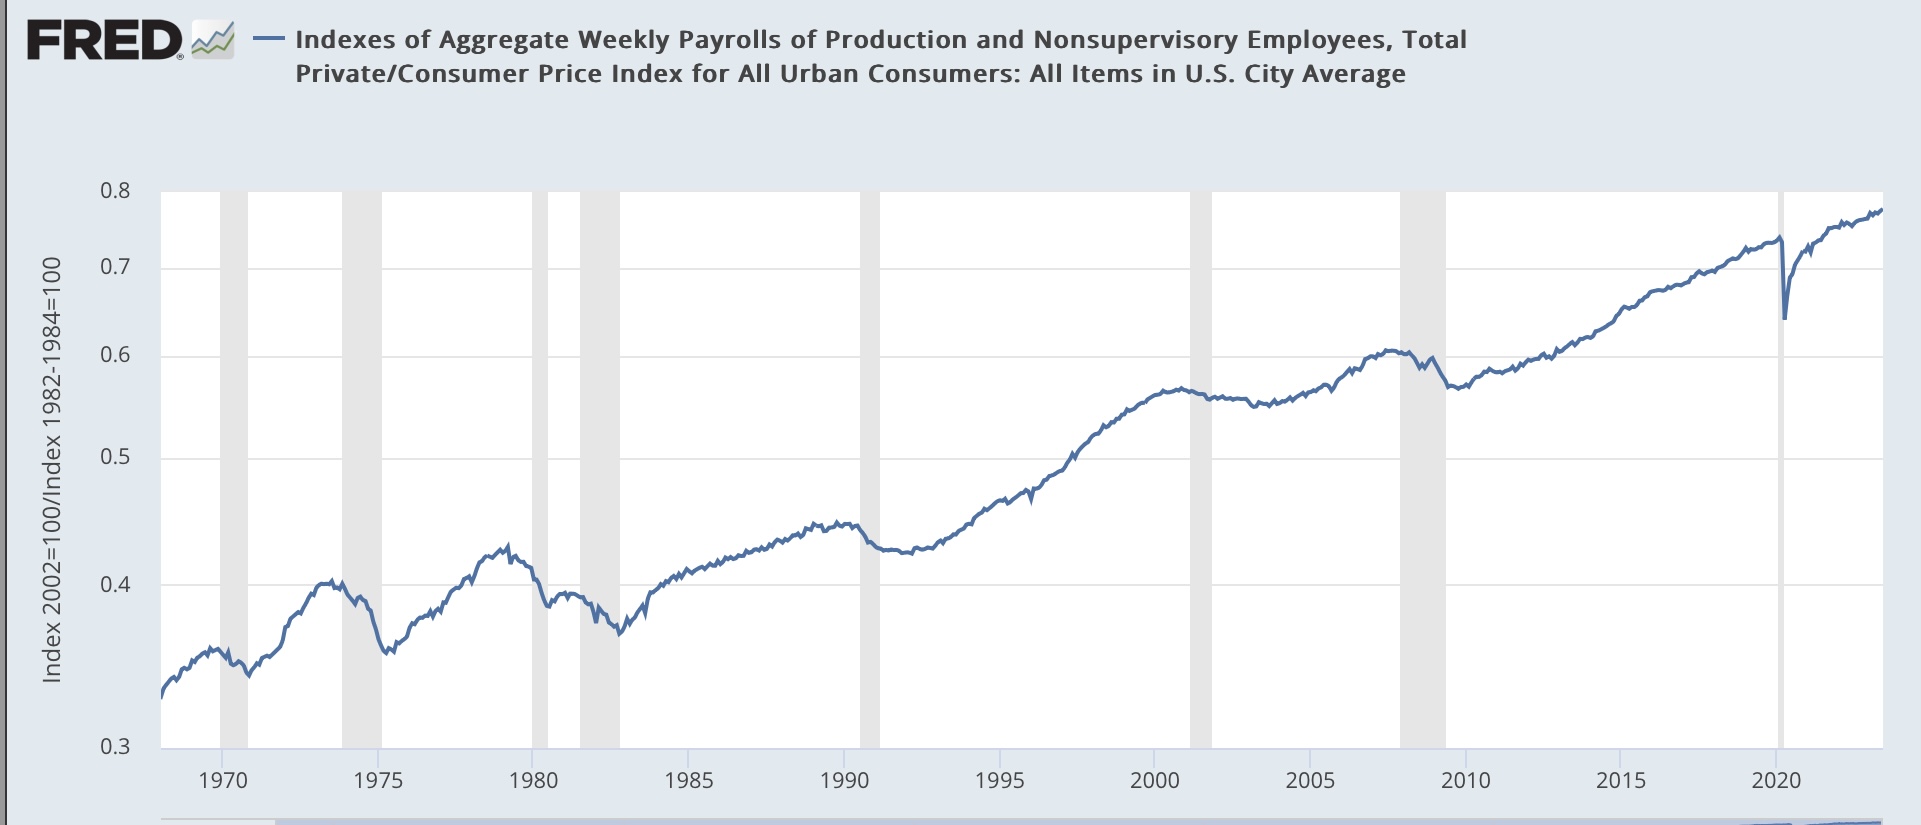
Finally, except for the pandemic it has *always* been the case that real, inflation-adjusted payrolls for workers have peaked a number of months before a recession. Unsurprisingly, this typically causes consumers in the aggregate to cut back spending, an immediate precursor to recessions:


In July in nominal terms aggregate payrolls rose 0.6%, or 6.4% YoY, a full 3.3% higher than inflation as last measured, to another all-time high.

In short, just about everybody who wants a job can find one, and the economy is functioning as close to completely full employment as it has been in over half a century, and those workers are earning wages at a level over inflation better than at almost 90% of all times in the past 60 years.

That is pretty darn good.

Now for the storm clouds out on the horizon.

Before industrial producers cut jobs, they cut back hours. And weekly hours for nonsupervisory workers in manufacturing have been cut back by almost 1 full hour, a decline typically seen shortly in advance of most past recessions:


In general manufacturing, residential construction, and temporary help jobs are among the first to turn down before a recession, as shown below for the past 50 years, or as long as records have been kept respectively (note 2 series are shown on right scale for easier comparison):


Now here is a close-up of the past year:


Temporary help jobs are down sharply, residential construction jobs down significantly, and manufacturing jobs are flat. The broader measure of goods-production jobs generally has increased only 0.4% since February, a declining rate typically seen late in expansions:


With the exception of factory hours and temporary help, none of these numbers are what I would expect right before a downturn starts. But definitely later in an expansion, on the order of 12-18 months before a recession.

Saturday, August 5, 2023

Weekly Indicators for July 31 - August 4, and long term forecast through H1 2024 at Seeking Alpha


 - by New Deal democrat


My Weekly Indicators post is up at Seeking Alpha.

No big changes in the data, but note that mortgage and other interest rates are up close to their peaks. This will operate to slow down growth in the housing market among other things.

As usual, clicking over and reading will bring you up to the virtual moment, and reward me a little bit for my efforts.

Also, earlier this week I did a comprehensive update of my long term forecast through the first half of 2024, which you can also find over there.

Friday, August 4, 2023

July jobs report: almost across the board deterioration in leading sectors


 - by New Deal democrat


My focus remains on whether jobs growth continues to decelerate, and whether the leading indicators, particularly manufacturing and construction jobs, as well as the unemployment rate (which leads going into recessions) have meaningfully deteriorated.

Almost all of these items did deteriorate in July.

Here’s my in depth synopsis.


HEADLINES:
  • 187,000 jobs added, which would be the weakest monthly number since December 2020, except that last month was revised down to 185,000.
  • Private sector jobs increased 172,000. Government jobs increased by 15,000
  • May was revised lower by -25,000 and June by -24,000, for a total of -110,000. The three month moving average decreased to 218,000, the lowest since January 2021.
  • The alternate, and more volatile measure in the household report rose by 268,000 jobs. The YoY% gain in this report is +1.9%.
  • The U3 unemployment rate declined another -0.1% to 3.5% (still above the 3.4% low last year). The civilian labor force, the denominator in the figure, rose slightly (by 152,000), while the numerator, the number of unemployed, declined by -116,000.
  • U6 underemployment rate declined -0.2% back to 6.7% 
  • Further out on the spectrum, those who are not in the labor force but want a job now declilned -142,000 to 5.247 million, still well above its post-pandemic low of 6.5% set last December.

Leading employment indicators of a slowdown or recession

These are leading sectors for the economy overall, and help us gauge how much the post-pandemic employment boom is shading towards a downturn.  These were almost all negative:
  • the average manufacturing workweek, one of the 10 components of the Index of Leading Indicators, declined -0.1 to 40.6, equal to its lows earlier this year and down -0.9 hours from February 2022 peak of 41.6 hours.
  • Manufacturing jobs declined by -2,000.
  • Within that sector, motor vehicle manufacturing jobs declined -2,200. 
  • Construction jobs increased by 19,000, in virtually every subsector except for residential construction.
  • Residential construction jobs, which are even more leading, declined by -5,500. It continues to appear likely that January was the peak for this sector.
  • Goods jobs as a whole rose 18,000. These should decline before any recession occurs. They remain up 1.7% YoY, which is a very good pace compared with most of the last 40 years.
  • Temporary jobs, which have generally been declining late last year, declined further, by -2,200.
  • the number of people unemployed for 5 weeks or less declined -54,000 to 2,004,000.

Wages of non-managerial workers
  • Average Hourly Earnings for Production and Nonsupervisory Personnel increased $.13, or +0.5%, to $28.96, a YoY gain of 4.8%, a 0.1% uptick from its lowest YoY gain since June of 2021 set one month ago.

Aggregate hours and wages: 
  • the index of aggregate hours worked for non-managerial workers increased 0.2%, and is up 1.6% YoY.
  •  the index of aggregate payrolls for non-managerial workers rose 0.6%, and increased 6.4% YoY, 0.2% higher than its 2+ year low set one month ago, and significantly above the inflation rate, meaning average working class families have more buying power.

Other significant data:
  • Leisure and hospitality jobs, which were the most hard-hit during the pandemic, rose only 17,000, -352,000, or -2.1% below their pre-pandemic peak.
  • Within the leisure and hospitality sector, food and drink establishments rose 13,400, but remain-64,400, or -0.5% below their pre-pandemic peak.
  • Professional and business employment declined -8,000. This is the first decline in this important sector since the end of the pandemic lockdowns. This series had already been decelerating, and is currently up  1.6%, its lowest YoY gain since March 2021.
  • The employment population ratio rose 0.1% to 60.4%, vs. 61.1% in February 2020.
  • The Labor Force Participation Rate was unchanged at 62.6%, vs. 63.4% in February 2020.


SUMMARY

This was a soft report (nevertheless quite positive by historical standards), which together with revisions to the last several months, marks another notch downward in deceleration. 

Almost all of the leading metrics were down. Employment in the entire goods sector has only shown gains due to transportation equipment manufacturing and non-residential construction. The comeback in leisure and hospitality jobs is much fainter. Professional and business jobs - one of the best paying sectors - may be rolling over. That revisions appear to be becoming routinely negative is also not a good sign.

The two bright spots in the report were un- and under-employment, which declined (contra the trend I expect them to take, based on the YoY increase in initial jobless claims) and wages. Average wage gains of 0.5% and aggregate wage gains of 0.6% in a month are very good for workers. Almost certainly they will exceed the monthly inflation rate once again. Because of these two things, this was absolutely not anything close to a recessionary report. 

But the slowdown almost across the board in leading sectors is akin to another compartment of a sinking ship flooding. Still, I do not think we get a recession until goods producing jobs as a whole decline. At their current pace of deceleration, that would be in about 9 months.