Saturday, March 4, 2023

Weekly Indicators for February 27 - March 3 at Seeking Alpha


 - by New Deal democrat


My Weekly Indicators post is up at Seeking Alpha.

A number of indicators which had been declining have stabilized since the beginning of the year, leading to increased speculation about a “soft” landing or even a “no landing” at all. The bulk of the long and short leading indicators beg to differ.

As usual, clicking over and reading will fill you in on all the details of both the forecasts and the nowcast, and reward me a little bit for putting the information all together in an organized format for you.

Friday, March 3, 2023

Real final sales and inventories as portents of recession


 - by New Deal democrat


As I have mentioned previously from time to time, I read people who have interesting things to say even if their worldview is very different from mine. One such person is Mike Shedlock, a/k/a Mish. He’s an aggressive libertarian and has a long track record as a Doomer, but he frequently parses some thought-provoking economic data. It makes me think, even if I ultimately disagree, and that’s a good thing.


As you might imagine, for the past year he’s been talking about an ongoing recession. Not so noteworthy. But about a week ago he parsed Q4 GDP and pointed out that, when you take out inventories, real final sales and in particular real final sales to domestic purchasers looked extremely close to recessionary levels.

So I took a look, and here’s what I found.

First of all, here are real final sales (red) and real final sales to domestic purchasers (blue) for the last 8 quarters, both normed to 0 as of their Q4 2022 readings for ease of comparison:


Not exactly scintillating, but not negative either.

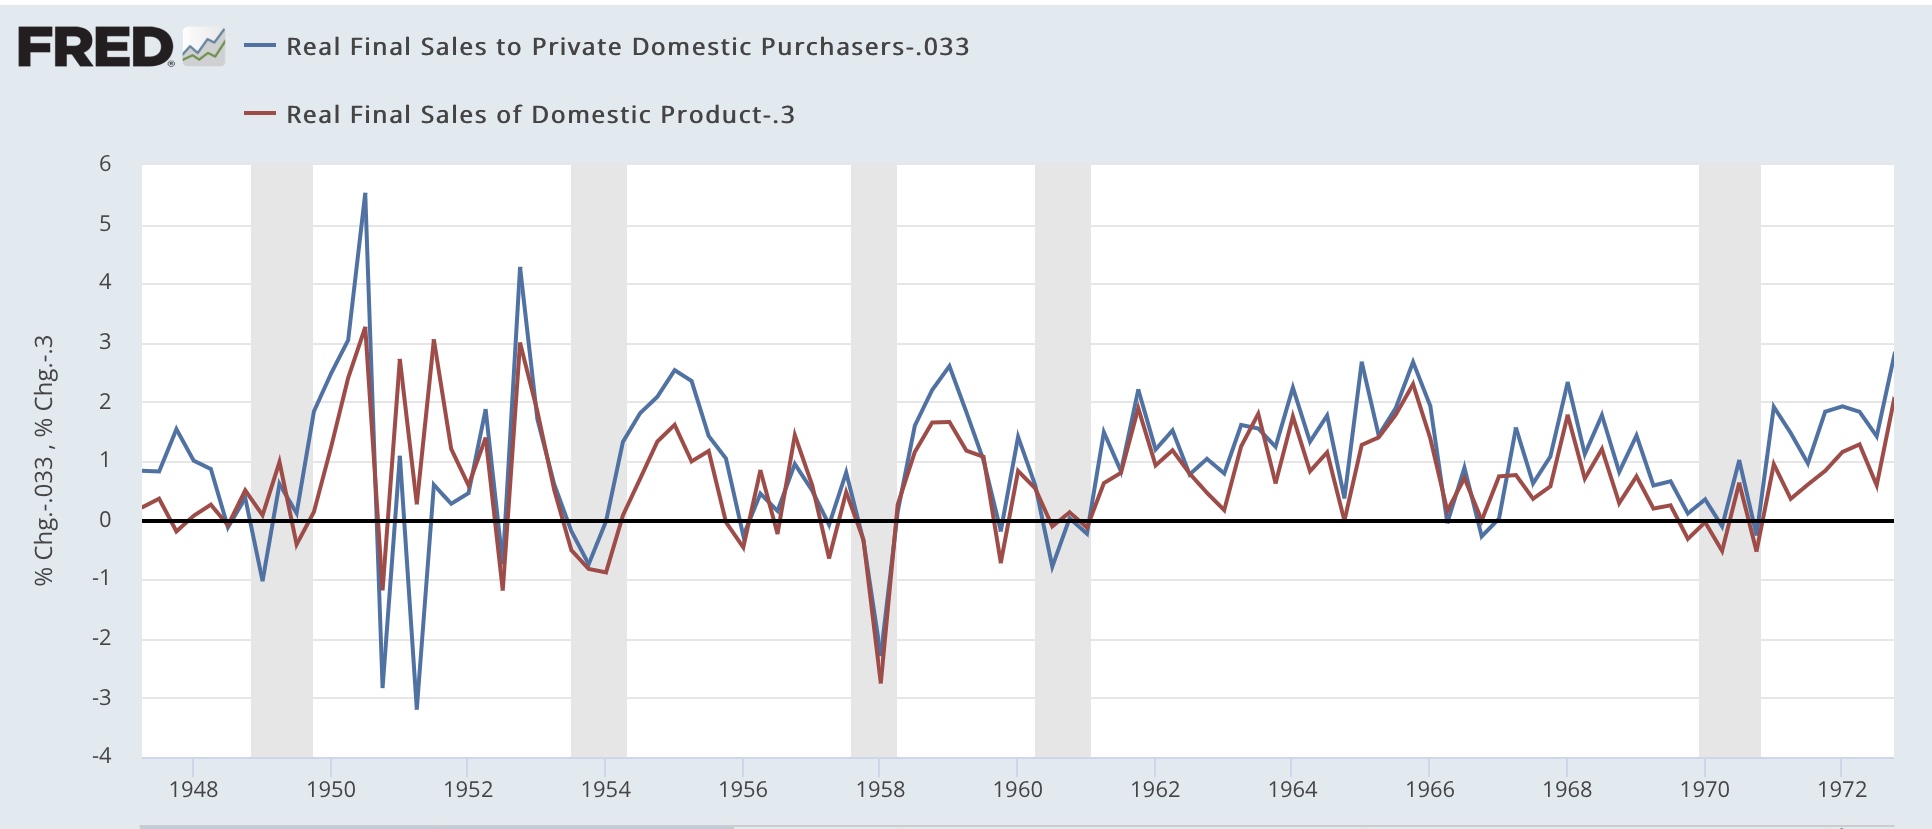
Now let’s look at the historical record, going all the way back to their start in 1947. Below I split up the series into 3 equivalent time periods, omitting 2020 (so that they’re not just squiggles) and, as with the graph above, normed both series to 0 as of their Q4 2022 readings:


There are lots of false positives (i.e., recession signals) if we rely on just one of the two series being as low Q/Q as they were in Q4 2022. But if we sort out when *both* were at readings that low, we get a much more interesting signal.

In *every* recession (of the 12 since the end of WW2), there was at least one quarter where both readings were as low or lower as they were in Q4 2022. Further, frequently they both turned negative 1-3 quarters before a recession began. If we take those out, there are only 5 false positives, and 3 of those are in the late 1940s and 1950s. In the past 60 years, there have been only 2 false positives, in 1966 and 1987, which were deep slowdowns that didn’t quite turn into recessions. 

So the deep slowdown in real final sales and real final sales to domestic purchasers in Q4 is telling us that the economy was by no means out of the woods.

One important difference over the years is how quickly producers responded to changes in demand by increasing or liquidating inventory. Before 1992, there was a consistent and demonstrable lag:


In other words, suppliers continued to build up inventory for a quarter or more after sales turned down. To eliminate this build-up, they cut production and also the workers on the production line.

Since 1992, with the “just in time” inventory model, frequently with overseas suppliers, inventory liquidation has happened more quickly and with a far less severe impact on sales:


Given the problems with the “just in time” model exposed by the pandemic, producers may be reverting to a more conservative “just in case” model, which will require steeper inventory reductions again. 

Before the first estimate of Q1 2023 GDP at the end of April, we’ll get January and February business sales and inventories, which will give us some information as to what is happening with inventories, and whether the Q4 weakness in real final sales was indeed a portent of recession.

Thursday, March 2, 2023

Jobless claims: the situation remains, ‘all system go’


 - by New Deal democrat


Initial jobless claims declined -2,000 last week to 190,000, while the 4 week moving average increased 1,750 to 193,000. Continuing claims, with a one week delay, increased 5,000 to 1,655,000. All of these remain excellent numbers:


To repeat my meme over the past year, virtually nobody is getting laid off. It’s almost impossible to have an economic downturn with that kind of evidence.

To wit, on a YoY basis, while the past one week and continuing claims are both slightly higher, the crucially important 4 week average remains lower:


Unless and until the 4 week average goes higher YoY by at least 10%, this series is not even worthy of a yellow flag. For now when it comes to employment, it remains ‘all systems go.’

Wednesday, March 1, 2023

February manufacturing and January construction continue negative, while auto sales improve


 - by New Deal democrat


We started out yet another month of data with bad news in two leading sectors.


The ISM manufacturing index has been showing contraction since November, and its more leading new orders subindex since September. And did so again in February, with the total index increasing slightly to 47.7, and the new orders index rebounding from a horrible 42.5 to 47.0. But because both of these numbers are below 50, they still show contraction:


In the past, the ISM has said that numbers below 48 have been most consistent with recession. 

Meanwhile, construction spending for January also declined by -0.1%, and the more leading private residential construction spending declined by -0.6%:


Even after factoring in the prices for construction materials, which declined -0.1% in January, “real” residential construction spending declined -0.5%:


Finally, in a bit of relatively good news, it appears that the crunch in motor vehicle production may have eased somewhat, as in January 15.7 million autos and light trucks were sold on an annualized basis, the highest number since June of 2021 (the below graph norms that to 0 to better show comparisons):


A more typical expansionary reading before the pandemic would have been between 17.0-18.0 million units annualized, so this is still a shortfall, but is much closer to a normal range than we have seen in the past year.

When February payrolls are reported a week from this Friday, the leading sectors of manufacturing and construction jobs, neither of which has turned down as of now, will be of special importance.

Tuesday, February 28, 2023

Housing prices continue to come down - like a feather


 - by New Deal democrat


As I’ve repeated many times in the past 10 years, in housing prices follow sales with a lag. Housing permits and starts both peaked early in 2022, and house prices followed during the summer.


This morning the FHFA and Case Shiller house price indexes for December showed continued declines both on a monthly and YoY basis, continuing to presage a similar decline in CPI for shelter by the end of this year.

Here is what both look like normed to 100 as of their June peaks:


The FHFA index is down -0.9% since then, and the Case Shiller national index down -2.7%.

Notice that between June 2020 and June 2022, both indexed increased by an average of over 1% a month, but have declined at a much smaller rate. In other words, in the aftermath of the pandemic house prices shot up like a rocket, but to date are only drifting down like a feather.

The YoY comparisons, on the other hand, are getting much better. At their peaks during spring 2022, both measures of house prices were up about 20% YoY. As of December, the FHFA is down to +6.6% YoY, and the Case Shiller index +7.6% YoY:


If this rate continues, YoY prices will turn down later this spring.

As I have been emphasizing for over a year, house prices lead the CPI measure of Owners’ Equivalent Rent by 12 or more months. Here is the last 20 year history of the YoY% change in the FHFA Index (red, /2.5 for scale) vs. Owners’ Equivalent Rent YoY (blue):


The good news is that the CPI measure for housing continues to be on track to decline to about 3%-3.5% YoY by about the end of 2023, close to if not within what ought to be the Fed’s comfort range. 

Unfortunately we probably have a few months to go before the official measure of CPI for shelter peaks, likely at 8.0% or higher.

Finally, let’s take a look at households’ ability to make the down payment (leaving mortgage rates aside for this purpose). As shown in the below graph which norms house prices by the average weekly paycheck for nonsupervisory workers, house prices are still  only -3.0% below their all time high, set last May:


So even if prices moderate further as this year goes on, which is likely, housing is still going to be very expensive relative to historical norms.

Monday, February 27, 2023

Durable goods orders: more deceleration, still no recession


 - by New Deal democrat


I normally don’t pay too much attention to durable goods orders. That’s because they are very noisy. They don’t always turn down in advance of a recession (see 2007-08), although they may at least stall, and there are a number of false positives as well (see 2016) as shown in the graph below showing up until the pandemic:


But in 2022 they were one of the last short leading indicators to be positive. As late as November of last year I still rated them as a “positive.”

That has changed somewhat in the past several months. With the exception of December, durable goods orders have made no progress at all since last June, and while “core” durable goods orders excluding aircraft (Boeing) and defense increased in January, it remains below the level of last August, and has generally been flat since then as well:


A YoY view shows that both measures of durable goods are decelerating, but neither are have deteriorated as much as before the last 3 recessions:


But if they continue at their current rate of deceleration, core capital goods will be negative YoY by about mid year.

This has been a dominant theme in the data - especially some short leading and coincident indicators - for the past number of months: continuing deceleration, but not turning negative yet. 

Saturday, February 25, 2023

Weekly Indicators for February 20 - 24 at Seeking Alpha


 - by New Deal democrat


My Weekly Indicators post is up at Seeking Alpha.


While several of the important coincident indicators continue to hover just above neutrality, importantly neither long term Treasury yields nor corporate bond yields nor mortgage rates have made a new high in the past 4 months, and historically that has been significant.


As usual, clicking over and reading will bring you up to the virtual moment as to the nowcast and the forecast for the economy, but reward me a little bit for putting it all together for you.

Friday, February 24, 2023

New home sales: a bright spot in the housing indicators


 - by New Deal democrat


New home sales are very noisy, and are heavily revised, which is why I pay more attention to single family housing permits. But they do have one important value: they are frequently the first housing indicator to turn at both tops and bottoms.

And it increasingly looks like new home sales have already made their bottom for this cycle. In January they rose a 45,000 annualized rate to 670,000. This is their second strong monthly advance in a row, and 127,000 above their low in July (blue in the graph below). This is largely a function of the lower mortgage rates we have seen in the past several months, shown in red, inverted, below:


Since mortgage rates have increased in the past few weeks, we’ll find out in the next month or two whether this positive trend in sales can be sustained.

Meanwhile, for the first time since before the pandemic the median price of a new home declined YoY, by -0.7% (gold in the graph below). Since prices are not seasonally adjusted this is the only valid way to look at them. For comparison purposes I also show sales (blue) YoY as well:


Prices follow sales with a lag. YoY sales peaked in 2020, with a secondary peak early in 2022. Prices YoY peaked in 2021 and the increases have been decelerating ever since, before finally turning negative last month.

The last time I looked at new home sales, several months ago, I noted that new home sales were “suggesting the [economic] downturn may not be that long (Fed willing, of course).” That continues to be true.

Strong upward revisions push real personal income to new highs, put 2 important coincident indicators firmly in expansion territory


 - by New Deal democrat


Almost all of the news in this morning’s release for personal income and spending for January was positive.


Nominally, personal income rose +0.6% and personal spending rose 1.8%. The deflator also rose +0.6%, making real personal income close to unchanged, and real spending (after rounding) up 1.1%. 

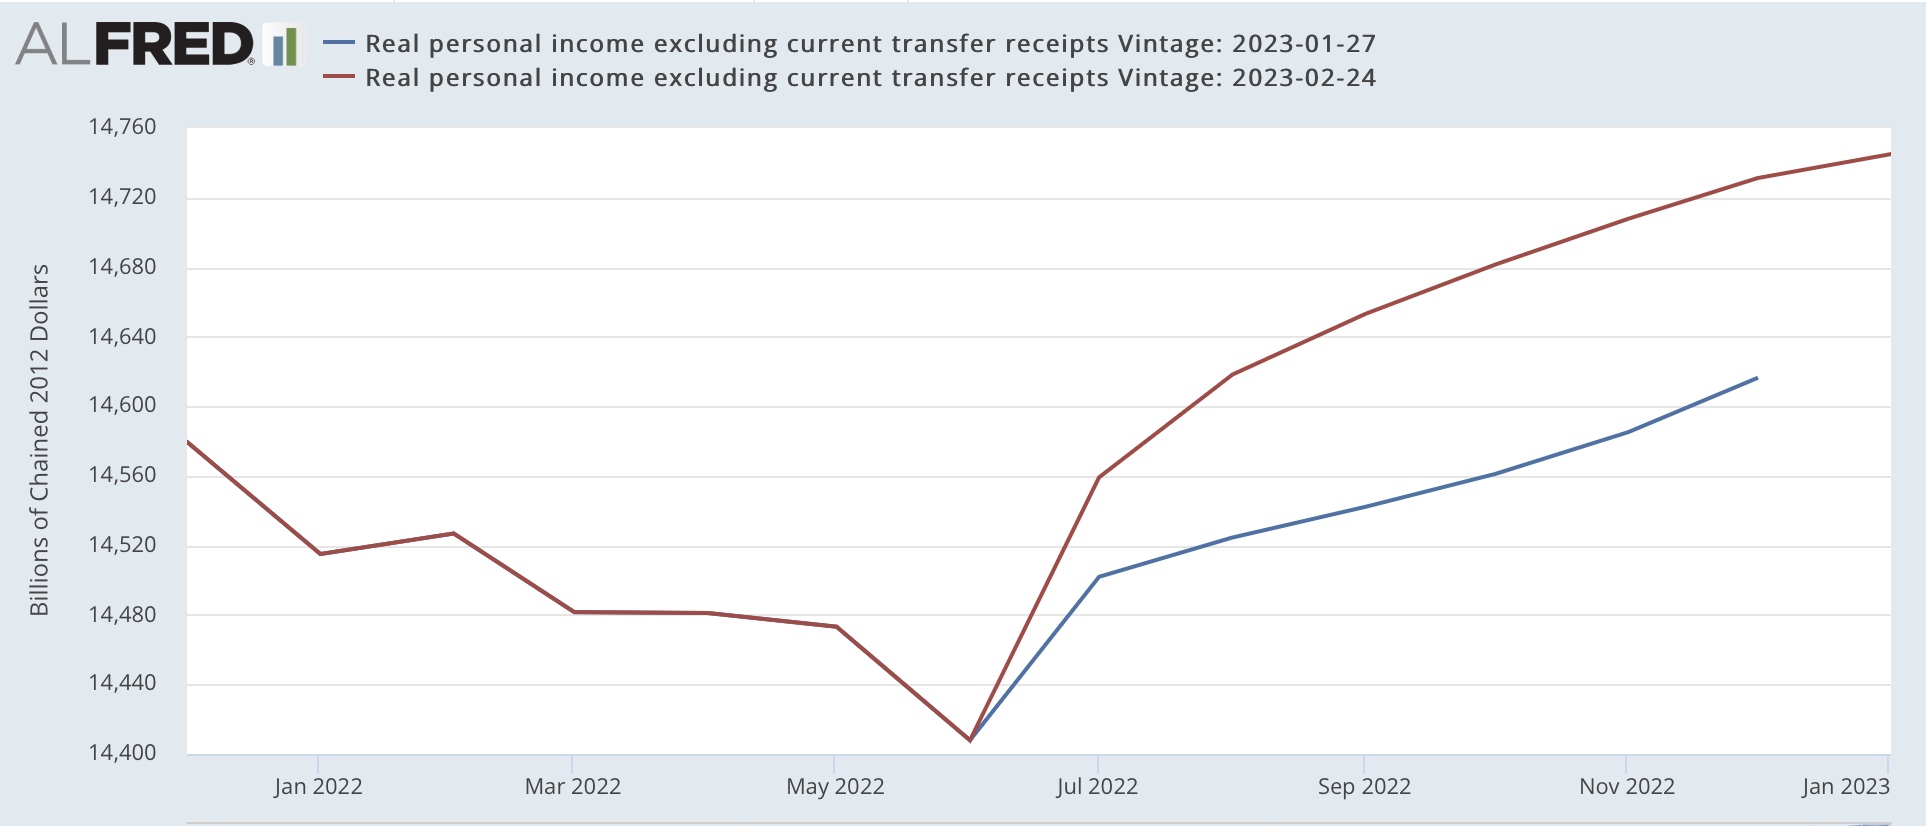
But that wasn’t the biggest news. There were major upward revisions to real personal income in the past 6 months. The below graphs show the former values (blue) vs. the current revisions (red):


What had looked like moderate growth in real personal income suddenly looks very strong (once again: a big decline in gas prices can work wonders for inflation-adjusted data!).

This affects one of the coincident indicators used by the NBER to calculate if a recession has begun, real personal income less transfer receipts:


Again, what looked like tepid growth or even a YoY stall now looks strong.

There were only minor revisions for the last several months to personal consumption expenditures, making December -0.2% lower than previously reported. Still, the big growth in January took real personal spending to its highest level ever. As I’ve previously noted, personal spending is like the opposite side of the transaction from real retail sales. Here’s what the monthly changes in each look like for the past 18 months:


Both had an extra dose of seasonality, as big declines in November and December were offset by big increases in January.

The good news also applied to real manufacturing and trade sales for December, which was updated this morning as well, jumping 1.5% for the month to an all time high except for March 2021 and January 2022:


This is also one of the coincident indicators tracked by the NBER, which means that both of them are at the moment firmly in expansion territory.

The only negative in this morning’s report was that the personal saving rate increased 0.2% to 4.7%:


While that’s good for individual households, due to the paradox of saving it is bad for the economy. When in the aggregate consumers save more, they spend less, which is a negative for the economy as a whole. As the above graph shows, typically as expansions go on, consumers save less. Then, as financial conditions like interest rates worsen, they tighten their belts and save more. That’s what we are seeing now.  

Thursday, February 23, 2023

The “gold standard” of jobs data shows a strong rebound in Q3 2022


 - by New Deal democrat


The preliminary estimate for the Q3 2022 QCEW was released yesterday. Although the monthly nonfarm payrolls report gets all the glory, it is only a survey. The QCEW is an actual census of the roughly 95% of all businesses that pay unemployment insurance - but is reported with about a 6 month delay, and is not seasonally adjusted.


The bottom line is that while Q2 was very weak, it was followed by a strong Q3. My take is essentially that shown on the dot plot below for the Philadelphia Fed, via Prof. Menzie Chinn at Econbrowser:


Just “how” weak and strong they are depends entirely on how one seasonally adjusts. Generally speaking, June was extremely weak, only better than 2009 since the turn of the Millennium, while July was extremely strong only weaker than 2020 and 2021. The two months together are also stronger than any year since 2001 except for 2020 and 2021. More on that below.

But first, here is my big problem: I continue to be concerned about why the QCEW, which is the gold standard, is so consistently below the YoY% growth comparisons in the CES survey for an entire year (so far) beginning in September 2021. 

Here is the YoY% change in the QCEW monthly beginning in 2020:


And here is the same data for private nonfarm payrolls:


As I wrote above, note that in September 2021 the YoY% change in the QCEW is 4.8%, while that for nonfarm payrolls is 4.9%. That’s no big deal, but the overperformance of the private nonfarm payroll survey continued to intensify all through 2022 until in June there was a 1.3% divergence, with the QCEW only up 4.0% YoY, but private nonfarm payrolls up 5.3%. That continued through the latest QCEW data for the Third quarter of 2022.

Let’s see how various methods of seasonally adjusting affect the monthly data.

If I take CES seasonally adjusted data through March 2021 as gospel, and apply the QCEW YoY% growth rates starting with that, I get a Q2 that only adds 45,000 jobs in total, but then a roaring Q3 that adds 884k jobs in July, 750k in August, and 733k in September.

On the other hand, if I take the QCEW numbers for each month of Q3, compare with the closest matching QCEW numbers in the 20 previous years, and then average how the CES seasonally adjusted those numbers, I get +1.2-1.3M in July, but only about +175k in August and +150k in September. 

The first method gives me a seasonally adjusted CES # of +2,367,000 jobs added in Q3, while the second gives me only +1.7M jobs added. 

Finally, if I were to follow my rule of thumb for non-seasonally adjusted data, which is that a decline of 50% or more in the growth rate within 12 months means that the data has actually turned negative, it shows that both April (5.0% vs. 11.7% in 2021) and May (4.7% vs. 9.7%) probably had actual job losses, followed by a recovery afterward.

The big discrepancy between the two measures may be an issue of very strong solo proprietor new business formations (since the self-employed don’t pay unemployment insurance), but the Census Bureau really ought to address this ongoing issue.

Initial claims continue recent excellent streak


 - by New Deal democrat


Initial jobless claims continued their recent excellent reports, as there were only 192,000 new claims, down -3,000 from the week before, and close to their 50+ year lows of last March and April. The 4 week average increased 1,500 to 191,250, still an excellent number. Continuing claims, with a one week delay, declined -37,000 to 1,654,000, still in their slightly elevated range that started in November:


On a YoY basis, contnuing claims were slightly higher, while initial claims were slightly lower:


Remember, I do not believe there is any recession signal until initial claims on a 4 week moving average basis are at least 10% higher YoY.

The almost complete lack of layoffs remains one of the two biggest signals (along with near-record housing units under construction) contra any near-term recession.


Wednesday, February 22, 2023

Consumption leads jobs: a comprehensive update


 - by New Deal democrat


Yesterday I encountered a post on Seeking Alpha from the chief economist for a major trading platform, who probably makes in a week the amount I pocket in an entire year from my writing, who wrote:


“if one loses one’s job, one likely spends less. If one witnesses colleagues lose their jobs, one may cut back on spending. If extended family members lose their jobs, spending may be reduced.”

Here’s their accompanying graph:


Note the heading: “consumption is still growing because jobs are expanding” This is an argument I encountered many times during the Great Recession: as more an more jobs were lost, it was a sure thing that people would spend less and less.

Except for one thing: in the aggregate, it’s completely wrong. Generally speaking, in recessions prices go down more (or go up less slowly) than wages. Interest rates paid for things like mortgages and car loans go down. As a result, even as jobs are still being shed, bargains simply become compelling for some people who are employed, and they go out and spend more. Similarly, even as jobs continue to get added to expanding economies, if prices and interest rates rise more than wages (as they typically do late in expansions), consumers in the aggregate start to cut back.

In short, it is the changes in consumption that lead to the change in employment, as sales growth or shortfalls lead employers to amplify or trim their hiring and firing. 

Even shorter: consumption leads employment, not visa versa.

Since I haven’t run the graphs in support of this relationship in quite a while, let me re-post the evidence.

Here is a graph, going back 75 years through 2019, of the YoY% change in real retail sales (blue, /2 for scale) vs nonfarm payrolls (red), averaged quarterly:


While there’s not an exact 1:1 correspondence, the graphic evidence is simply compelling that the peaks and troughs in consumption YoY lead peak growth or losses in employment by one or more quarters. For 75 years.

Because the pandemic year of 2020 would make everything else before it look like squiggles, here’s the update since then:


The spending came first; then the job growth. Then consumer spending YoY went flat, and job growth has been decelerating.

Which leads me to a criticism of a second article I read yesterday, by Lance Roberts, formerly (if I recall correctly) of Time Magazine, a conservative commentator who is often my poster child for “someone is wrong on the internet.” Except most of his current argument - that the Fed is very unlikely to give us a “soft landing” - is correct. After noting that both sales growth and jobs growth have been decelerating, he wrote:

“While most of the jobs recovery was hiring back employees that were let go, the surge in stimulus-fueled retail sales will ultimately revert to employment growth. The reason is that people can ultimately only spend what they earn. As shown, the disconnect between retail sales and employment is unsustainable.”

I agree. Where I take issue is his graph in accompaniment to the point, shown below:


Note the differing left/right scales. The graph tends to imply a 1:1 relationship between retail sales growth and jobs growth. But that’s misleading, because as I’ve shown above real retail spending has tended to increase or decrease by twice the change in jobs. So let me show you the data since the modern retail sales series started in 1992 another way.

The below graph norms both real retail sales and nonfarm payrolls to 100 as of roughly mid-cycle for the 1990s. That’s because, as an outgrowth of the leading/lagging relationship, sales grow relatively more quickly than jobs earlier in expansions, and less quickly later. Then I do a little mathematical trick: dividing sales by 2 and adding 50 to result to arrive at advances and declines in real sales that equal changing at half the rate of jobs:


Note that the “shortfall” between job growth and retail sales growth appears considerably smaller than in Roberts’ graph. Here’s the close-up:


In the past 2.5 years, job growth has made up about 8/9’s of what it is needed for the relationship to return to trend. So, to be clear, I agree with Roberts’ assertion that “the surge in  . . . retail sales will ultimately revert to jobs growth,” or more accurately, the two series will converge. 

Exactly where and when that convergence will happen, we don’t know.

The long leading forecast through year end 2023 at Seeking Alpha


 - by New Deal democrat

Normally in late January I update my top-line long leading forecast for the entire year. A little late this year, it is now up at Seeking Alpha.

If you follow my updates on the leading indicators, the result isn’t very surprising. The twist is that recessions are almost always much shorter than expansions, so the long leading indicators turn up on a shorter time span than they turn down in advance of recessions.

Anyway, clicking over and reading will tell you how I expect the trend for the remainder of this year to unfold, and bring me a little reward for my efforts.

Tuesday, February 21, 2023

Existing home sales and prices decline further. BUT . . .


 - by New Deal democrat


Even though existing home sales make up about 90% of the total market, they have much less economic impact than new home construction. They are best used to confirm trends. In January they continued to confirm that sales have continued to decline, and prices, which follow sales with a lag, have joined in.

January sales declined another -0.7% to 4.2 million annualized, a -37% YoY decline from a peak of 6.34M one year ago:


The median price of an existing home, which isn’t seasonally adjusted, also declined further to $359,000, up only 1.3% YoY from 2022’s $354,300. Since my rule of thumb for non-seasonally adjusted data is that the trend has turned when the YoY increase is less than 1/2 of its maximum increase in the past 12 months, which was the +17.1% growth of 12 months ago, needless to say this confirms that prices have turned down in a significant way:


The decline in sales, as well as housing permits and starts, is certainly consistent with a recession - which has normally coincided with a decline of about 20% or more. As I’ve pointed out several times already, what is “different *so far* this time” is that this hasn’t fed through into any significant decline in the backlog of authorized housing not yet started, or housing under construction:


Until housing under construction turns down substantially, housing is not exerting any significant downward pressure on the economy.

Saturday, February 18, 2023

Weekly Indicators for February 13 - 17 at Seeking Al;pha


 - by New Deal democrat


My Weekly Indicators post is up at Seeking Alpha.

There are two trends percolating under the surface. One trend is the continued slow decaying of growth in the coincident indicators. The other is the slow move towards turning neutral or positive among some of the long and even short leading indicators.

No forecast at this point, but I am beginning to suspect that, while there will be a recession, it will be relatively short and relatively mild.

As usual, clicking over and reading will bring you up to the virtual economic moment, and reward me a little bit for my efforts.

Friday, February 17, 2023

Real average wages and real aggregate payrolls for nonsupervisory workers through January


 - by New Deal democrat


With no new data today, to close out the week let’s update real average wages and aggregate payrolls for nonsupervisory workers. This is the best way, based on monthly data, to see how average Americans are doing financially.


While average nonsupervisory wages increased 0.2% in January, consumer inflation increased more, at 0.5%, meaning that real average hourly wages decreased -0.3%. They are down -2.1% since December 2020:


Much of the decline in real wages has had to do with the big increase in gas prices during the first half of 2022.

If real hourly wages have declined, that has been made up by the powerful increase in the number of jobs worked. As a result, nominal aggregate payrolls are up 22.8% since December 2020:


Adjusting for inflation, aggregate payrolls for nonsupervisory workers are still up 7.1%:


In the past, when real aggregate nonsupervisory wages have not risen for a year, that has been a reliable recession signal - which makes perfect sense, since if most working Americans’ financial situations have stalled out, they are likely to rein in spending, if not actually cut back. With the substantial upward revisions to nonfarm payrolls for 2022, as can be seen above that situation has improved, and real aggregate payrolls have rebounded to being up almost 3% YoY as of January:


Thursday, February 16, 2023

Slight decline in housing construction: the negative actual economic impact has not yet begun


 - by New Deal democrat


Housing permits (gold) increased slightly in January from their December lows, while the more volatile housing starts (blue) declined again. The much less volatile single family permits (red, right scale) also declined again to a new post-pandemic low:


This is a very important long leading indicator, and shows that coming misery in the economy due to housing sector is nowhere near bottoming out.

But, as I wrote on Monday, the most important metric in the entire economy right now is probably housing units under construction, which is the “real” economic impact of the industry. Here there was a very slight (less than 1%) decline from a revised peak in October:


The bottom line is that the actual *economic* downturn in housing has not begun yet.

Initial claims: nobody is getting laid off, but slight weakness in continuing claims compared with 2022


 - by New Deal democrat

Initial claims remained below 200,000 at 195,000, while the 4 week average increased very slightly to 189,500. Continuing claims increased to 1,696,000, the third highest number in over a year:


Holiday seasonality has ended. It continues to be the case that almost nobody is getting laid off. Very slightly on the other hand, the relatively elevated number of continuing claims suggests a little weakness compared with 2022.

Wednesday, February 15, 2023

Despite sharp rebounds in retail sales and manufacturing production, both metrics are on the cusp of being recessionary


 - by New Deal democrat


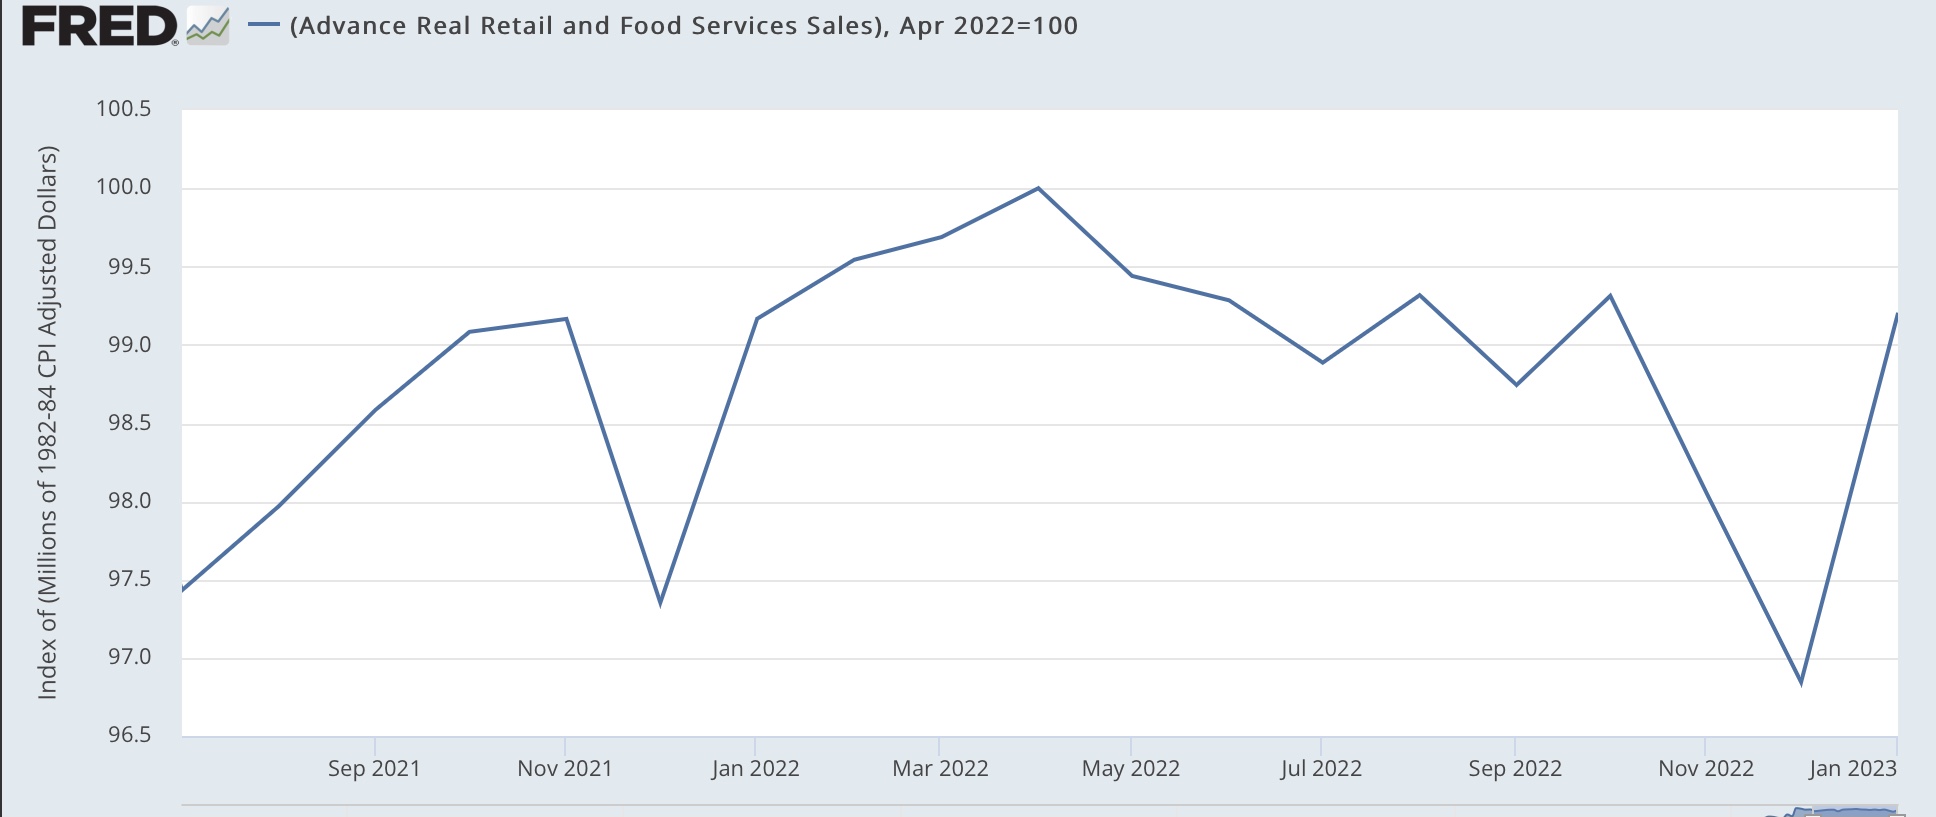
Retail sales for January rose strongly in January,up 30% in nominal terms and up 2.4% after accounting for inflation. While that looks great, it only reverses the two downward readings of November and December, and is similar to the reversal last January. This makes me think that there is unresolved Holiday seasonality at work. In any event, real retail sales remain -0.8% below their April 2022 peak:


Further, as I’ve noted many times, real retail sales going negative YoY, at least for more than one or two months, has been an excellent harbinger of incoming recession. In fact, the relationship goes back about 75 years. Here is the period from 1993 through 2019::


While I’ve discounted the negative numbers from spring 2021 because of distortions due to comparisons with the spring 2021 stimulus months, there is no distortion in those of the last few months since September. Here’s the last 18 months:


For January, YoY retail sales were up less than 0.1%, rounding to unchanged. The last 5 months have been on the cusp of recessionary readings. Further, as the red line implies, nonfarm payrolls should continue to decelerate, despite January’s strong jobs number.

The report on industrial production, the King of Coincident Indicators, was not very different. Total production was unchanged, and is -1.6% below its October peak. Manufacturing production rose a strong 1.0%, but nevertheless is -2.0% below its April peak:


Industrial production, if it were taken by itself, would suggest that we are already in a shallow recession.