- by New Deal democrat
New home sales are very noisy, and are heavily revised, which is why I pay more attention to single family housing permits. But they do have one important value: they are frequently the first housing indicator to turn at both tops and bottoms.
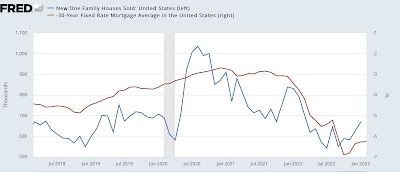
And it increasingly looks like new home sales have already made their bottom for this cycle. In January they rose a 45,000 annualized rate to 670,000. This is their second strong monthly advance in a row, and 127,000 above their low in July (blue in the graph below). This is largely a function of the lower mortgage rates we have seen in the past several months, shown in red, inverted, below:
Since mortgage rates have increased in the past few weeks, we’ll find out in the next month or two whether this positive trend in sales can be sustained.
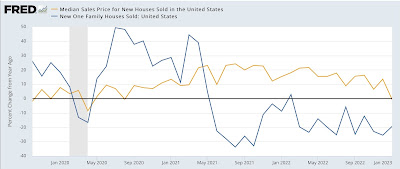
Meanwhile, for the first time since before the pandemic the median price of a new home declined YoY, by -0.7% (gold in the graph below). Since prices are not seasonally adjusted this is the only valid way to look at them. For comparison purposes I also show sales (blue) YoY as well:
Prices follow sales with a lag. YoY sales peaked in 2020, with a secondary peak early in 2022. Prices YoY peaked in 2021 and the increases have been decelerating ever since, before finally turning negative last month.
The last time I looked at new home sales, several months ago, I noted that new home sales were “suggesting the [economic] downturn may not be that long (Fed willing, of course).” That continues to be true.

