Tuesday, September 14, 2010

Yesterday's Market


Let's start (again) with the Treasury market. Yesterday, the IEFs bounced off the 50 day EMA in a technical rebound, but did so on weaker volume. Also note the 10 day EMA crossed below the 20 day EMA.


Yesterday the IWMS were the real start, moving 2.48%. This indicates that risk capital was moving into the market. Prices gapped higher at the open (a), consolidated (b) and then moved higher in two more moves (c and d). Prices then consolidated for the late morning and early afternoon before making one last move higher (f) on increasing volume (g). Prices closed near their daily highs, indicating traders were willing to hold positions overnight -- a bullish sign.


The dollar is currently consolidating in a downward sloping pennant pattern (a).


But note the EMA picture is fairly bearish -- prices are below the 200 day EMA, all the shorter EMAs are moving lower and the shorter EMAs are below the longer EMAs (a). On the positive side, prices are gravitating around the 200 day EMA, indicating the market is still trying to make a bullish or bearish move.

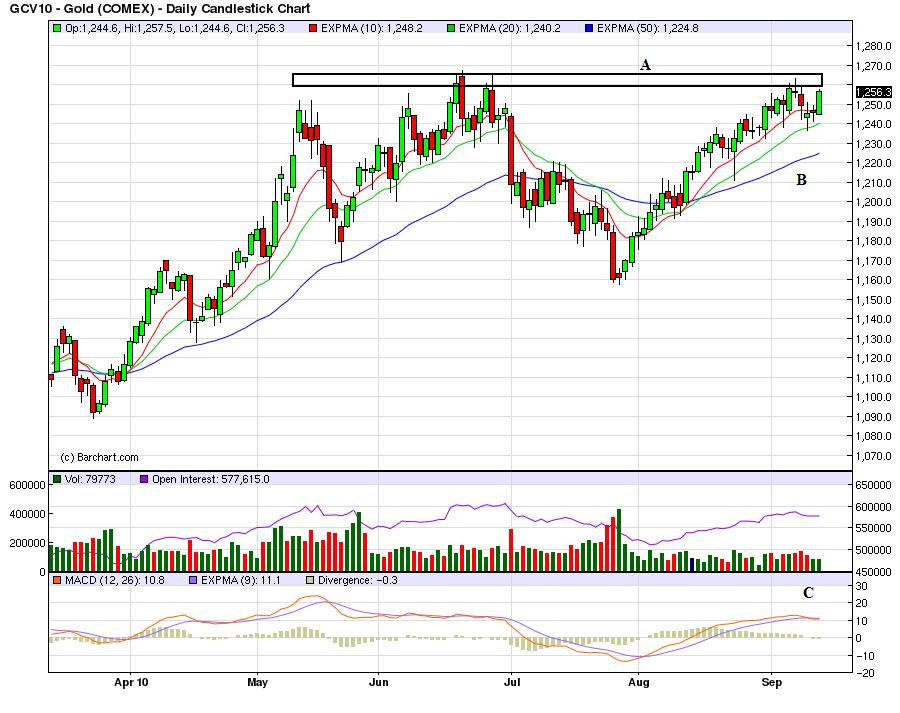
Gold is again hitting resistance in the (A) area. However, the EMAs are still bullish, but momentum is starting to stall (C).


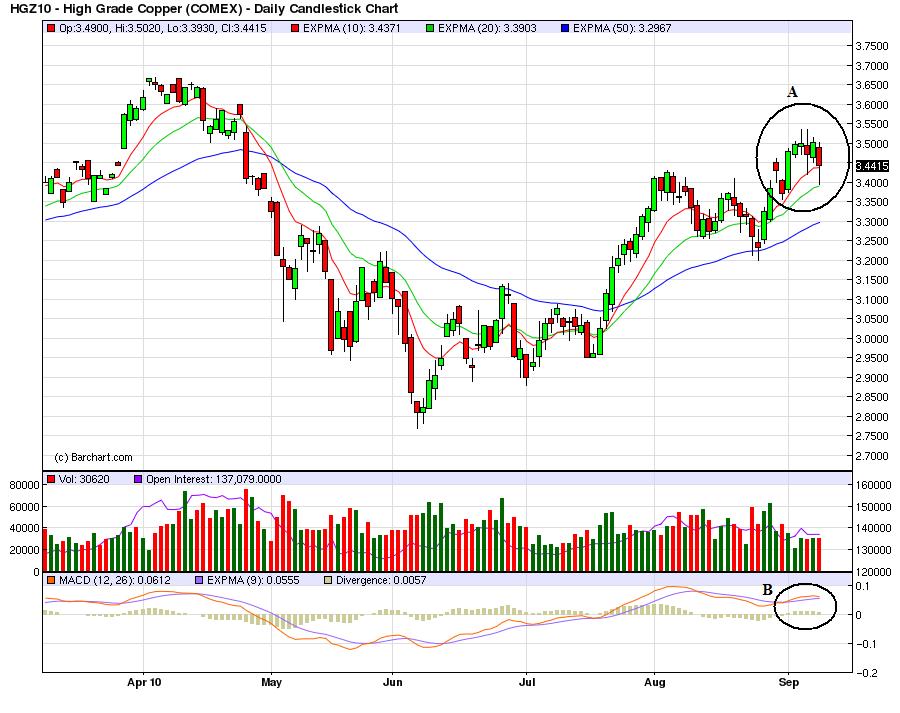
Copper is still in an uptrend as denoted by the EMAs (A). Prices have consolidated several times in downward sloping pennant patterns (B and C). Momentum is weak (D).

S&P 500 at 1122

Yesterday the S&P 500 closed at 1122.....


The first time it hit 1122 was on 4/03/1998....at that time

the 12 month trailing GAAP earnings was 44.09


S&P 500 GAAP earnings yield 3.93%

Moody's Baa Bond Yield 7.21%


Later on...on 1/05/2004 the S&P 500 closed at the same level 1122....at that time

the 12 month trailing GAAP earnings was 54.69


S&P 500 GAAP earnings yield 4.87%

Moody's Baa Bond Yield 6.68%


Yesterday we closed at 1122....the 12 month trailing GAAP earnings is 67.10 (as of the close

of the 2nd qtr)*


S&P 500 GAAP earnings yield 5.98%

Moody's Baa Bond Yield 5.75%


* This is the estimate from Standard and Poors and it should be on the button because 496 of

the 500 companies have reported.

Monday, September 13, 2010

Philly Fed Coincident and Leading State Indexes


From the Philly Fed


Postponable Purchases

From Bonddad: Brodero has been commenting here for some time. I have always been impressed with his insights and asked him to post regularly. He has graciously accepted my invitation, so expect to see his posts from now on.


For what it is worth....


Postponable Purchases are essentially Housing,spending on durable goods such as cars and

business investment in equipment and software. Here are a few facts....


Postponable Purchases to Gross Domestic income is currently 17%.The 40 year average for this ratio is 21%. Interestingly Postponable Purchases exceeded the 21% level from 1995 to 2006 to a cumulative tune of 5.3 trillion.Since 2006 we have been below the 21% level to ( currently)

a cumulative tune of around 5.3 trillion. Postponable Purchases total today at 2.455 trillion. 1.074 trillion durable goods,1.023 trillion business investment and 358 billion residential investment. Gross Domestic Income is 14.433 trillion as of the second quarter.

Different Opinions on US Growth

From today's WSJ:

The global recovery is still on track, but it's looking increasingly likely to be a long slog for much of the developed world.

Just over a year after the recovery started, its initial vigor has abruptly subsided, thrusting the world into a new period of uncertainty. Hopes of a U.S.-led recovery have faded as American consumers retrench. Bursts of growth in Japan and Germany are waning or expected to do so. China and other big developing nations are still growing strongly, but at a slower rate than they were not long ago.

"We were waiting for the second stage of the rocket, and it just fizzled out," says Ethan Harris, head of developed economics research at Bank of America Merrill Lynch in New York.

.....

Here are three scenarios for the global economy over the coming year:

Feeble Growth

In recent weeks, data from around the world reveal a growth downshift. Companies that had been rushing to restock their inventories are now ordering only what they need to meet existing demand, affecting the entire global supply chain.

.....

Bruce Kasman, chief economist at J.P. Morgan Chase, now expects the world economy to grow at an annualized, inflation-adjusted rate of 2.5% in the second half and 3.0% next year, down from his April estimates of 3.5% and 3.4%. That growth, he says, would come mainly from emerging markets, which would grow at a rate of almost 6% in 2011, while the developed world would chug along at 2%—not enough to make a meaningful dent in unemployment.

The subpar growth could last much longer in countries such as the U.S. and U.K., where consumers are struggling to pare debts.

Double Dip

Adverse events in finance or politics could turn anemic growth into renewed recession.

.....

A prime candidate is the return of the euro zone's public-debt crisis. Recent jumps in Irish, Greek and Portuguese bond yields suggest investors aren't convinced the crisis is over, despite European governments' creation of a €750 billion ($953 billion) bailout fund for struggling euro members.

In a worst-case scenario, renewed turmoil in government bonds could undermine confidence in banks and refocus investors' concerns on financial strains facing other countries, including the U.S. and Japan.

An Upside Surprise

Economists see an upside surprise as the least likely scenario. There are two main ways a renewed growth surge could happen: one led by the U.S., another more desirable one led by the rest of the world.

The U.S. has ample resources to restimulate the global recovery. U.S. companies are sitting on some $1.8 trillion in cash—the highest level, as a share of their total assets, since 1963. If and when uncertainties over income taxes, health care and government policy clear up, companies could grow confident enough to deploy that cash to hire workers and invest in new projects. That, in turn, could inspire U.S. consumers to return to the malls.

"The amount of cash that corporate America has is astonishing," says Jim O'Neill, head of global economics research at Goldman Sachs in London. "If they put that to work, then off we go."

A recovery led by U.S. consumer spending, though, likely would widen the U.S. trade deficit and, thus, increase U.S. borrowing from abroad—an imbalance many economists believe contributed to the global financial crisis. Even with U.S. consumers in the doldrums, the trade deficit grew at an annualized rate of 27% in the three months ending July.

Paradoxically, a weak U.S. could actually benefit the world economy. As the Federal Reserve holds U.S. interest rates low to support growth, it puts pressure on central bankers around the world to do the same. This is particularly true in developing economies that try to maintain a constant exchange rate to the dollar.

Let's look at the scenarios

1.) Slow growth is by far the most likely. The US gets 70% of its growth from consumer spending. Currently, the US consumer is allocating resources between spending and paying down debt. As such, consumer spending has been growing at a quarter to quarter growth rate of about 2%. We've seen some contributions from other areas of the economy such as inventory restocking, exports growth and some capital investment. There is little reason to think this current situation will change in the near future.

2.) Notice that a double dip recession would be caused by an outside, unexpected event, not a maintenance of the current economic path. Also note that as Mr. Roach says shocks do happen all the time, but no, they usually no not lead to imminent collapse even in weak economies. For example, the US just had a horrendous oil spill that probably hurt growth in the second quarter. Yet the US economy is still growing. In addition, we just had a shock in the world grain markets from a spike in wheat prices that the economy absorbed fairly well. Finally, I don't think the data supports a double-dip conclusion, especially after looking that the recent Beige Book in detail (which I started last week and will finish later this week).

3.) Why would businesses invest right now? There is a a boatload of excess capacity in both capital and human resource assets. There is no reason to open their wallets. And consumers are still paying down debt; they are not going to increase their spending beyond their current pace.


Stocks, Bonds and "Dumb Money" - the Message of the Yield Gap

- by New Deal democrat

On Friday, I wrote that Main Street was still the "dumb money" because, after having bought stocks with wild abandon in the late 1900s through the early part of the last decade -- just as the historic bull market hit its peak -- beginning in 2008 they were pulling out of stocks and piling into bonds, a trend that continues and if anything has amplified this year.

I have no doubt whatsoever that in the aggregate, small investors will continue to pull out of stocks until well after the next bull market has begun, whenever that may be. If you don't believe me that this is the case, then consider the following from Saint John Bogle, the founder of Vanguard Funds:
from 1982 to 2002, a period when the market averaged over 12.75%, the average investor only earned 3.5%. That is like paying an 8% load EVERY SINGLE YEAR! Why? Because investors buy high high, sell low, chase returns, and invest in expensive products with high annual expenses.
Human nature has not changed in the last 8 years. Which leads me to follow up with today's topic.

There is another measure of the relative preference for stocks and bonds that has some long term implications, and that is the Barron's stock/bond yield gap. This measures the difference between the dividend yield on stocks (specifically the DJIA, but the S&P 500 can also be used) and best-grade corporate bonds (although the AAA bond index can also be substituted). Below I reproduce this graph for the last 76 years.

As an initial note, you will see that formerly the gap was positive, meaning that investors demanded higher dividends from stocks than interest rates on bonds, due to the increased risks associated with stock ownership. After world war 2, due largely to the differing tax treatment of capital gains vs. interest and dividends, favoring the former as opposed to the latter, dividend payments decreased over the long term, and the series has been persistently negative, meaning that bond interest rates exceeded stock dividends.

Nevertheless, there are some long term trends having to do with inflation, disinflation, and perceived risk. And, specifically drawing your attention to perceived risk, note that this year the yield gap has shrunk to its lowest level, save for 1978, in over 40 years, as shown in the graph below:


As of last week, this gap was 2.27%, with the DJIA yielding 2.69% and best grade bonds yielding 4.96%. (the S&P was yielding 2.09% vs. 4.39% for AAA bonds, a difference of 2.30%).

This means that investors were willing to be satisfied with a mere 2.27% more in annual interest in order to achieve the perceived safety of their principal from high grade bonds vs. blue chip stocks. Put another way, your average investor is so wary of stocks that s/he thinks that the value of blue chip stocks in the near future will appreciate less than 2.27% a year! Contrast that with a decade ago, when the yield gap of ~6% indicated that investors thought stocks would appreciate by at least that much on an annual basis -- OOPS!!!

Let's compare the yield on the S&P 500 with the inflation rate and other interest rates.

In the first place, consumer price inflation is currently running at 1.3%. It has not run above 2.5% since the oil price spike of early 2008 -- and there is zero, zilch, nada, NO prospect of sharply increased inflation in the near future. So stocks are paying dividends that are already in excess of the inflation rate and have been since the 2008 crash.

According to Barron's, the highest yielding money market fund is paying 1.25%.
A 5 year treasury bond is paying 1.41%
The highest 2 1/2 year CD is paying 1.96%.
A 7 year treasury bond is paying 2.02%.

The annual dividend yield on the S&P 500 exceeds all of these.

Only 5 year CD's at 2.90%, 10 year treasuries at 2.59%, AAA bonds at 4.39%, and BAA bonds at 5.59% exceed this dividend yield.

In other words, you are being paid nearly 1% over inflation by blue chip stocks - and more than most bonds - simply for waiting for better capital appreciation -- capital appreciation that bonds are not going to deliver.

But what about risk? Well, risk will either result in higher inflation or in deflation. But how will bonds perform then? If there is higher inflation, the price of bonds will decline, and persons holding bonds will find that the current low interest payments mean slow confiscation of principal. If there is a catastrophic deflation, then bonds too will blow up, just as they did during the great depression and also during the 1938 recession -- so principal will be lost in that scenario as well. In short, if stocks fail, so will bonds.

But what if stocks DO appreciate? If it is accompanied by inflation, once again bond prices will fall and low interest rates will mean slow confiscation of principal. If there is trivial inflation or trivial deflation (price stability), then bonds will deliver 2%-5% depending on the type of bond, and will fail to deliver any principal appreciation, in contrast to stocks. So if stocks appreciate, bonds will *not* follow.

In other words, the risk/reward ratio is assymetric between stocks and bonds at this yield difference. Risks are similar, but reward scenarios strongly favor stocks.

It is a little known fact that, had you invested in a 30 year bond in 1982 at the dawn of the greatest stock bull run of all time, and reinvested dividends and interest payments accordingly, in 2000 you would have made slightly more gross profit in bonds than in stocks -- although the tax treatment was vastly different. In the last 10 years, bonds have strongly outperformed stocks, as interest rates have continued to fall in the face of stagnant or declining stock prices.

There is a very good chance that the next 10-15 years are going to see stocks a vastly superior choice compared with bonds, due to the assymetrical risk/reward scenario I have set forth above. (For those who are interested, this means that we are beginning to see the outlines of the change in Kondratieff seasons that will take place in the next 5-10 years).

In other words, a long term investor would want to seriously consider gradually changing their asset allocation away from bonds and into stocks -- exactly the opposite of what the small investor is doing.

Yesterday's Market


The treasury market has been a key reason for the stock market's lack of conviction. However, that may be about to change.


The 7-10 year area of the curve has pretty convincingly moved through key support line (a) -- see where prices are at point (b).


Depending on which trend line you use, the longer end of the curve has either moved though key support, or is sitting on key support.


In addition, TLT prices are sitting right near the 50 day EMA.


The underlying price/volume technicals for the IEF and TLT tell the same story. We're not seeing a mass exodus of dollars from either market; in fact, we're a slight increase in the amount of dollars flowing into both markets (a and b on bother charts). However, we are seeing momentum drop (c) in both markets.


Last week, the SPYs traded in two areas -- (a and b).


The SPYs are approaching a key resistance area (a).


However, neither the IWMs for IWCs are approaching key resistance areas. As such, I have to wonder about the strength of any SPY rally because we're not seeing a commensurate increase in the risk areas of the market.

Friday, September 10, 2010

Weekend Weimar and Beagle

It's that time of the week. We'll be back on Monday AM. Until then ....


Weekly Indicators: Hindenberg Contrary Omen edition

- by New Deal democrat

Well, so far the Hindenberg Omen isn't turning out to be such an oracle of truth, but instead might be termed the "Hindenberg put." A nice scary supply of b.s. made-up bearish indicators might be just what we need as we head into the ghost and goblin season.

This week in the monthly indicators we found out - well, actually, not much at all. The import/export data wasn't as bullish when placed in context, and the wholesale data is slightly bearish if they cut back on orders.

Now here's a look at high frequency weekly indicators. I started tracking these to gauge the staying power of the recovery. Recently they declined, but now seem to be bouncing back.

The Mortgage Bankers' Association reported that its Refinance Index decreased 3 percent from the previous week but is still at very high levels, while the seasonally adjusted Purchase Index increased 6% percent from one week before. Not only is refinance activity at very high rates, now purchase mortgage activity may be rebounding as well - this was the highest reading since early May.

The ICSC reported same store sales for the week ending September 5 deckubed -0.4% week over week, and were up only 1.8% vs. a year ago. This is the weakest YoY performance in several months. Shoppertrak did not report weekly numbers, but said that for the month of August, sales were up 3.7% vs. 2009.

Gas prices reamined steady at $2.68 a gallon, and at 9.263 were virtually identical to one year ago. Meanwhile record gasoline stocks continue to be recorded.

The BLS reported 451,000 new jobless claims, over 50,000 less than just 3 weeks ago. Last week I asked, "With the census mainly unwound, and local school years having started, will we see declines in the weeks ahead?" Well, the very preliminary, one-data-point answer is "yes."

Railfax continued to bounce back strongly, showing substantial growth vs. last year in all 4 sectors: Cyclical, intermodal, baseline, and total traffic all continued to move significantly up, and also up at a more rapid clip than a year ago. With the exception of timber and metals, all sectors are essentially equal to or well ahead of their rates not just from last year, but from 2008 as well.

The American Staffing Association reported that for the week ending August 29, temporary and contract employment increased 1.3% to 97.0, like rail traffic not just exceedin 2009, but now exceeding 2008 as well.

M1 increased +2.0% in the last week, about 1.5% month over month, and up 5.0% YoY, so “real M1” is up 3.7%. M2 increased 0.3% in the last week, +0.56% month over month, and up 2.8% YoY, so “real M2” is up 1.5%. Real M1 remains a positive sign, while real M2 continues to counsel caution - although real M2 seems to be slowly clawing back upward.

Weekly BAA commercial bond rates rose for the first time in many weeks, up .08% more last week to 5.59%. This is,needless to say, still a very low rate.

Five days into September, the Daily Treasury Statement was up $42.0 B vs. $38.2 B a year ago, a gain of ~10%. For the last 20 reporting days, we are up $125.1 B vs. $118.5 B a year ago, for a gain of ~5.5%.

This is now the third week in a row that almost all of the weekly indicators have been bullish. The May-August declines in housing starts will continue to ripple through the rest of the economy, but otherwise, is the double dippette done?

Have a nice weekend!

The Beige Book, Part II

Let's continue our look at the Beige Book by focusing on manufacturing.

Manufacturing activity expanded further on balance, although the pace of growth appeared to be slower than earlier in the year. Most Districts reported further gains in production activity and sales across a broad spectrum of manufacturing industries. However, New York, Richmond, Atlanta, and Chicago noted that the overall pace of growth slowed, while Philadelphia, Cleveland, and Kansas City reported that demand softened compared with the previous reporting period. Recent weakness was most notable for construction-related products, according to reports from Cleveland, Richmond, Chicago, Dallas, and San Francisco. By contrast, orders and activity edged up for makers of steel and other metals in Cleveland, Chicago, and St. Louis, propelled largely by demand from the transportation equipment industry. Activity among automobile makers and parts suppliers rose further in Richmond and held steady in Chicago, although it dropped temporarily in Cleveland as a result of factory retooling. Manufacturing activity for commercial aircraft was steady in the Dallas and San Francisco Districts, although a contact in Boston reported that the industry's recovery has been slow. In the Boston and San Francisco Districts, makers of semiconductors and other high-tech products saw further sales gains, while Dallas noted that demand held largely steady at existing high levels. Among nondurable products, food processing stepped up in Philadelphia and San Francisco. Demand conditions for paper products were mixed, with increased sales and expansion plans noted in Minneapolis and St. Louis but flat to declining sales identified in Dallas. Export demand was an important contributor to healthy conditions in the manufacturing sector according to Boston and Chicago, notably for heavy machinery and autos.

Reports on capacity utilization were mixed. Manufacturers of high-tech products have been operating near maximum capacity of late, although this partly reflects a substantial decline in industry-wide capacity over the past three years, as noted by Dallas. More generally, the majority of Cleveland's manufacturing contacts reported that capacity utilization remained below pre-recession levels. Capital spending plans for manufacturers and firms in other industries generally indicate little change or modest increases in coming months, based on reports from the Boston, Philadelphia, Cleveland, Chicago, Kansas City, and San Francisco Districts.

Before we look at the regional reports, here are some takeaways from the previous points.

1.) The weakness in the housing markets appears to be a prime reason for the recent drop in manufacturing numbers.

2.) Auto and semi manufacturing appears to be in good shape

3.) Paper is mixed. This is a manufacturing sector that applies to all manufacturers, as everybody uses paper in one form or another.

4.) Aircraft manufacturing is fair.

5.) Exports are a a big source of demand.

Let's look at the regional reports:

Boston: Nearly all manufacturing firms surveyed report favorable results for the second quarter. Demand is particularly strong at semiconductor and pharmaceutical firms. One respondent from a long-standing business describes the second quarter as their best ever. In contrast, a parts supplier for the aircraft industry says that demand has been slow to recover from the recession. Sales held steady in recent weeks among many contacted manufacturers; multiple respondents attribute recent demand to booming business in northern and western Europe. The same firms describe domestic sales as flat in comparison. In addition, several diversified manufacturers and one large domestic industrial manufacturer all note that sales leveled off in recent weeks relative to the first half of the year.

NY: Manufacturing firms in the District report some leveling off in conditions in July and August, after reporting fairly widespread improvement during the first half of the year. However, a sizable number of manufacturing contacts indicate that they are increasing employment.

Philly: Third District manufacturers reported slight decreases in shipments and new orders from July to August, on balance, as well as a decrease in order backlogs. Slower activity was reported in most of the major manufacturing sectors in the District. However, producers of wood products, food products, industrial materials, and measuring and testing equipment reported increased demand for their products.

Cleveland: Reports from District factories show that production levels were mainly steady or down slightly during the past six weeks. Changes in new orders mirrored those in output. Production was higher on a year-over-year basis, with several contacts citing double-digit increases. A large majority of respondents expect output will stay at current levels for the near term. Those anticipating a drop in production attributed it primarily to seasonal factors or the continuing slump in residential construction. Most steel producers and service centers reported that volume was stable or increasing. Shipments are being driven by energy-related, auto, and heavy equipment industries. Construction volume remains weak.

Richmond: District manufacturing activity continued to expand in late July and August, but some sources indicated a slowdown in demand over the last month. A chemical manufacturer commented that new equipment was being installed at his company with the expectation that the economy would continue to grow. Moreover, a packaging manufacturer informed us that demand was stronger at his company, and a parts supplier indicated that raw material inventories had decreased and his suppliers were having a hard time keeping up with demand at his firm. He added that his company was working Saturdays to meet demand and that inventories of finished goods remained below desired levels. A majority of survey respondents reported that shipments, new orders, and employment continued to grow, but at a slower pace than a month ago. Some declines were reported; for example, a manufacturer of exterior doors for residential housing said that all activity had ground to a halt in the building products industry. He noted that the slowdown started in May and continued through August.

Atlanta: Manufacturing contacts reported that overall activity was expanding, but at a slower pace than in the previous report. Fewer District manufacturers noted increases in new orders, and more said that orders were lower.

Chicago: Manufacturing production growth slowed from the previous reporting period. Contacts indicated it was difficult to gauge the extent of the recent softening as July and August, in general, tend to be slower. In a positive sign, several metals manufacturers indicated that orders and inquiries had begun to firm in recent weeks. Manufacturers of construction materials and household goods reported declines in shipments, with the exception of household appliances where inventory continued to be rebuilt in the aftermath of the recent rebate programs.

St. Louis: Manufacturing activity has continued to increase since our previous report. Several manufacturers reported plans to open plants and expand operations in the near future, while a smaller number of contacts reported plans to close plants and reduce operations. Firms in the soap and cleaning compound, aerospace products and parts, glass products, motor vehicle parts, and primary metal manufacturing industries reported plans to open new facilities in the District and hire employees. Contacts in the food, engine, adhesive, and sanitary paper products manufacturing industries reported plans to expand existing facilities and operations. In contrast, firms in the furniture, hand tool, and power transmission equipment manufacturing industries announced plans to decrease operations and lay off workers.

Minneapolis: Manufacturing output was up since the last report. A July survey of purchasing managers by Creighton University (Omaha, Neb.) showed strong increases in manufacturing activity in Minnesota and South Dakota, and slight increases in North Dakota. A drainage pipe maker is opening a plant in South Dakota. In Minnesota, two new solar energy component manufacturing facilities are planned. In the Upper Peninsula of Michigan, a coated paper company noted an increase in orders over the past two months from earlier this year and last year.

KC: Manufacturing activity slowed in late July and August, while other business activity continued to expand. Factory production was flat compared to previous months, while shipments and new orders weakened. A producer of chemicals said distributors were only placing orders for product as needed and were unwilling to bring in inventory due to high levels of economic uncertainty.

Dallas: Most producers of construction-related materials--including brick, lumber, cement, glass and primary and fabricated metals--said conditions remained weak. Several respondents tied to housing construction said orders were especially low in July because of the vacuum created by the end of the tax credit. Contacts that produce products used in nonresidential construction noted most activity was related to public projects. Outlooks were slightly more pessimistic than in the last report, with several contacts expecting no turnaround until 2012. A primary metals producer that sells to transportation manufacturers was more upbeat and expects increased orders in coming months.

Manufacturers of high-tech products said demand held steady over the past six weeks. Growth in orders has leveled off in recent months after a replenishment of inventories earlier in the year that drove very strong growth. Most respondents characterize current order levels as good. Although inventories have increased, respondents said they are relatively lean and in some cases below desired levels. Several semiconductor contacts said that industry-wide capacity has fallen about 30 percent over the past three years and, even with growing capital expenditures, capacity utilization is likely to remain very high for the next two to three years. Outlooks were positive for the remainder of the year.

Paper manufacturers reported flat to declining sales over the past six weeks. Contacts said customers are very cautious about keeping inventories, due to pessimistic economic outlooks. Growth in demand for food products stalled since the last report. Respondents said they did not see the normal summer boost this year.

Non-defense aircraft manufacturers said orders held steady over the past six weeks and are above year-ago levels. Outlooks were cautiously optimistic. Trailer producers said demand had fallen as uncertainty about the national economy increased. Sales are expected to be slow through year-end.

Petrochemical producers were mostly optimistic, noting domestic orders were strong and growing. Export growth was positive but slower, as current prices were less competitive in Europe and Asia. The only reported weakness was for vinyl products used in housing and commercial construction. Refiners noted weaker conditions as seasonal gains in gasoline consumption did not materialize and distillate (diesel and heating oil) consumption slipped back. Contacts expect a decline in capacity utilization rates and refining runs due to weaker margins.

SF: District manufacturing activity generally continued to grow during the reporting period of mid-July through the end of August. Demand strengthened further for manufacturers of semiconductors and other technology products, with high levels of capacity utilization and balanced inventories noted. While new orders remained limited for makers of commercial aircraft and parts, extensive order backlogs kept production rates near capacity limits. Activity at petroleum refineries rose in response to increased demand, although inventories remained at elevated levels. Food manufacturers reported further growth in sales. By contrast, demand for wood products deteriorated, reportedly as a result of a slowdown in new home construction as well as residential repair and remodeling activity.

The above anecdotal information paint a picture of a slowing manufacturing sector.

Here are some charts of the various regions manufacturing indexes:

The Texas index is right around 0.
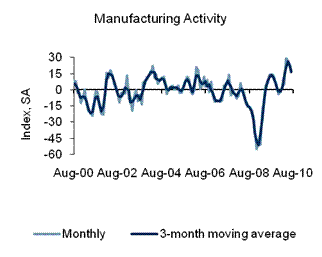

The Richmond Fed's index is still positive.


The Philly Fed Index printed negative last month for the first time in awhile.

The Empire State index (above) is still positive, but recent readings make it just so.


Also consider these macro level charts:

Overall industrial production continues to increase, as does


capacity utilization.

Finally, let's look at the latest ISM Manufacturing index. This was released on September 1 and the Beige Book covered the period before August 30.

"Manufacturing activity continued at a very positive rate in August as the PMI rose slightly when compared to July. In terms of month-over-month improvement, the Production and Employment Indexes experienced the greatest gains, while new orders continued to grow but at a slightly slower rate. August represents the 13th consecutive month of growth in U.S. manufacturing."

Eleven of the 18 manufacturing industries are reporting growth in August, in the following order: Primary Metals; Apparel, Leather & Allied Products; Transportation Equipment; Fabricated Metal Products; Electrical Equipment, Appliances & Components; Miscellaneous Manufacturing; Computer & Electronic Products; Paper Products; Chemical Products; Food, Beverage & Tobacco Products; and Printing & Related Support Activities. The five industries reporting contraction in August are: Furniture & Related Products; Petroleum & Coal Products; Nonmetallic Mineral Products; Plastics & Rubber Products; and Machinery.

What respondents are saying:

  • "Still experiencing intermittent delays in electronic components due to capacity and raw materials." (Electrical Equipment, Appliances & Components)
  • "International sales are especially strong. Domestic business is solid." (Chemical Products)
  • "Orders and business still strong." (Primary Metals)
  • "Order rate has slowed some. Supplier capacity in general seems to be improved." (Machinery)
  • "Large customers reducing pull rates for production." (Computer & Electronic Products)
And finally, here is the chart:


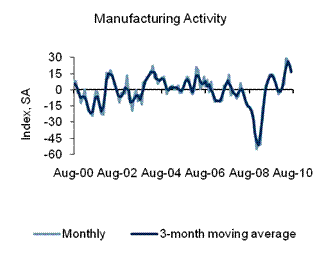
The short version is all the data points to a slowdown, largely caused by the housing situation. All other areas seem to be in decent shape.




Main Street is still the "Dumb Money"

- by New Deal democrat

As seasoned market watchers know, the price to earnings ratio, or p/e, is a measure of enthusiasm for stocks. It indicates how many dollars someone is willing to pay for a dollar of earnings. When stocks are out of favor, the p/e ratio might be in single digits. On the other hand, when stocks are a "can't lose" bet as they were in 1929 or the late 1990s, the p/e ratio might go to 18 or 20 or even higher.

Because this enthusiasm, or lack thereof, plays out over long periods of time - perhaps a generation or more - it takes a long time for the secular p/e ratio to cycle from bottom to top and visa versa.

This brings us to a series of graphs that indicate that we are reaching a watershed of sorts. First of all, from Crestmont Research via The Big Picture, here is a graph of the p/e of the S & P 500 over the last 100 years:


If past long term cycles repeat this time, there is a time in the very near future when once again, large cap stocks will be valued at single-digit multiples of their earnings.

With that in mind, now let's turn to Prof. James Hamilton of Econbrowser, citing Yale University Prof. Shiller, who
relates the current inflation-adjusted stock price to the previous ten-year-average of inflation-adjusted earnings. Despite the recent correction in stock prices, stocks still cost more today relative to the earnings you're buying than they did over most of the previous century and a half. We'd still need about another 17% decline in stock prices to get back to the historical average valuation multiple.

One reason that might be worth paying attention to is the following graph, whose blue line shows the annual rate of return you would have earned by buying stocks at any indicated date and holding on to them for the next decade. The green line (the price-earnings multiple) you would know at the indicated date, whereas the blue line (the return on stocks over the next decade) you wouldn't know until 10 years after the indicated date. What is pretty clear in hindsight is that those dates at which stocks were very richly valued turned out to be terrible times to buy:

Furthermore, Prof. Hamilton notes that
A buyer of stocks today is usually getting a higher immediate yield than on TIPS, in addition to prospects of future dividend growth. Just as they did in the 19th century, stocks as priced today should give you a significantly better return than bonds.


The short version of what these two items are telling us is:

(1) we are not far above the point where buying stocks has been an excellent investment over a 10 year period, and in particular compared with bonds; and

(2) if the present trend in p/e compression continues, as it has in previous secular cycles, that point will be reached very soon.

So what is the little guy, the Main Street small investor doing? Take a look at this graph:


As noted in this L.A. Times story, s/he is getting out of stocks in a big way, and piling into bonds that are currently yielding about 3%. The above graph shows yearly cash flows. While I can't show you their weekly graph, Barron's mutual fund cash flows show that investors have pulled $4.9 Billion a week out of stock mutual funds in the last four weeks, continuing similar outflows that have gone on for months - including $5.6 Billion in June, and $10.4 Billion in July. At the same time, they have put almost the exact same amount into bond funds. This means it is not a matter of hardship withdrawals due to economic distress.

In short, while undoubtedly some individuals are in distress, in the aggregate the public is pulling out of stocks and piling into bonds.

Please note, I'm not saying we are at a bottom, or that stocks are about to take off on a secular bull market. I am one who believes that we still have somewhere between 2-7 years left in a secular bear market. Last year's DJIA 6500 may or may not have been the absolute bottom, but if not there will be at least one more very bad day out there before the end of this secular market that will at very least rival that buying opportunity.

The bottom line is that the time is near when a single digit p/e coupled with absolute value closer to the bottom than the top of the last 10 years of asset prices will richly reward a disciplined program of long-term averaging into stocks. The small investor has chosen this exact moment to give up on stocks and chase bonds.

In other words, Main Street is still the "dumb money."

Yesterday's Market


Yesterday, prices gapped higher at the open (a), but quickly started to move lower (b) eventually finding support near the 20 minute EMA (c). this opening move lower was telegraphed by the declining momentum (e). After rising a bit, prices moved a touch lower and hugged the 20 minute EMA (d), eventually moving lower. However, momentum reversed (g) and prices moved higher near the close.


Prices for the SPY are still above the 200 day EMA (a).


The IEFs opened lower (a) and then moved lower for the rest of the day, hitting resistance at points b, c, d, and e.


Prices again moved below trend line (a) (see b). But most importantly, notice the 10 day EMA is very close of moving through the 20 day EMA (c).


In addition, the long end of the curve (a) is also below one trend line and the 10 day EMA is about to cross below the 20 day EMA.


Corn continues to move higher, breaking through key resistance (a) at point (b). the EMAs are very positive (C) and the MACD is moving higher (D).


Copper is hugging its EMAs (A), but the MACD indicates momentum may be weakening.


Sugar is in a clear bull market, printing some incredibly strong bars over the last few trading sessions (A). In addition, the EMAs are also extremely bullish (B) with the shorter above the longer and all moving higher.

Thursday, September 9, 2010

Why is the Economy Slowing Down?


Consider these charts:


MZM has actually contract on a year over year basis over about the last month. In addition:


Velocity has dropped as well. The speed of transactions has slowed.

The Beige Book, Part I

Yesterday, the Federal Reserve released the Beige Book. This is one of my favorite documents because it allows us to take a fairly regular, comprehensive look at the US economy. I consider it a, "you are here" report, as it tells us the status of a fairly broad range of economic numbers.

Let's start with consumer spending:

Reports on consumer spending were mixed but suggested a slight increase on balance. Most Districts reported that non-automotive retail sales rose compared with the previous reporting period or were above their levels from 12 months earlier. By contrast, Atlanta reported a decline in the level of sales, and Richmond noted that sales "sputtered" in August, while New York and Dallas reported that growth in retail sales slowed. Several Districts noted an emphasis on necessities and lower-priced goods. Boston reported that back-to-school purchases were focused on immediate needs; in Cleveland, consumers focused on "value-priced seasonal items;" and in St. Louis, Kansas City, and San Francisco, sales were relatively stronger for lower-priced items. Spending on big-ticket items such as expensive consumer electronics was weak according to Philadelphia, Richmond, and Dallas. Most Districts also reported that sales of new automobiles and light trucks were largely stable or up slightly during the reporting period, and contacts were optimistic for stable sales or slight growth over the balance of the year. A few reports indicated that inventories for various goods remained near desired levels despite slower sales in some cases, as retailers have been practicing very tight inventory management.


Consider this points from the regional district reports:

Boston: First District retailers report mixed sales results for July and early August. Year-over-year same-store sales range from decreases of 10 percent to increases in the low single-digits, and one contact quips that "flat is the new up." Back-to-school sales were modest, with the consumer focused on buying for immediate needs only. Several retailers report increases in foot traffic but also smaller average ticket size.

NY: Non-auto retailers report that sales have slowed across the District since the last report, with comparable-store sales running just 2-3 percent ahead of a year earlier, on average, in July and up just 1-2 percent in the first few weeks of August. The slowing has been particularly pronounced at New York City stores. Two major shopping malls in western New York State also report that sales weakened in July through early August, and they report substantial discounting--especially at clothing retailers.

Philadelphia: Third District retailers reported that sales rose from July to August for the back-to-school shopping period, and most of the stores surveyed posted year-over-year gains for the period. Store executives continued to note that much of the year-over-year improvement in sales has been a consequence of last year's poor results; nevertheless, many said the fundamental trend in sales was beginning to strengthen. Some merchants noted relatively healthy sales of apparel and small appliances, albeit with significant discounting, but weak sales of big-ticket consumer electronic products.

Cleveland: For the period from mid-July through mid-August, retail sales generally showed some improvement when compared to the previous 30-day period. Purchases rose slightly on a year-over-year basis. Still, consumers remain cautious in their purchases and are focusing on value-priced seasonal items.

Richmond: Retail sales sputtered in August, with most merchants reporting either flat or contracting activity. Sales declined at several building supply businesses as well as lawn and garden retail establishments. An executive at a hardware store chain in central Virginia commented that sales were flat, and he had redistributed inventory across store locations as part of an ongoing cost reduction plan to survive the weak housing market. The store manager for a discount chain store in central North Carolina reported erratic apparel sales; however, he and several other retailers were relieved that early results from back-to-school sales on other items were at least satisfactory.

Atlanta: Most District merchants reported that traffic and sales decreased in July and August. Retailers continued to keep inventory levels low and the outlook was less positive than in previous months. District automobile dealers indicated that sales increased from a year ago.

Chicago: Consumer spending increased from the previous reporting period. Retail sales excluding autos were up in August influenced by state sales tax holidays and heavy discounting on back-to-school items like clothing. Contacts noted that higher and lower-end retailers fared well, with middle-end retailers continuing to see customers trading down to lower priced alternatives.

St. Louis: Retail sales reports from contacts in July and early August were mixed. Compared with a year ago, about 37 percent of the retailers saw increases in sales, while 42 percent saw decreases and 21 percent saw no changes. About 32 percent of the respondents noted that sales levels met their expectations, 47 percent reported that sales were below expectations, and 21 percent reported that sales were above expectations. Higher-priced items continued to be weak sellers.

Minneapolis: Retail spending increased moderately. A major Minneapolis-based retailer reported that same-store sales in July were up 2 percent compared with a year earlier, and a Minnesota-based restaurant chain reported that recent sales increased moderately compared with a year ago. July sales at two Minneapolis area malls were above year-ago levels, and mall traffic seemed to hold steady during August. A retailer in Montana noted that sales for appliances and electronics were up about 10 percent compared with a year ago. In southwestern Montana, a furniture store reported that recent sales increased; however, sales at a lumber and home improvement retailer were down.

KC: Consumer spending rose modestly from the previous survey, and contacts expected further growth in the months ahead. Retail sales edged higher and were above year-ago levels at a majority of stores and malls. Purchases of energy-saving appliances and clearance items were reported as strong at several stores, while sales of luxury items such as jewelry and dining room sets were generally characterized as weak.

Dallas: Retailers noted that growth has slowed recently, but sales are up on a year-over-year basis. Customers continue to focus on non-discretionary items while shunning big-ticket purchases. Eleventh District sales trended slightly above the nation over the reporting period, a change from the previous report. Outlooks suggest that while sales growth may be slower for the remainder of the year; overall 2010 sales should show positive single-digit growth.

San Francisco: Retail sales were mixed. Traditional department stores and discount retail chains alike reported further sales increases for small household items, with generally balanced inventories noted. By contrast, sellers of major appliances and furniture reported a slowdown and "difficult" conditions in July and August.


There are a few trends that emerge from the above points.

1.) Consumers are very price conscious.

2.) While consumers appear willing to spend, they are opening their wallets very cautiously.

3.) This is a necessities market -- consumers are probably replacing things that have worn out and are avoiding making big purchases.

Consider these macro charts:


Overall PCEs are continuing to climb and are nearly at highs seen at the end of the last recession.


Services comprise about 65% of PCEs. Their stalling for the better part of a year was obviously a negative development. However, they are now increasing.


Non-durable goods account for about 22% of PCEs. This category of spending has stalled over the last few months.


Durable goods -- which account for about 12% of PCEs have also stalled.

The topping out in durable and non-durable explains the real retail sales picture:


Notice for the last few months we've seen a weaker month to month number.

Let's take a look at auto sales:

NY: Auto dealers in the Rochester area report that sales of new autos were down roughly 10 percent from a year ago in July and down 15 to 20 percent in the first half of August, while Buffalo-area dealers report a 5 percent year-over-year increase in July and project a moderate decline in August. Still, contacts in both areas describe the current sales pace as fairly good, with the 12-month comparisons depressed by last summer's "Cash for clunkers" program. Dealers report that both retail and floor-plan credit conditions have continued to improve.

Philadelphia: Third District auto dealers reported roughly steady sales during July and August at a rate somewhat above the year-ago pace. Dealers expect sales to continue to run at about the current rate for the rest of the year. However, some dealers said manufacturers' incentives are supporting sales of current model-year vehicles, and sales could slip when that supply is depleted and replaced by new model-year vehicles.

Cleveland: Auto dealers saw new vehicle sales strengthen from mid-July through mid-August, when compared with the previous 30 days. Reports also showed improving sales on a year-over-year basis. Expectations call for vehicle purchases to stabilize at current levels in the upcoming months. Many dealers continue to say that their inventories are at low levels. Used vehicle purchases are beginning to soften

Richmond: Big-ticket sales remained weak, according to several contacts. A car dealer in the Tidewater area of Virginia and another in the South Carolina Piedmont indicated that their dealerships were seeing gradual improvement. However, contacts at other dealerships reported a slowdown in sales.

Atlanta: District automobile dealers indicated that sales increased from a year ago.

Chicago: Auto sales rose in July as increased incentives spurred demand, but sales leveled off in August. Dealers continued to report that inventories were lower than desired, particularly for the most popular Ford, GM, and Chrysler models.

St. Louis: Car dealers in the District reported that, compared with last year, sales in July and early August were up, on average. About 44 percent of the car dealers surveyed saw increases in sales, while 32 percent saw decreases and 24 percent saw no changes. Just under half of the car dealers noted that used car sales had increased relative to new car sales, while 12 percent reported the opposite. Also, 20 percent reported more acceptances of finance applications, but 12 percent reported more rejections.

Minneapolis: Vehicle sales were up slightly in North Dakota, according to a representative of an auto dealers association. The owner of a Minnesota domestic auto dealer said that August sales were up from a year ago, but corporate customers were more cautious about purchases.

KC: Auto sales also increased slightly from the previous period, and nearly all dealers were optimistic about future sales. Auto inventories continued to decline, and some dealers were concerned about meeting expected demand as a result.

Dallas: Automobile demand held steady over the reporting period. Contacts said inventories are at appropriate levels and manufacturers are incrementally increasing production. Expectations are for continued modest improvement.

San Fran: Sales of new domestic and imported automobiles improved near the beginning of the reporting period but slowed subsequently. Used vehicle sales improved marginally, while dealers faced a limited supply that kept inventories tight.


The general trend appears to be slightly positive. Consider this chart:


Car sales have a pretty easy year over year comparison, as last years sales were heavily impacted by the cash for clunkers program. Sales have increased from last year's bottom, but have moved sideways for the last few months.

Wednesday, September 8, 2010

Yesterday's Market


I want to start with the bond market today, because the bond market has been a huge beneficiary of an increased concern on the part of investors. Back in May when the Greek crisis started, investors flocked to bonds. Since then, they've been in a strong rally. However, that may be starting to crack.


For the first time in five months. IEF prices have broken below a trend line (a). In addition,


Prices have fallen below the 20 day EMA. Also note the 10 day EMA is approaching the 20 day EMA (but, it's not there yet).

The problem comes from the longer end of the curve -- the TLTs. And the real question is what is the real trend line.


The above trend line makes sense, as there are three major touches (pointed out with arrows). But,


Another trend is also possible. However, there is a really long time between touches and there is a huge area that is not touching the line at all (which I have circled).

So -- which line is the real trend line? Well, this is where the correct answer is both and neither. Simply put, there are reasons to argue both are valid trend lines.


Prices on the SPYs have been above the 200 day EMA for three days now (a). However, they have done so on weak volume (b).


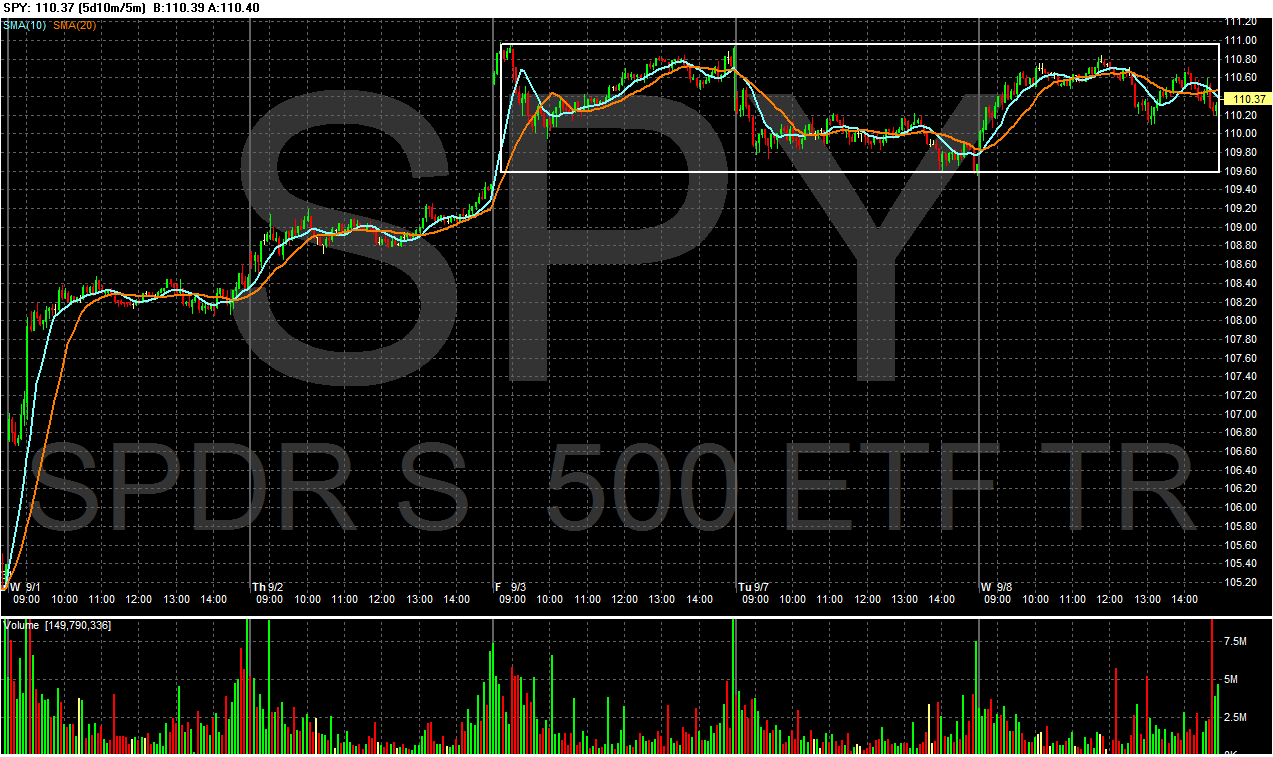
Over the last three trading sessions, we really have a very tight trading range.


Gold continues its upward climb with trend line (B) still intact and a very positive EMA picture (C). However, once again its in a very stubborn resistance area (A) and it is losing a touch of momentum (D). Gold needs to convincingly move through the (A) area and then retest lows to make a real move higher at this point.


Oil is still stuck between areas A and b Right now, prices are in a tight range in the lower 70s (C).