Monday, March 25, 2024

As mortgage rates remain rangebound, so do new home sales


 - by New Deal democrat


Let’s begin this post by putting why I am watching new home sales in context.

The economy was kept out of recession last year, despite aggressive Fed rate hikes, in large part by commodity price deflation, much or most of which was triggered by the un-kinking of supply chains after the pandemic. That gale force economic tailwind is gone, but the Fed rate hikes remain. So the big question for this year is whether the effects of the Fed rate hikes have just been delayed, or whether, because the rate hikes have stopped, so has the headwind they normally produce. Watching manufacturing and construction, especially housing construction, is what I expect to supply the answer.

So, to the data, starting with my usual caveat: while new home sales (blue in the graphs below) are the most leading of the housing metrics, they are noisy and heavily revised. There was little this month, as January was only revised higher by 3,000 to 664,000. February gave back -2,000 of that, coming in at 662,000 annualized. In the below graph I also show th slightly less leading but much less noisy single family permits (red, right scale):


Before I discuss this graph a little further, let’s compare sales with the even more leading metric of mortgage rates. Both are shown YoY (rates inverted, and *100 for scale):


Except for the distortion created by the pandemic shutdowns in spring 2020 and the YoY comparisons in spring 2021, we see that new home sales have almost simultaneously followed the trajectory of mortgage rates: the higher the mortgage rate YoY, the lower new home sales YoY. Because mortgage rates remain slightly elevated compared with one year ago, the progress YoY in new home sales has almost completely stopped. As a result, I expect single family permits to follow the more noisy downward trend in month over month comparisons in sales in the immediate future.

In other words, so long as mortgage rates remain in the 6%-7% range, I expect new housing sales and construction to stall out as well, but not to decline significantly either.

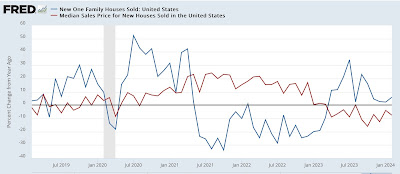
Finally, as I always reiterate, prices lag sales. So here’s the YoY update on median prices (red), which are not seasonally adjusted (red) compared with YoY sales:


Again, aside from the spring 2020 and 2021 YoY distortions due to the pandemic lockdowns, we see that prices followed sales higher, and then in 2023 followed sales lower. We will probably continue see negative YoY comparisons in prices for a few months more before they follow sales back higher YoY probably by late this year.

But the big takeaway remains that, generally speaking, I am not expecting much in the way of big moves in new home sales or prices until there is a significant change in mortgage rates.

Saturday, March 23, 2024

Weekly Indicators for March 18 - 22 at Seeking Alpha


 - by New Deal democrat


My “Weekly Indicators” post is up at Seeking Alpha.

With interest rates having come down from their highs of five months ago, I anticipated that the shorter leading indicators might follow suit and improve. This week, there was some more evidence that they have.

As usual, clicking over and reading should bring you up to the virtual moment as to the important indicators for the economy, and will reward me with a little pocket change.

Friday, March 22, 2024

Signs of a thaw in the frozen existing homes market, but a very long way to go


 - by New Deal democrat


There’s no big economic news today, but yesterday existing home sales were released. While they have historically constituted up to 90% of the entire market, they have much less economic impact than new home sales, which involve all sorts of construction activity, followed by landscaping, furnishings, and other sales.


Since the Fed started raising rates two years ago, the two markets have gone in entirely different directions, since existing homeowners are largely trapped by new or refinanced mortgages in the 3% range, while builders of new homes can make all sorts of accommodations to entice buyers even with mortgage rates near 7%.

As a result, the existing home market for all intents and purposes froze. Yesterday’s report on existing home sales showed that there is a little thawing going on - but hold the pom poms for now.

The seasonally adjusted annual pace of existing home sales rose 38,000 to 438,000 in February, vs, 4,530,000 one year ago. But as the comparison with non-seasonally adjusted data shows, February is typically one of the slowest sales months of the year. Thus a relatively small change - caused by, say, unusually accommodating winter weather - can make a big difference in the seasonally adjusted rate:


When we step back and look at the data for the past 5 years, we can see that there was a similar jump in February of last year as well, that made for the highest seasonally adjusted total for the entire year:


As usual, take one month’s seasonally adjusted data, especially during winter months, with an extra grain of salt.

That being said, there are signs of some improvement in the market, as both total active listings (blue) and new listings (red) housing inventory has been higher YoY for the past four months:


For new listings, this is the first sustained uptick in three years.

But if this is a thaw, it is only the beginning of the thaw, as we can see when we look at the absolute levels rather than the YoY changes (note separate scales):


The first thing to point out is that this data is not seasonally adjusted. Typically listings bottom in December or January, and improve until mid year. So we need to compare this February with February in previous years.

Before the pandemic, total active listings in February averaged just over 1 million units. New listings averaged about 425,000 for the month. After the pandemic struck, both really plunged, with active listings in February bottoming at 347,000 in 2022, while new listings in February bottomed at 305,000 last year. In February this year, active listings totaled 665,000 and new listings totaled 339,000.

In other words, while there are definitely signs of improvement, the existing home market has a long ways - as in, about 400,000 more monthly active listings and 100,000 new monthly listings - to go.

Thursday, March 21, 2024

The positive streak of news from initial and continuing jobless claims continues


 - by New Deal democrat


Initial and continuing claims once again continued their recent good streak. 

Initial claims declined -2,000 to 210,000, while the four week moving average rose 2,500 to 211,250. Continuing claims, with the typical one week delay, increased 4,000 to 1.807 million:


While these aren’t the 50+ year lows we saw 18 months ago, they’re not far off.

For forecasting purposes, the YoY% change for initial claims is -15.0%, while the four week average is down -10.4%. Continuing claims are now only up 0.2%:


Needless to say, these strongly indicate no recession in the next few months.

Because jobless claims can be used to forecast the “Sahm rule” for recessions, let’s update that as well.


With last month’s 2 year high in the unemployment rate, last week I write that U wondered whether, because unemployment includes both new and existing job losses, it followed continuing claims more than initial claims (although initial claims lead both). The historical graph, which I won’t repost this week, indicated that continuing claims also lead the unemployment rate, although with much less of a lead time.

Here is this week’s update of the post-pandemic record for the past two years on a monthly YoY% basis (unemployment rate YoY shown in red):


Since both initial and continuing claims YoY are virtually unchanged, or even lower, I expect the unemployment rate to recede to at least unchanged YoY in the next several months. This would take it back down to the 3.7% or 3.6% area.

Here’s the same comparison on an absolute rather than YoY basis:


This also suggests a lowering at least back down to 3.8%.

The bottom line: no triggering of the Sahm rule.

Wednesday, March 20, 2024

“Are you better off than you were four years ago?”


 - by New Deal democrat


No economic news today, so let me take a look at the supposed killer recent GOP meme that they claim is completely unanswerable: “Are you better off today than you were four years ago?”


This is based primarily on consumer sentiment reading as well as polling that has consistently shown that most people think that the economy is poor, even though they rate their own situation as doing well. Dan Guild has a model comparing consumer sentiment with Presidential approval ratings. He concludes that Biden will lose re-election unless consumer sentiment as measured by the University of Michigan does not improve to the index level of 82.

As I’ve pointed out in the past, Presidential approval correlates quite well with the price of gas. Here’s the historical record updated through last month:


Except for those periods late in recessions and shortly thereafter, when the price of gas has typically declined sharply but the unemployment rate is very high, generally speaking, the lower the cost of gas, the higher the consumer sentiment. Interestingly, except for the early part of the 1990s, when gas prices were ridiculously low, the correlation holds better nominally than adjusted for income.

But perceptions aside, are most people in fact worse off than 4 years ago? Here are two ways of looking at that.

First, as I noted several months ago, Motio Research has produced very good monthly estimates of median household income, that track very well with the (unfortunately) annual measure, which is only reported in September of the next year (thus, for example, the most recent official report even now is for the year 2022). Here’s their update through February:


Note that they recommend (in the small print at the bottom) ignoring the results from March through October 2020, when response rates were very skewed. Leaving those out, only three months during Trump’s term were better than the current reading, and two of those, at 112.7, were equaled by January’s reading. Only February 2020 scored higher, at 112.9.

A second way of measuring is to compare real average and aggregate wages. Below I show average hourly wages (blue), average weekly wages (red), and aggregate payrolls divided by population (black), all deflated by the CPI, and normed to 100 as of February 2020:


Most of the surge in average hourly and weekly earnings in 2020 and early 2021 were compositional. That is, most of the workers laid off during the worst of the pandemic were low wage service workers, in places like restaurants, bars, and entertainment venues. When those workers were rehired during 2021 and 2022, the averages went down, with a very big assist from gas prices spiking to $5/gallon. Since then, both measures have exceeded their levels from just before the pandemic.

Aggregate payrolls, even divided by population, and so including everyone who is not working, and not even in the labor force, hit their pre-pandemic level late in 2021 and haven’t looked back. They are *not* affected by compositional issues. And they are currently 2.9% higher, even on this per capita basis, than they were just before the pandemic.

So the truthful answer for most people to “Are you better off than you were four years ago?” is by any reasonable measure, “Yes.”

Tuesday, March 19, 2024

Housing construction rebounds in February, as permits and starts are stable and rebounding


 - by New Deal democrat


Yesterday I wrote of how Fed rate hikes had not translated into a decline in the amount of housing under construction, and without that I did not see how a recession could occur. And in reaction to January’s housing construction report I concluded, “To signify a likely recession, units under construction would have to decline at least -10%, and needless to say, we’re not there. With permits having increased off their bottom, I am not expecting such a 10% decline in construction to materialize.”

This morning’s report for February confirmed that sentiment, as single family permits, total permits, and housing starts lol rose, with starts making up almost all of their steep, and noisy, decline in January:


Single family permits, which are the most leading and least noisy of the above metrics, made a new 18 month high at 1.031 million annualized, which is 37% higher than their low of 748,000 annualized last January. They have made up about 60% of the ground they lost since the start of the Fed’s rate hikes over 2 years ago. Starts, which lag slightly and are much more noisy, have likely bottomed as well.

To reiterate: housing units under construction (red in the graph below) are the best measure of the actual economic activity in the housing market, and while these declined -8,000 for the month to a new nearly 2 year low, they are only down -2.6% from their peak. Single family units have actually increased 17,000 from their bottom last October, while multi-family units have declined -3.5% from their all-time 50+ year high last July:


The reason I have broken out single vs. multi-family construction is because, in response to record high house prices, builders turned to higher density, lower cost apartment and condo construction. Hence the record high last year in that metric.

Unsurprisingly, permits (blue in the graph below) lead housing units under construction (red), but a major disconnect has opened over the past 10 years, as especially large multi-unit developments take longer to complete:


I do expect a further gradual decline in total housing units under construction in the months ahead, to catch up with the decline in permits that bottomed one year ago. But I doubt we will cross the -10% threshold that it would normally take to signal a recession.

A large part of that is because mortgage rates have stabilized (red in the graph below), and since permits and starts follow mortgage rates, they have generally stabilized as well:


The best way to view this relationship is YoY, which is shown below:


Mortgage rates are slightly higher than they were 12 months ago. After a brief decline last spring, mortgage rates rose to multi-year highs last autumn. So unless there is a renewed major move upward in mortgage rates, I expect the YoY comparison by permits to turn positive by this summer sometime. That is going to translate into gains in permits and starts, and a likely bottom in housing units under construciton. 

As to prices, they generally follow housing sales. Because of the bifurcation in the housing market, with many existing homeowners frozen in place by their 3% existing mortgages, new home sales have rebounded, and new home prices are in a bottoming process. We’ll get more information later this week and next week when new and existing home sales are reported.

Monday, March 18, 2024

Manufacturing and construction vs. the still-inverted yield curve


 - by New Deal democrat


Prof. Menzie Chinn at Econbrowser makes the point that the yield curve is still inverted, and has not yet eclipsed the longest previous time between onset of such an inversion and a recession. So he believes the threat of recession is still on the table.


And he’s correct about the yield curve, although it is getting very long in the tooth. In the past half century, the shortest time between a 10 minus 2 year inversion (blue in the graph below) to recession has been 10 months (1980) and the longest 22 months (2007). For the 10 year minus 3 month inversion (red), the shortest time has been 8 months (1980 and 2001) and the longest has been 17 months (2007):


At present the former yield curve has been inverted for 20.5 months, and the latter for 16.5 months. So if there is no recession by May 1, we’re in uncharted territory as far as the yield curve indicator is concerned.

My view for the past half year or so has been much more cautious. While there has been nearly unprecedented Fed tightening (only the 1980-81 tightening was more severe), on the other hand there was massive pandemic stimulus, and what I described on some occasions as a “hurricane force tailwind” of supply chain unkinking. If the two positive forces have abated, does the negative force of the Fed tightening, which is still in place, now take precedence? Or because interest rates have plateaued in the past year, is it too something of a spent force? Since I confess not to know, because the situation is unprecedented in the modern era for which most data is available, I have highlighted turning to the short leading metrics. Do they remain steady or improve? Or do they deteriorate as they have before prior recessions?

First of all, let me show the NY Fed’s Global Supply Chain Index, which attempts to disaggregate supply sided information from demand side information. A positive value shows relative tightening, a negative loosening:


You can see the huge pandemic tightening in 2020 into 2022, followed by a similarly large loosening through 2023. For the past few months, the Index has been close to neutral, or shown very slight tightness.

Typically in the past Fed tightenings have operated through two main channels: housing and manufacturing, especially durable goods manufacturing.

Let’s take the two in reverse order.

Manufacturing has at very least stalled, and by some measures turned down to recessionary levels.  Last week I discussed industrial production (not shown), which peaked in late 2022 and has continued to trend sideways to slightly negative right through February.

A very good harbinger with a record going back 75 years has been the ISM manufacturing index. Here’s its historical record through about 10 years ago (when FRED discontinued publishing it):


And here is its record for the past several years:


This index was frankly recessionary for almost all of last year. It is still negative, although not so much as before.

Two other metrics with lengthy records are the average hourly workweek in manufacturing (blue, right scale), which is one of the 10 “official” leading indicators, as well as real spending on durable goods (red, measured YoY for ease of comparison, left scale):


As a general rule, if real spending on durable goods turns negative YoY for more than an isolated month, a recession has started (with the peak in absolute terms coming before). Also, since employers generally cut hours before cutting jobs, a decline of about 0.8% of an hour in the average manufacturing workweek has typically preceded a recession - with the caveat in modern times that it must fall to at least roughly 40.5 hours:


The average manufacturing workweek has met the former criteria for the last 9 months, and the latter since November. By contrast, real spending on durable goods was up 0.7% YoY as of the last report for January, and in December had made an all-time record high.

But if some of the manufacturing data has met the historical criteria for a recession warning, it is important to note that manufacturing is less of US GDP than before the year 2000, and had been down more in 2015-16 without a recession occurring.

Further, housing construction has not meaningfully constricted at all. The below graph shows the leading metric of housing permits (another “official” component of the LEI, right scale), together with housing units under construction (gold, *1.2 for scale, right scale), and also real GDP q/q (red, left scale):


Housing permits declined -30% after the Fed began tightening, which has normally been enough to trigger a recession. *BUT* the actual measure of economic activity, housing units under construction, has barely turned down at all. In comparison to past downturns, where typically it had fallen at least 10%, and more often 20%, before a recession had begun, as of last month it was only 2% off peak!

The only other two occasions where housing permits declined comparably with no recession ensuing - 1966 and 1986 - real gross domestic product increased robustly. This was similarly the case in 2023.

An important reason is the other historical reason proppin up expansions: stimulative government spending. Here’s the historical record comparing fiscal surpluses vs. deficits:


Note the abrupt end of stimulative spending in 1937, normally thought to have been the prime driver of the steep 1938 recession. Note also the big “Great Society” stimulative spending in 1966-68, when a downturn was averted (indeed, although not shown in the first graph above, there was an inverted yield curve then as well). Needless to say, there as been a great deal of stimulative fiscal spending since 2020 as well.

Fed tightening typically works by constricting demand. Both government stimulus and the unkinking of supply chains work to stimulate supply. 

All of which leads to the conclusion that, while manufacturing has reacted to the tightening, the *real* measure of construction activity has not, or not sufficiently to be recessionary.

Tomorrow housing permits, starts, and units under construction will all be updated. Unless there is a sharp decline in units under construction, there is no short term recession signal at all.

Saturday, March 16, 2024

Weekly Indicators for March 11 - 15 at Seeking Alpha


 - by New Deal democrat


My “Weekly Indicators” post is up at Seeking Alpha.

Not a lot of movement in any indicator this week. The long leading background, even after all this time, still tilts negative even though “less bad.” And the shorter term data continues mixed, as some sectors are very positive, and a few are very negative.

As usual, clicking over and reading will bring you up to the virtual moment on the economy, and bring me a little lunch money for my efforts.

Friday, March 15, 2024

Industrial and manufacturing production improve for the month, but 16+ month fading trend continues


 - by New Deal democrat


Industrial production is an indicator that has faded somewhat in importance in the modern era since China’s accession to normal trading status in 2000. Before that, a downturn in production was an excellent coincident indicator for a general downturn in the economy. Since then there have been several downturns, most importantly during 2015-16, when the broader economy, most notably housing and the consumer, did not follow. That was again the case of the downturn in 2023 - which has not resolved yet.

This morning’s report was another case of good news and bad news. The good news is that industrial production rose 0.1% for the month, and manufacturing production rose 0.8% from downwardly revised January numbers:


The bad news is that both remain down YoY, by -0.3% and -0.2% respectively (which, note, is not as bad a YoY comparison as either 2015-16 or 6 to 12 months ago), and both remain down from their respective peaks of September and October 2022. Here’s the YoY view:


In fact, the general trend over the past half year appears to be a further slight fade from a secondary peak in the summer of 2023.

This is, needless to say, particularly unwelcome in view of yesterday’s poor real retail sales report. If both manufacturing and the consumer are stallling out, that is not good. It will heighten the importance of this month’s report on personal spending, to see how well the broader measure of real spending on goods in particular is holding up.

Thursday, March 14, 2024

Good news and bad news Thursday: the bad news is real retail sales


 - by New Deal democrat


The bad economic news this morning was that after taking into account inflation, retail sales, which rose 0.6% nominally, were only up 0.2%, and last month’s number, which I described as making a “face-plant,” was revised down a further -0.3% to -1.1%.

In other words, the net result was that real retails sales were -0.1% worse than last month’s poor result as initially reported.

Which is bad enough. But it means that the last two months are the worst post-pandemic numbers in almost three years. Below I show them in comparison with real personal consumption on goods, the similar metric from the personal income and spending report, normed to 100 as of just before the pandemic:


I included the second number above because real retail sales and real personal spending on goods tend to track one another fairly closely over time, and both (/2) tend to forecast the trend in nonfarm payrolls. What has been compellling over the past half year is the marked divergence between the two spending measures, as retail sales have declined, while real personal spending has continued to increase.

 Here’s the record of both compared with jobs going back 15 years measured YoY:


On that same YoY basis now, real retail sales (blue) are down -1.6%, after a revised -2.0% in January, meaning a (noisy!) trend forecast of a YoY decline in jobs of over -0.5%, vs. the real personal spending forecast of roughly a 1% gain: 


Usually in the past (as, going back almost 75 years) such a decline in real retail sales has meant recession - but not in the last 18 months. I continue to expect the unusual large divergence between the two spending measures to resolve, hopefully in the direction of real personal spending.

Good news and bad news Thursday: the good news is jobless claims . . .


 - by New Deal democrat


This morning brought us both good and bad economic news.


The good news was that initial jobless claims continue very low, at 209,000, down -1,000 from last week, while the four week average declined -500 to 208,000. Even better, after major downward revisions, continuing claims rose 17,000 to 1.811 million:


Recall that continuing claims had been reported over 1.900 million, so as I said above, this was major!

On the more important YoY basis for forecasting, initial claims are down -14.3%, the four week average down -7.2%, and continuing claims, which before revisions had been running at about 10% higher YoY, are now only up 2.2%:


This is all very positive for continued good employment numbers in the months ahead (but see my next post today!).

Last week the unemployment number very much did NOT do what I expected, which was to remain steady or decline. Instead it rose to a new 2+ year high of 3.9%. I wondered whether, because unemployment includes both new and existing job losses, it followed continuing claims more than initial claims (although initial claims lead both).

Here’s the long term pre-pandemic trend (divided into two parts for easier viewing)(continuing claims /8 for scale):


Historically, as I’ve always pointed out, initial claims lead both continuing claims and the unemployment rate. The above graph shows that continuing claims also lead the unemployment rate, although with much less of a lead time.

So here is the post-pandemic record:


The divergence between initial and continuing claims beginning this past autumn looks like it indeed has passed through into the unemployment rate. Since the historical record remains that initial claims lead continuing claims, and in the past three weeks (post revisions!) continuing claims have declined sharply, we’ll see how this shakes out after the full month of March.

Wednesday, March 13, 2024

The most potent labor market indicator of all is still strongly positive


 - by New Deal democrat


On Monday I examined some series from last Friday’s Household survey in the jobs report, highlighting that they more frequently than not indicated a recession was near or underway. But I concluded by noting that this survey has historically been noisy, and I thought it would be resolved away this time. Specifically, there was strong contrary data from the Establishment survey, backed up by yesterday’s inflation report, to the contrary. Today I’ll examine that, looking at two other series.


Historically, as economic expansions progress and the unemployment rate goes down, average hourly wages for nonsupervisory workers improve at an increasing rate (blue in the graph below). But eventually, inflation (red) picks up and overtakes that wage growth, and a recession occurs shortly thereafter. Not always, as we’ll see in the graph below, but usually:


As you can see, there have been a number of exceptions to the rule, chiefly where inflation outstripped wage growth, but no recession happened anyway. Typically this has occurred because of the entry of so many more people (like women in the 1980s and early 1990s) into the labor force.

And we certainly see that inflation outstripped wages in 2022, not coincidentally when there were several negative quarters of real GDP. But with the decline in gas prices, in 2023 inflation subsided much more sharply than wage growth, and the economy improved more substantially. That has remained the case in the first two months of 2024.

But an even more potent indicator is one I have come to rely on even more: real aggregate payrolls for nonsupervisory workers. Here’s its historical record up until the pandemic:


There’s not a single false positive, nor a single false negative. If YoY aggregate payroll growth is stronger than YoY inflation, you’re in an expansion. If it’s weaker, you’re in a recession. Period.

And here is its record since the pandemic:


Real aggregate nonsurpervisory payrolls are positive, and they got more positive in 2023 compared with 2022. Currently they are 2.6% higher YoY than inflation.

In addition to the YoY comparison, real aggregate nonsupervisory payrolls have always declined, at least slightly, from their expansion peaks before every single recession in the past 50 years except for when the pandemic suddenly shut down the economy:


Not every slight decline means a recession is coming. But if real aggregate payrolls are at a new high, you’re not in a recession, and one isn’t likely to occur in the next 6 months, either.

And in case it isn’t clear from that long term graph, here’s the short term graph of the same thing:


Real aggregate nonsupervisory payrolls made a new all-time high in February. Despite the negative metrics in the Household survey, this is *very* potent evidence that not only are we not in a recession, but one isn’t likely in the immediate future either.


Tuesday, March 12, 2024

February consumer inflation: the tug of war between gasoline and shelter continues


 - by New Deal democrat


Last month I described the trend in consumer inflation as an ongoing “tug of war” between energy and housing. Energy (mainly gasoline) peaked in June 2022 and made its  low in June 2023, while housing, which peaked in early 2023, has been gradually disinflating since.

That tug of war continued in February. Energy prices firmed, up 2.3% for the month, while shelter, which still increased 0.4% for the month, had its lowest YoY reading since June of 2022. As you may already know, both headline and core inflation rose 0.4% in February. The YoY increases were 3.2% and 3.8% respectively. The former YoY reading is in the range that it has been for the past 6 months, while the latter is also the lowest since April 2021. Here are the monthly changes in each for the past two years:


In lieu of a bunch of graphs, here is the Census Bureau’s spreadsheet. The column at the far right shows the YoY increases, where it is easy to see where the remaining problem areas are:

The only sectors still up over 4% YoY are food away from home, transport services (mainly repairs and insurance), and - still - housing. Here’s what the first two look like, plus a breakout of the motor vehicle repair and maintenance component of transport services:


Inflation in food away from home is still gradually disinflating, and is now at its lowest YoY rate of increase since June 2021. although it is still running about 1.5% above its YoY rate before the pandemic. If its present trend continues, it will be increasing at its pre-pandemic level in about 6 months. 

Transportation services, however, have stopped decelerating for the last 8 months. As shown above, however, it isn’t due to repairs, which while still up 6.7% YoY, have shown sharp deceleration. Rather, it is almost all due to motor vehicle insurance (which unfortunately is not broken out separately on FRED), which was up another 0.9% in February alone, and is up a whopping 20.6 YoY!

Aside from motor vehicle insurance, as I’ve been saying for months, the only *real* remaining inflation problem boils down to shelter. To show this, below are the YoY% increases in headline inflation (which has been bouncing around between 3.1% and 3.7% for over half a year, core inflation, which has been very gradually trending downward, energy (now down -1.7% YoY, /3 for scale), and CPI ex-shelter, which is up only 1.8% YoY:


An issue has been made by a few people about whether series like the Apartment List National Rent Index, which have shown slight YoY *declines* in rents for several months, have been giving a true leading reading. While rent of primary residence has continued to increase, up 0.5% in February, the YoY comparisons continue to show deceleration, Here are the monthly% (blue, right scale) and YoY% (red, left scale) changes in the CPI for rent of primary residence:


YoY comparisons will get much more challenging beginning next month, as the final 0.7% monthly reading from last February drops out of the picture. But the last 3 months have only increased a total of 1.1%, and are the lowest 3 month average since autumn 2021. I suspect that the slowly decelerating trend will continue. If it continues over the next 6 to 9 months, YoY rent in the CPI will be about 3.4% - right in the middle of its pre-pandemic range.

Finally, here is this month’s update of the graph comparing house prices as measured by the FHFA Index (/2.5 for scale) with CPI measure of owners equivalent rent:


Like rent of primary residence, owners equivalent rent, up 6.0% YoY, is increasing at the lowest pace since July 2022. Although house prices have resumed increasing in the past half year, the pace of those increases is in line with their pre-pandemic trend. Thus I expect the deceleration the CPI shelter index to continue, although it may do so at a slower pace.

To sum up, my conclusion this month is the same as it was last month, to wit: if there are no unpleasant surprises awaiting in the months ahead as to gas prices, we can expect headline inflation to continue to be fairly stable, and shelter to continue to show disinflation, leading to gradually lower core inflation readings as well.