- by New Deal democrat
Let’s begin this post by putting why I am watching new home sales in context.
The economy was kept out of recession last year, despite aggressive Fed rate hikes, in large part by commodity price deflation, much or most of which was triggered by the un-kinking of supply chains after the pandemic. That gale force economic tailwind is gone, but the Fed rate hikes remain. So the big question for this year is whether the effects of the Fed rate hikes have just been delayed, or whether, because the rate hikes have stopped, so has the headwind they normally produce. Watching manufacturing and construction, especially housing construction, is what I expect to supply the answer.
So, to the data, starting with my usual caveat: while new home sales (blue in the graphs below) are the most leading of the housing metrics, they are noisy and heavily revised. There was little this month, as January was only revised higher by 3,000 to 664,000. February gave back -2,000 of that, coming in at 662,000 annualized. In the below graph I also show th slightly less leading but much less noisy single family permits (red, right scale):


Before I discuss this graph a little further, let’s compare sales with the even more leading metric of mortgage rates. Both are shown YoY (rates inverted, and *100 for scale):

Except for the distortion created by the pandemic shutdowns in spring 2020 and the YoY comparisons in spring 2021, we see that new home sales have almost simultaneously followed the trajectory of mortgage rates: the higher the mortgage rate YoY, the lower new home sales YoY. Because mortgage rates remain slightly elevated compared with one year ago, the progress YoY in new home sales has almost completely stopped. As a result, I expect single family permits to follow the more noisy downward trend in month over month comparisons in sales in the immediate future.
In other words, so long as mortgage rates remain in the 6%-7% range, I expect new housing sales and construction to stall out as well, but not to decline significantly either.
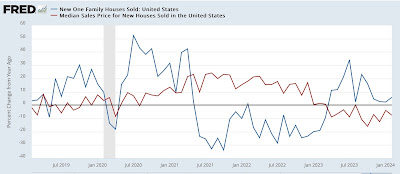
Finally, as I always reiterate, prices lag sales. So here’s the YoY update on median prices (red), which are not seasonally adjusted (red) compared with YoY sales:

Again, aside from the spring 2020 and 2021 YoY distortions due to the pandemic lockdowns, we see that prices followed sales higher, and then in 2023 followed sales lower. We will probably continue see negative YoY comparisons in prices for a few months more before they follow sales back higher YoY probably by late this year.
But the big takeaway remains that, generally speaking, I am not expecting much in the way of big moves in new home sales or prices until there is a significant change in mortgage rates.