Thursday, December 14, 2023

Jobless claims: good news all around


 - by New Deal democrat


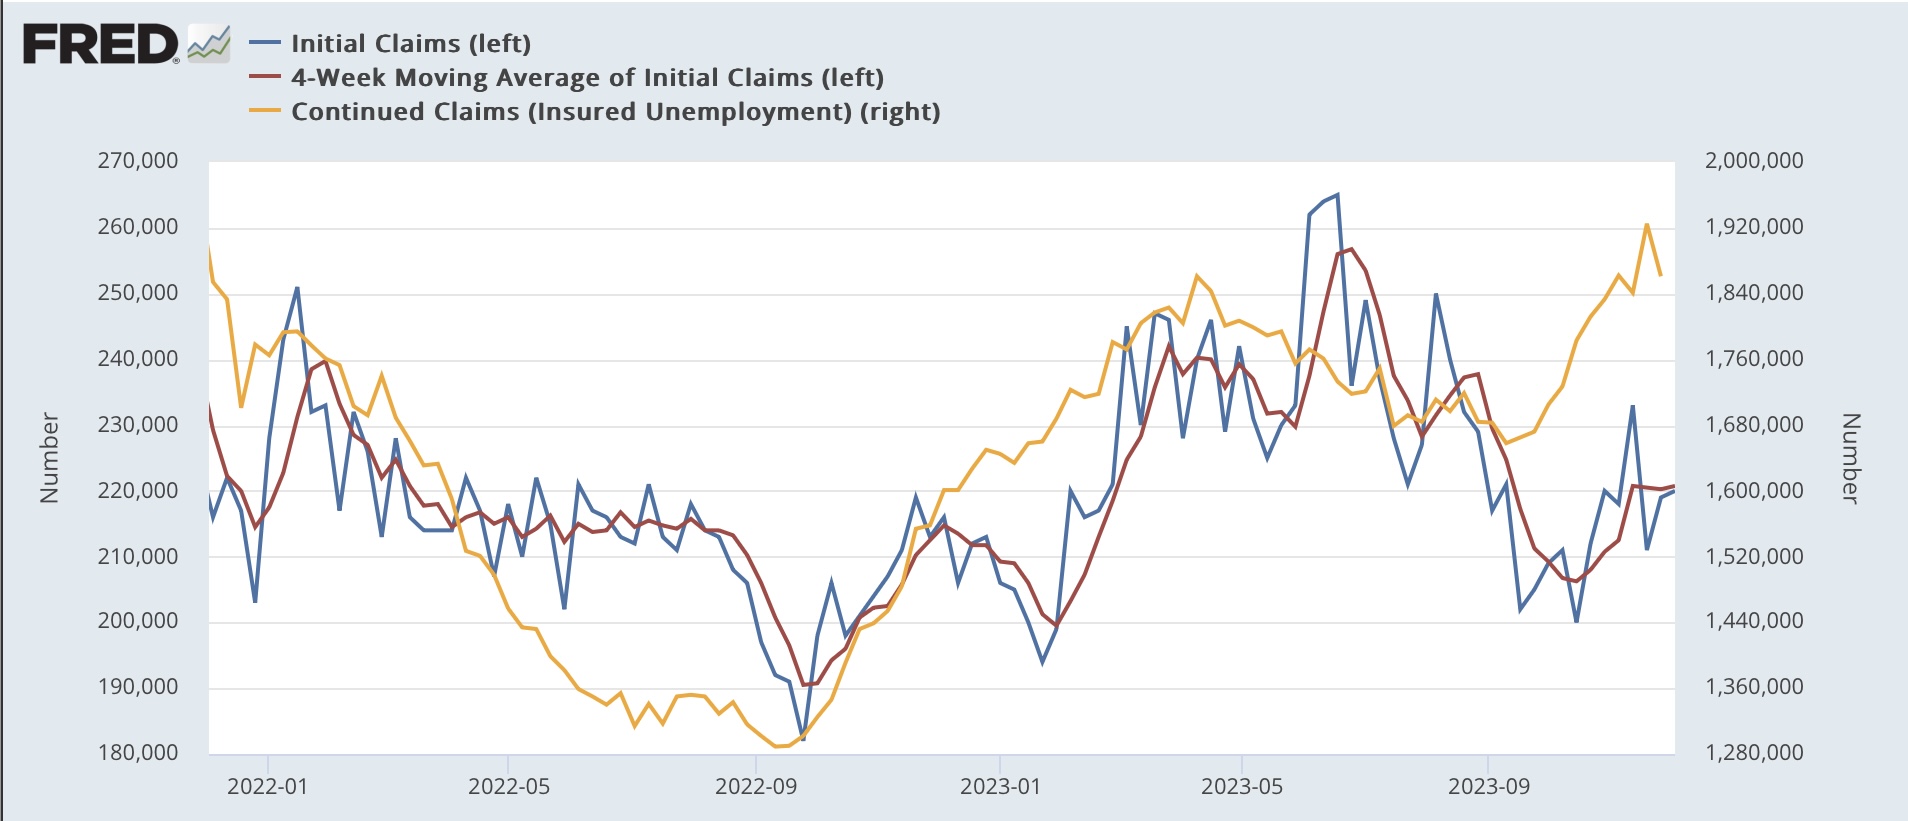
This was one of the best weeks as to jobless claims all year. Initial claims declined -17,000 to 202,000, a tie for the 2nd lowest number in 10 months. The four week average declined -7,750 to 213,250. With the usual one week delay, continuing claims rose 20,000 to 1.876 million:


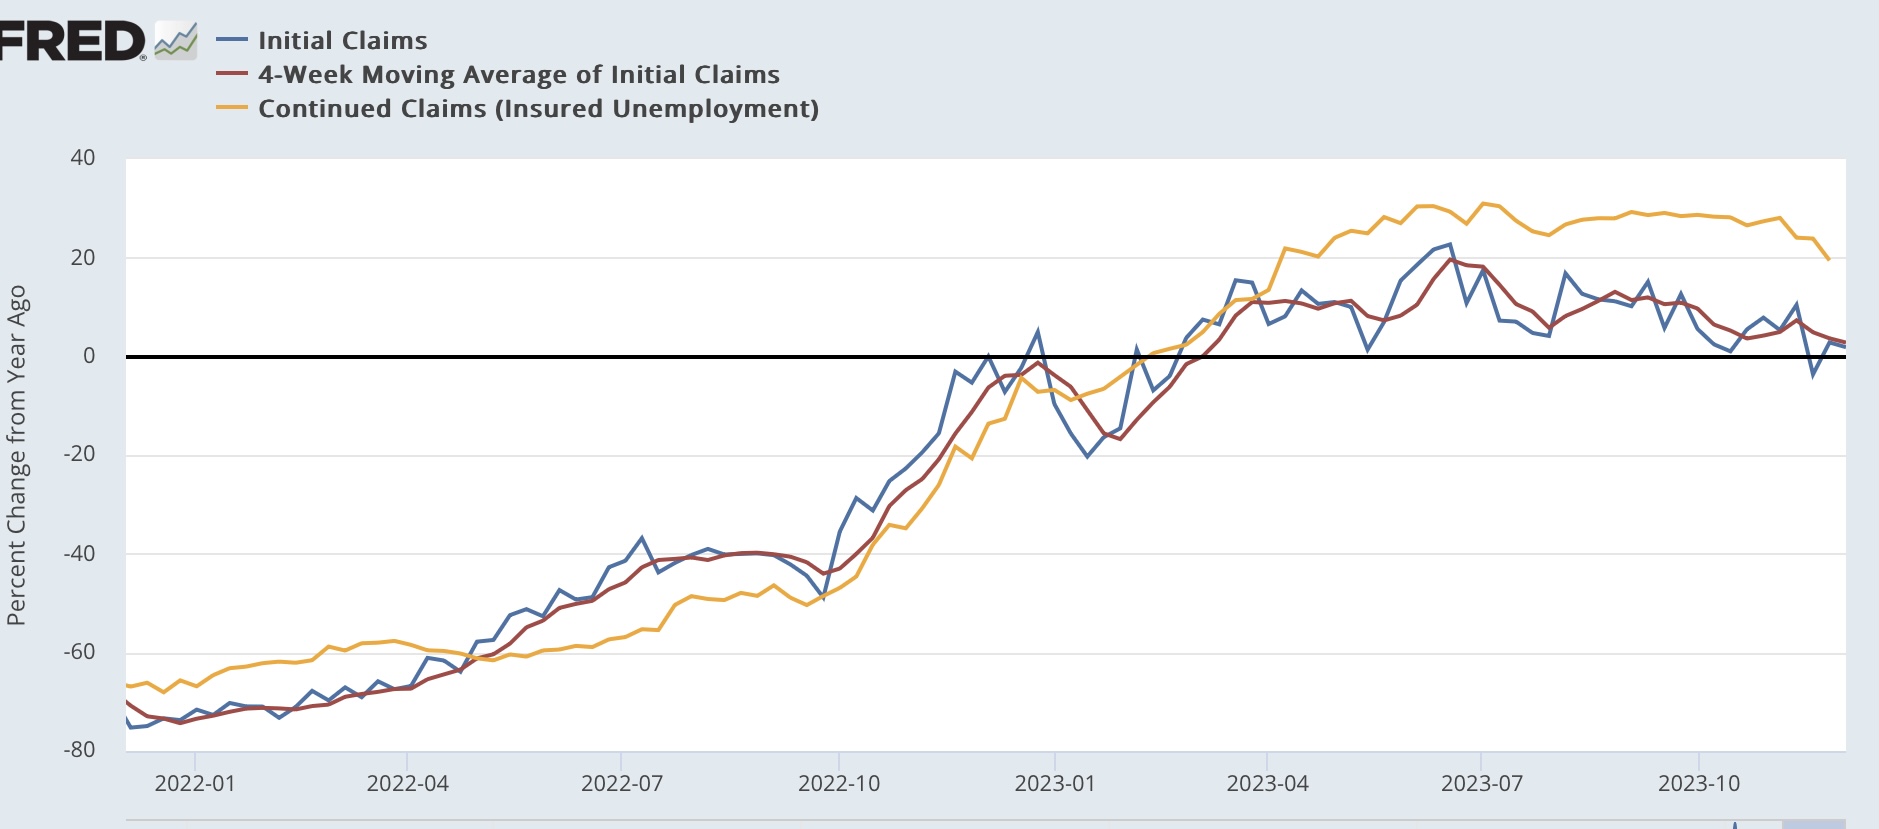
Even more importantly for forecasting purposes, the YoY% changes both for the weekly number and the four week average were negative, i.e., lower than one year ago, at -1.9% and -0.1% respectively. Meanwhile continuing claims, while elevated at +17.2%, are nonetheless lower on a YoY basis than at any point in the past 8 months:


This makes initial claims an outright positive for the economy in the near future. And it cuts against the idea that continuing claims were forecasting a recession.

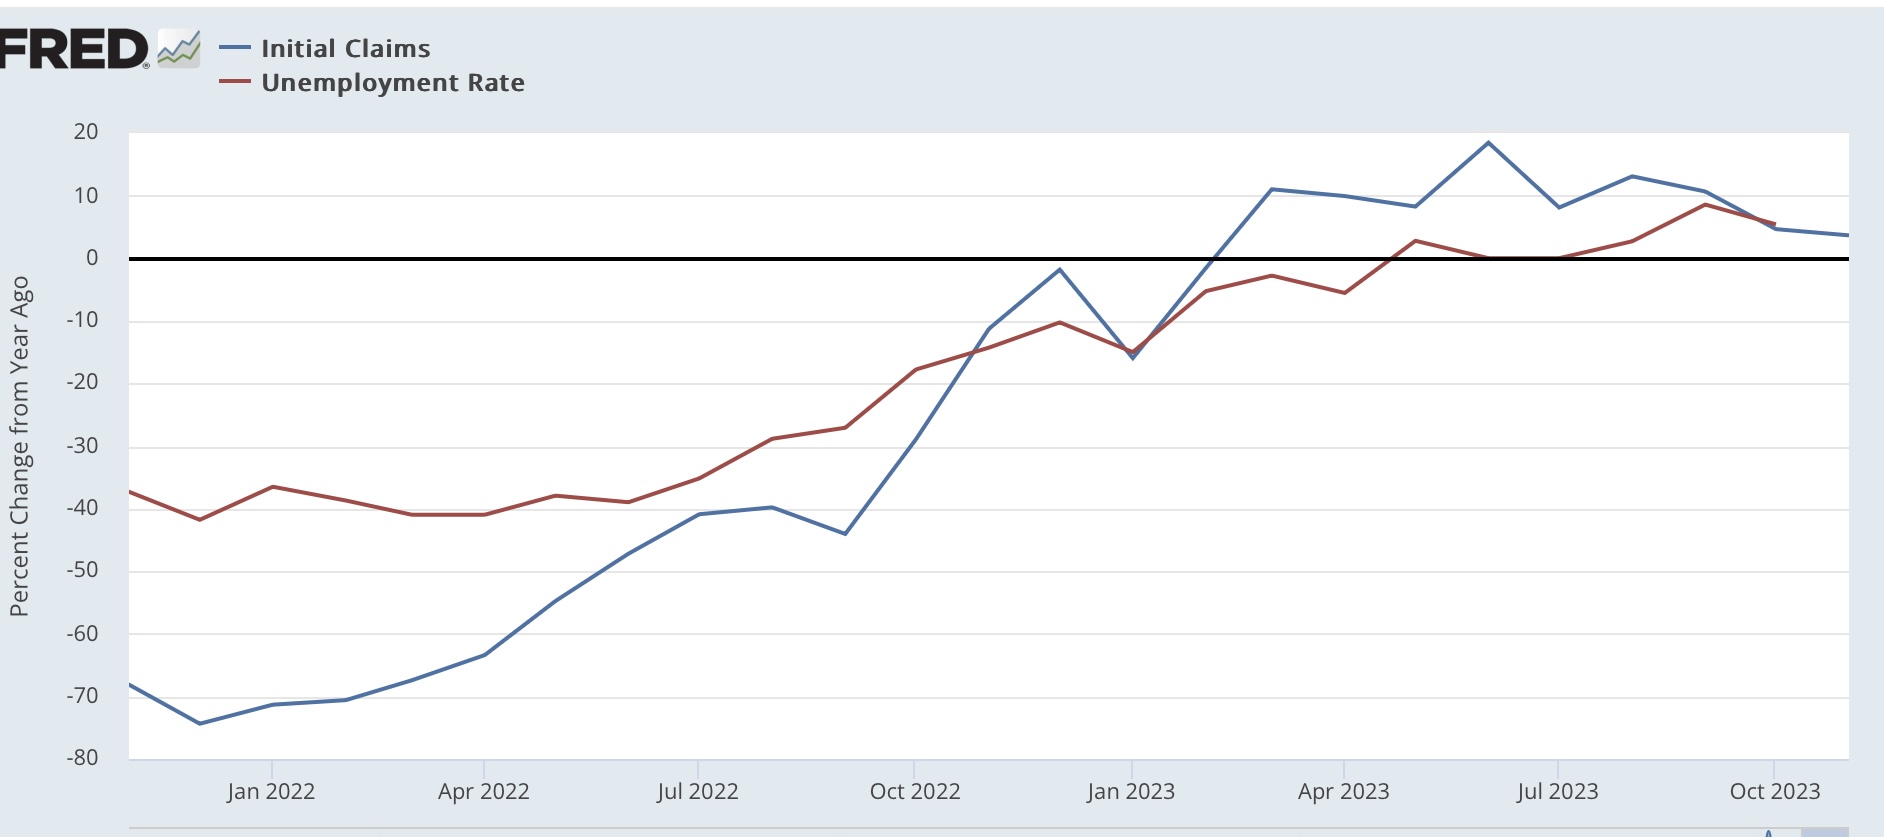
Since initial claims lead the unemployment rate, this also adds a level of comfort to the forecast that the elevated comparisons earlier this year will not trigger the “Sahm rule” as to the YoY change in the unemployment rate:


To reiterate, simply: good news all around.

Wednesday, December 13, 2023

Producer prices, “sticky” consumer prices - basically, everything except shelter show nearly complete abatement of inflation


 - by New Deal democrat


The producer price index released this morning for November is yet further confirmation that inflation ex-shelter is simply not in the pipeline. Both total and core PPI were unchanged for the month. Both commodities (blue) and finished goods (red) declined by another -0.5%, as shown in the below graph normed to 100 just before the pandemic, and including headline CPI as well (gray):


On a YoY basis, commodities are down -3.6%, and finished goods inputs down-0.9%, compared with the 3.1% rise in consumer prices:


Some of this difference probably remains producers refusing to pass on price decreases to consumers, and since consumers still have more income and savings in real terms than they had before the pandemic, consumers are able to pay those increased costs. 

And of course, a big part of the difference is shelter. The idea that the official measure of shelter lags reality seems to have gained increased currency. Steve Liesman of CNBC made a point of it this morning, saying it lagged by 3 Quarters. Meanwhile Scott Grannis (a/k/a Calafia Beach Pundit) put up the below graph with an 18 month lag:


After the official CPI came out yesterday, the Cleveland Fed posted its “sticky price” CPI, which also showed that, absent shelter, even sticky prices are up only 3.1%, vs. both total and core sticky price inflation including shelter, both up 4.7%:


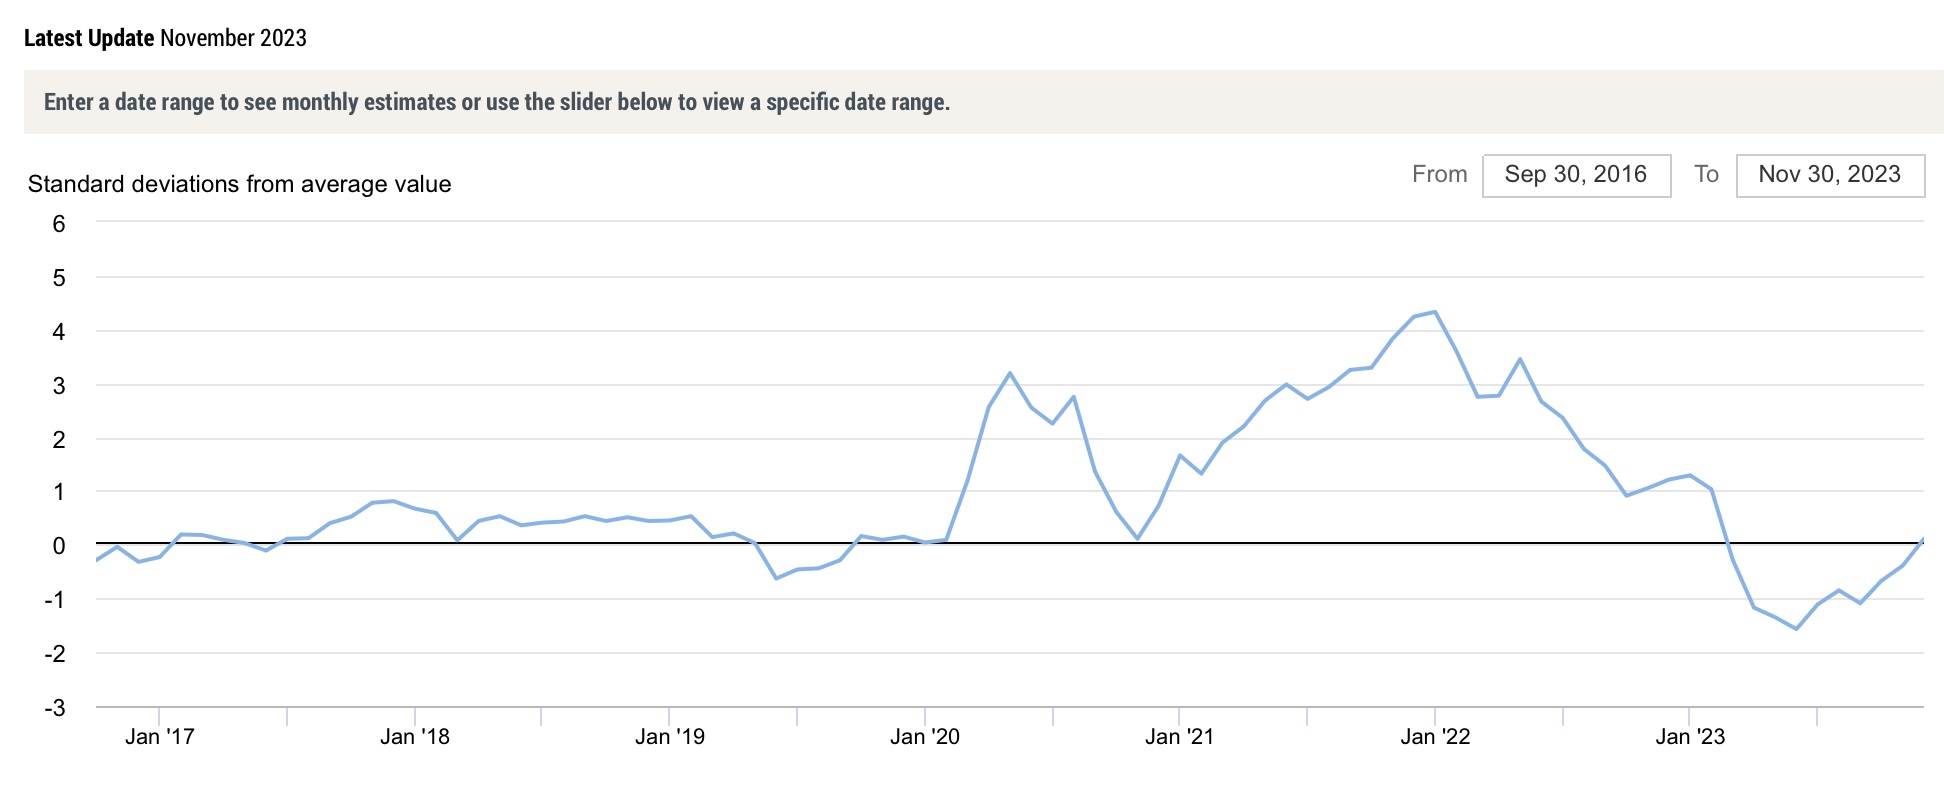
One important question going forward is whether the supply chain has been fully “de-kinked.” The Goldman Sachs Supply Chain Index suggests that it has. Before the pandemic, the average typically varied between 0 and -1 on the index. After the huge pandemic-related increase, it went below -1 earlier this year. In November, for the first time since summer 2022, it went above 0 again:


The Bloomberg Industrial Metals Index, which I use because it does not include gas and oil, also peaked in early 2022, and has settled into a flat to slightly declining trend for the last 6 months:


In summary, pressures on producer prices have completely abated. The un-kinking of the pandemic related supply chain seems to have been completed. Consumer price increases ex-shelter also continue to be within a short distance to the Fed’s 2% target. What’s left is shelter, and ironically by constricting the supply of existing houses on the market, the Fed’s increases in that regard have become counterproductive.

Fortunately, as I pointed out yesterday, average and aggregate earnings have exceeded inflation for the past year. I do continue to be concerned that a substantial downturn in actual residential construction is going to materialize in the next few months, with all that it implies as a leading indicator.

Tuesday, December 12, 2023

Real aggregate payrolls rise to new high as CPI ex-shelter continues somnolent


 - by New Deal democrat


With few exceptions, the November CPI report once again demonstrated how important fictitious shelter is to its calculation, as well as how important the inflection point of $5 gas in June 2022 has been.

Headline inflation rose only 0.1% in November, and is up 3.1% YoY. Core inflation less food and energy increased 0.3%, and is up 4.0% YoY.

Shelter, which is 1/3rd of the headline index, and 40% of core, increased 0.4% for the month and was up 6.5% YoY. Perhaps more importantly, CPI ex-shelter was *down* -0.1% for the month, and up only 1.5% YoY.

Per the above, below I show headline (blue), core (red), and CPI less shelter (gold) all normed to 100 as of June 2022:


Ex-shelter, in the past 16 months prices have risen only 1.7%, while headline inflation has risen 4.5%, and core inflation has risen 6.5%.

In other words, take out shelter and inflation is a non-issue.

The former problem areas of new and used vehicles continue to cool, with new car prices declining -0.1% in November, while used car prices increased 1.0%. YoY new car prices are up only 1.3%, while used car prices are up 3.8%.:


But for several reasons, including that people are holding on to their older vehicles longer, which means they need more repairs, as well as the fact that insurance has had to keep pace with both the prices of new cars as well as the increased costs of repairs, the “transportation services” subset of CPI increased another 1.1% for the month, and is up 10.1% YoY:


The other current problem children are food away from home (restaurants), up 0.4% m/m and 5.5% YoY, and medical care commodities, up 0.5% m/m and 5.0% YoY. But these make up relatively small weights in the index, and are not nearly the problem that shelter continues to be.

As to shelter, here’s the update of Owners’ Equivalent Rent YoY compared with the Case Shiller index (recall that the former has a history of lagging the latter by 12 or more months):


As has been the ongoing case, YoY shelter rose more gradually than house prices, and is falling more gradually, but it is continuing to fall. At its current pace of decline, it will take another 12 months or more to be back into the Fed’s comfort zone.

Finally, we can also update real aggregate payrolls. These rose nominally by 0.9% in November, so after inflation they rose 0.8% to a new all-time high:


This means that in the aggregate average working and middle class Americans have more buying power now than ever before, and is a very potent positive for the economy over the next few months.

Monday, December 11, 2023

Scenes from the leading sectors of the November jobs report: why I sounded a note of caution


 - by New Deal democrat


I seem to have been something of a negative outlier with respect to last Friday’s jobs report. Not because I was downbeat - although I said there were “warning signs of weakness,” but almost all the other commentary I have seen was upbeat.

So today let’s take a look at the leading sectors in the jobs report, to show why I sounded a note of caution.


Let’s start with the manufacturing workweek, which is one of the 10 official components of the Index of Leading Indicators. It typically has turned down in the past even before manufacturing employment itself does. Here’s its record from the end of WW2 almost 80 years ago:


Almost always (exceptions 1966, 1985, and 1995) when manufacturing hours and overtime have declined more than by -.05 hours, a recession has followed. In the past 18 months, hours have declined by -0.9 hours, and overtime has declined by -1.1 hours.

Next, here is the long term look at manufacturing employment up until the “China shock” began in 2000:


With rare exception (twice in the 1950s plus 1981), manufacturing employment turned down before a recession began.

Here’s the recent record, also splitting out motor vehicle manufacturing, which has benefited from the unlinking of the supply chain:


In total, manufacturing employment has been close to unchanged for a year. Excluding motor vehicle employment, it has declined slightly.

But as I’ve written recently, manufacturing plays less of a role in the US economic cycle than it used to. So let’s look at other sectors as well.

Another jobs sector that has always turned at least flat in advance of a recessions is construction, and residential building construction has always declined:


Residential building construction employment has been flat for almost a year, while general construction employment (aided by the restoring of manufacturing capacity) has continued to increase:


Typically residential construction employment has coincided with the number of residential units under construction, and it has done so this year as well:


Another leading sector of employment has been truck transportation, which with the exception of 2000 has also turned down in advance of recessions:


It has turned down as well in the past half year:


All of the above are generally in the “goods” rather than “services” employment sector. Goods employment has generally flattened, and occasionally declined in advance of recessions:


It is still increasing, although at a more subdued rate this year:


Last week I discussed the importance of real spending on goods, noting that it led employment. On a YoY basis, real goods spending is up 2.1%, while goods employment is up 1.1%. The below graph norms both values to zero, to show how they compare historically:


Both real spending on goods and goods employment are actually weak on a historical basis, but both are consistent with a number of slowdowns that did not turn into recessions in the past. 

There is also at least one services segment which has also historically been leading: temporary help services:


These have declined sharply in the past year:


Finally, although they are not a leading sector, I noted in my report Friday that professional and business employment is down, and is virtually unchanged YoY. These are well paying jobs that are the backbone of the affluent portion of th middle class. They have never been at this level YoY without a recession occurring:


In summary, we have several sectors - the manufacturing work week, temporary help, professional and business jobs, and truck transportation - that are consistent with an oncoming recession right now. There are several others - manufacturing and residential construction - which are flat, but have not turned down as they frequently have in advance of recessions. And finally, there are several sectors - overall construction and goods production - which are in expansion mode.

As I wrote in the context of the personal income and spending report last week, with interest rates still elevated, I am paying particular attention to real spending on goods, as a short leading harbinger for whether weakness will spread further into the economy.

Saturday, December 9, 2023

Weekly Indicators for December 4 - 8 at Seeking Alpha


 - by New Deal democrat


My Weekly Indicators post is up at Seeking Alpha.

The coincident data keeps getting better and better, while interest rates remain very negative. The question, as it has been for months, is whether those interest rates finally case the short leading indicators to roll over.

As usual, clicking over and reading will bring you up to the virtual moment as to the economy, and reward me a little bit for my efforts.

Friday, December 8, 2023

November jobs report: signs of considerable strength, but warning signs of considerable weakness as well


 - by New Deal democrat


Yesterday I wrote that “In tomorrow’s jobs report, my focus will be on whether the data is most consistent with a “soft landing,” i.e., no further deterioration, or whether deceleration has been continuing;” and more specifically: 
  • .My expectation, based on real consumer spending, is that there is likely to be further deceleration in jobs gains compared with the last 6 month average of 205,000, 
  • either a steady unemployment rate of 3.9% with a possible 0.1% increase to 4.0%. 
  • Based on the leading relationship of the quits rate to average hourly earnings, I expect YoY wage growth to remain steady at 4.4%, or to decline slightly further to 4.3%.


Two of the three came to pass. The six month average of jobs gained declined to 186,000, and average hourly wages for nonsupervisory workers declined to 4.3%. But the unemployment rate declined -0.2% to 3.7%

Here’s my in depth synopsis.


HEADLINES:
  • 199,000 jobs added (169,000 ex-returning strikers). On a YoY basis, jobs are up 1.8%.
  • September was revised further downward, by -29,000, while October remained unchanged.  This continues the pattern of downward revisions that we have seen all year except for two months ago. The 3 month moving average remained at 204,000  The June-August average of 167,000 remains the low.
  • Private sector jobs increased 150,000 (120,000 ex-strike). Government jobs increased by 49,000. Excluding the UAW strike, June-s 104,000 remains the low.
  • The alternate, and more volatile measure in the household report, which declilned* by -348,000 in October, rebounded by 747,000 in November. The YoY% gain in this report is +2.2%.
  • The U3 unemployment rate fell -0.2% to 3.7%. The civilian labor force, the denominator in the figure, rose (by 532,000), and the numerator, the number of unemployed, declined (by -215,000).
  • The U6 underemployment rate declined  -0.2% to 7.0% (still 0.5% above its low set in December 2022).
  • Further out on the spectrum, those who are not in the labor force but want a job now declined -49,000 to 5.324 million, vs. its post-pandemic low of 4.925 million set this past March.

Leading employment indicators of a slowdown or recession

These are leading sectors for the economy overall, and help us gauge how much the post-pandemic employment boom is shading towards a downturn.  These were mixed:
  • the average manufacturing workweek, one of the 10 components of the Index of Leading Indicators, declined -0.1 hours to 40.6, equal to its lows earlier this year and down -0.9 hours from its February 2022 peak of 41.5 hours.
  • Manufacturing jobs rose 28,000 (but declined -2,000 ex-strike).
  • Within that sector, motor vehicle manufacturing jobs rose +30,000 (including the returning strikers). 
  • Construction jobs increased by 2,000.
  • Residential construction jobs, which are even more leading, declined by -1,700. There had been a sharp rebound in the prior three months, but January remains the peak for this sector.
  • Goods jobs as a whole rose 29,000 to a new expansion high (but were down -1,000 ex-returning strikers). These should decline before any recession occurs. They remain up 1.1% YoY,, which is an average pace compared with most of the last 40 years.
  • Temporary jobs, which have generally been declining late last year, declined again, by -13,600, and are down about -240,000 since their peak in March 2022.
  • the number of people unemployed for 5 weeks or fewer declined -200,000 to 2,068,000.

Wages of non-managerial workers
  • Average Hourly Earnings for Production and Nonsupervisory Personnel increased $.12, or +0.4%, to $29.68, a YoY gain of +4.3%. This is the lowest since June 2021.

Aggregate hours and wages: 
  • the index of aggregate hours worked for non-managerial workers rose +0.4%, and is up 1.3% YoY, a sharp rebound from last month.
  •  the index of aggregate payrolls for non-managerial workers rose less than 0.9%, and is up 5.7% YoY, and increase of 0.5% from one month ago and a three month high. This is 2.5% above the most recent inflation rate, meaning average working class families have more buying power.

Other significant data:
  • Leisure and hospitality jobs, which were the most hard-hit during the pandemic, rose 40,000, which is still -158,000, or -0.9% below their pre-pandemic peak.
  • Within the leisure and hospitality sector, food and drink establishments rose 38,300, which is about 45,000 above their pre-pandemic peak.
  • Professional and business employment declined -9,000. These tend to be well-paying jobs, With revisions, this series has been declining, by -46,000 since May, and is currently up 0.8% YoY, its lowest YoY gain since March 2021. For the entire 80+ year history of this series, any YoY gain this low only occurred during recessions.
  • The employment population ratio rose 0.3% to 60.5%, vs. 61.1% in February 2020.
  • The Labor Force Participation Rate rose 0.1% to 62.8%, vs. 63.4% in February 2020.


SUMMARY

This month’s report, like last month’s was affected by the UAW strike. But, as if often the case, the establishment report (which gives us job gains and losses in various sectors) and the household report (which gives us the un- and under-employment rates) told very different stories.

The household report was as excellent as last month’s report was bad. All of the losses in October were made up, or more, in November. More people entered the labor force, and more of them found jobs. Like weekly initial claims, short term unemployment declined (i.e., there were fewer layoffs), and there were fewer discouraged job-seekers.

But the establishment report contained some warnings. Once we back out returning strikers, manufacturing employment declined, as did residential construction, and more broadly goods producing jobs, as well as temporary employment. In other words, every sector that I would expect to roll over before a recession, with the exception of total construction employment, has now done so. Perhaps just as ominously, as noted above the decline in professional and business employment similar to the last 6 months over the entire 80+ year history of the series has only occurred at the onset of recessions.

On the other hand, aggregate hours and payrolls had big increases this month. Most importantly, until real, inflation-adjusted payrolls decline significantly, I would not expect any recession to begin.

In conclusion, this was a very mixed report, with some signs of considerable strength, and others of considerable weakness. There is no contraction - but there is no strong expansion either.

Thursday, December 7, 2023

Initial claims continue to forecast expansion; further slight deceleration in employment, unemployment, and wages most likely tomorrow


 - by New Deal democrat

This morning we had our last look at initial jobless claims before tomorrow’s November jobs report. On a weekly basis, claims rose 1,000 to 221,000. The four week average rose 500 to 220,750. With a one week delay, continuing cliams declined 64,000 from last week’s 2 year high to 1.861 million:


While continuing claims have continued to be elevated, initial claims are right in the middle of their values for the past 2 years. 

For forecasting purposes, the YoY% changes are what is most important, and there, initial claims were up only 1.9%, and the four week average up 2.8%, while continuing claims were up a much higher 19.4% (which is nevertheless the lowest YoY% increase in the past 6 months):


Since even the yellow flag warning is a 10% increase in initial claims YoY, this forecasts continued economic expansion in the immediate months ahead.

Since the first leads the second, this is confirmed by updating the comparison of monthly new jobless claims, up 3.6% YoY in November, with the unemployment rate forecast for the months ahead, which is likely to top out at 3.9%-4.0% (3.5%*1.10) and seems likely to decline from their to about 3.7%-3.8% (3.5%*1.03 to 1.05):


Remember that initial claims have historically always signaled recession before the Sahm rule, which constitutes confirmation.

In tomorrow’s jobs report, my focus will be on whether the data is most consistent with a “soft landing,” i.e., no further deterioration, or whether deceleration has been continuing. My expectation, based on the above analysis as well as real consumer spending, is that there is likely to be further deceleration in jobs gains compared with the last 6 month average of 205,000, and either a steady unemployment rate of 3.9% with a possible 0.1% increase to 4.0%. Additionally, based on the leading relationship of the quits rate to average hourly earnings, I expect YoY wage growth to remain steady at 4.4%, or to decline slightly further to 4.3%.

Wednesday, December 6, 2023

Real consumer spending forecasts continuing jobs deceleration


 - by New Deal democrat


As I’ve written many times over the years, one of the best short leading indicators for the jobs market is real consumer spending. Usually I use real retail sales. In this post I’m going to expand the analysis to real personal spending as well.


To begin with, it’s important to realize that in most recessions only real personal spending on goods (blue in the graphs below) turns down. In most recessions in the past half century, real spending on services (gold) continues to rise throughout. Here’s from 1960-1990:


And here is 1991-present:


I’ve noted recently that manufacturing plays a much smaller role in the total US economy now than it used to in the decades after WW2. As a result, it appears that for a recession to occur, it has become increasingly necessary that spending on services falter as well. The below graph shows the same information as above, but on a YoY% lelel. Note how over time real spending on services YoY has decelerated from 3%-6% to 1%-3%:


But with just a few exceptions (1987, 2002), real spending on goods turning negative YoY has been a good indicator of recessions.

So here is what real spending on goods and services has looked like in the aftermath of the pandemic:


We had a false alarm in the first part of 2022, but this year spending on goods has recovered.

Now let’s look at real spending on goods YoY (dark blue), real retail sales (light blue) and employment (red) since 1960:


Both spending series tend to track closely to one another, although real retail sales has been more volatile, and frequently turns negative a little sooner. But note that they both have an excellent track record of leading jobs data, once they turn down (and up).

Here is the post-pandemic record:


Real retail sales is still negative YoY. And not only have both series accurately forecast a continuing deceleration in jobs gains, but they continue to forecast further deceleration.

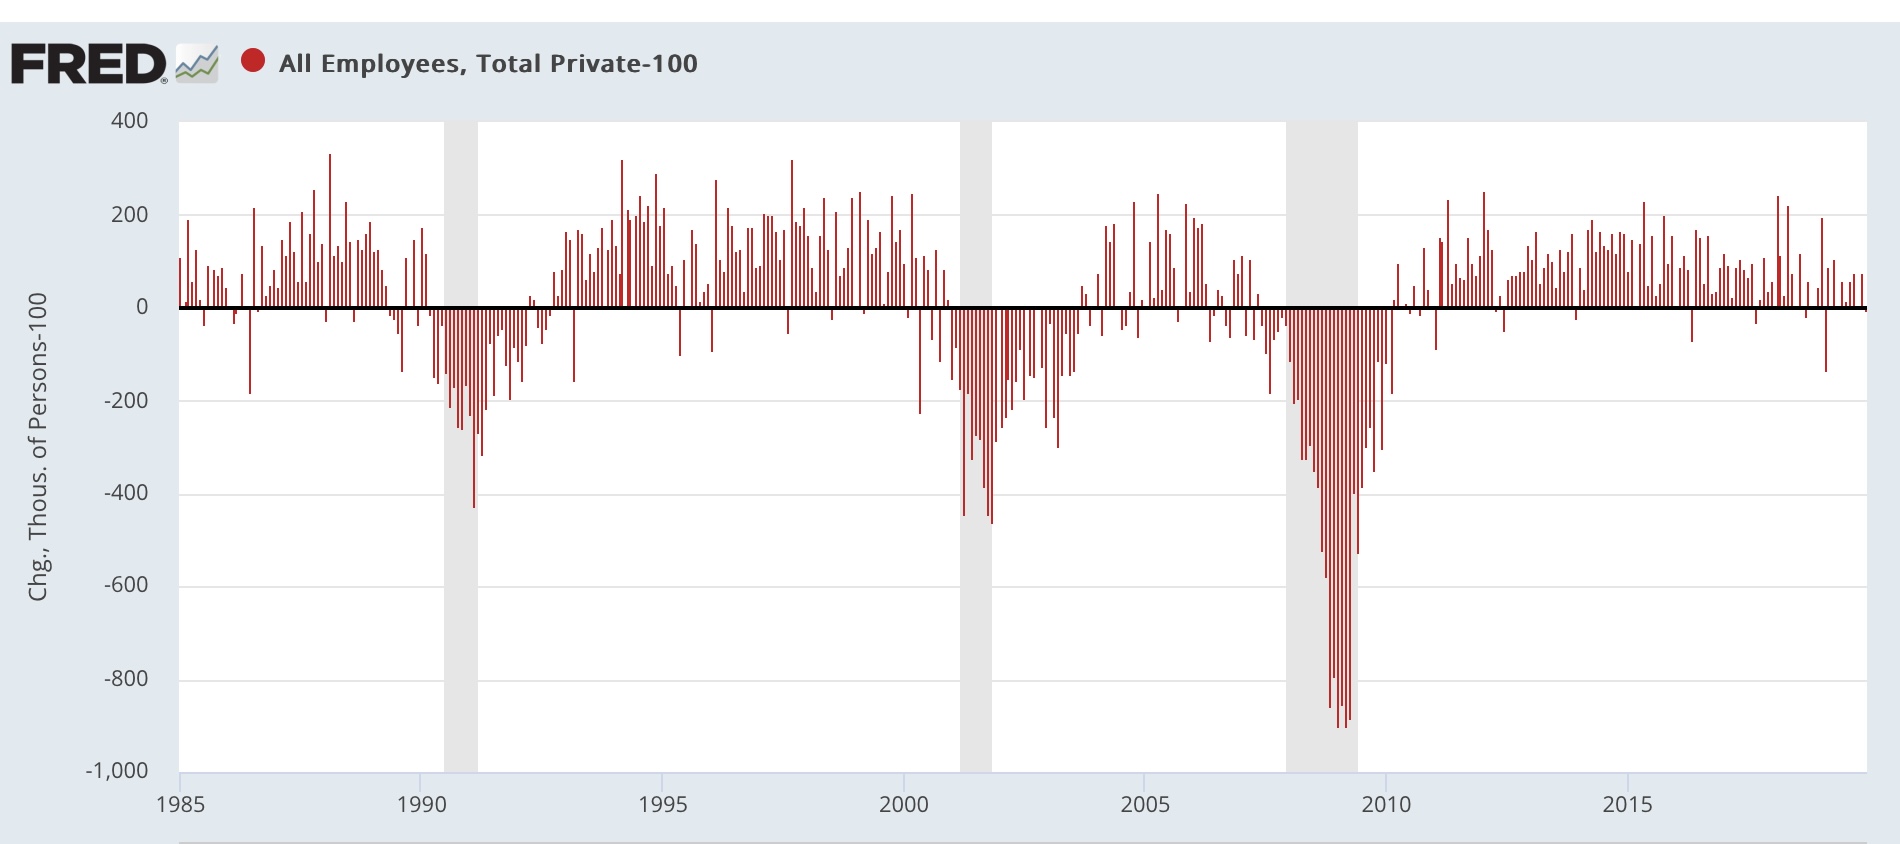
I came across a quick note earlier this week elsewhere that we might get a negative print as to private jobs this Friday. Indeed, in the past year or so not only have private jobs underperformed total employment, but they have had two readings of less thank 100,000 growth in the past five months:


Comparing this with the past forty years, even negative prints for private jobs have not necessarily forecast a recession (note below graph subtracts 100,000 so that any reading below 100,000 shows as negative). They were particularly common during the 2002-07 period, and again beginning in 2018:


Still, another print under 200,000 for total jobs (leaving aside the return of UAW workers to their jobs) looks likely, and a print under 100,000 would not be surprising at all.

Tuesday, December 5, 2023

October JOLTS report: yet one more month in the ongoing decelerating trend


 - by New Deal democrat 


All of the major metrics in this month’s JOLTS report for October continued to show deceleration. Here are openings (blue), hires (red), and quits (gold), all normed to 100 just before the pandemic:


As you can see, at 98.1 and 103.9 respectively, both hires and quits are virtually identical to where they were before the pandemic. Meanwhile job openings declined to their lowest level since early 2021, and are down 2/3’s from their post-pandemic peak towards their prior levels. The one positive is that neither quits nor hires have deteriorated signifiantly in the past three months.

Meanwhile the number of layoffs and discharges increased, although not to a new high, and the trend this year can be read as either flat or increasing:


Finally, three months ago I premiered a comparison of the quits rate (blue in the graph below) and average hourly earnings (red). This is because the former has a 20+ year history of leading the latter, which I have in the past described as a “long lagging” indicator that turns well after most other metrics. Here’s the update on that comparison for this month:


The good news is that the quits rate has held steady since July. But because wages lag, they are more likely than not going to decline YoY from last month’s 4.4% YoY growth, although holding steady or a slight increase to 4.5% can hardly be ruled out.

In conclusion, we have yet another month confirming the ongoing deceleration in the jobs market. 

Monday, December 4, 2023

A big increase holds up construction spending in October; and construction spending is holding up the economy


 - by New Deal democrat


Construction spending for October was reported last Friday, and every sector but nonresidential ex-manufacturing showed increases:


Total spending was up 0.6%, residential a sharp 1.2%, and manufacturing 0.9%. Only nonresidential ex-manufacturing declined, by less than -0.1%.

The big increase in manufacturing construction due to the Inflation Reduction Act, which has encouraged re-shoring, has helped keep total construction spending positive. But so has other non-residential construciton, as shown by this graph which norms each category to zero just before the pandemic:


On a YoY basis manufacturing is the star of the show. But note from the historical graph that residential construction previously has turned down first, with manufacturing and other non-residential construction lagging (likely because of long lead times and the extended duration of completing projects):


But as the first graph above shows, on an absolute scale manufacturing construction has been a secondary player except for the period between December of last year and May of this year, in which it accounted for almost 2/3’s of the entire gain. Since then, residential construction improvement has again moved to the fore.

Historically residential construction spending has moved generally on a coincident basis with the number of building units under construction (except that the former, of course, is affected by inflation):


The decline in building costs (gold, below) helps explain why residential building construction has not just held up, but actually increased even as a big increase in mortgage rates has caused a big decline in permits and starts:


And the fact that construction spending has improved so much is a big reason why the economy has continued to expand. With manufacturing less of a factor overall, construction is a bigger pard of the goods-producing part of the economy. Unless and until construction rolls over, therefore, it is unlikely that the economy as a whole will roll over as well.

Sunday, December 3, 2023

Weekly Indicators for November 27 - December 1 at Seeking Alpha; plus a comment on the ISM manufacturing report


 - by New Deal democrat


My Weekly Indicators post is up at Seeking Alpha.


The coincident data continues quite strong, and the long leading indicators are increasingly “less bad,” which is something that happens when recessions are beginning to ebb.

As usual, clicking over and reading will bring you up to the virtual moment as to the economy, and bring me a little bit of Holiday Cheer.

While I am at it, as noted on Friday, let me make a couple of comments about the latest ISM manufacturing report. I’m going to discuss construction spending separately in a day or two.

While both the headline and new orders numbers continued to show contraction, at 46.7 and 48.3, respectively, note that the trend in new orders in particular over the past few months is slight improvement:


The bottom line of which is, if there was no recession when the new orders index was coming in at levels under 45 earlier this year, it is unlikely that there is one now. Partly this is because the ISM survey is a diffusion index (i.e., unweighted), and so it has not been showing the relative strength in the important motor vehicle and parts manufacturing sector; and partly it is that manufacturing in the US is less a proportion of GDP than it was in the second half of the 20th century - so it takes a bigger decline to make a similar impact.

If the Fed-induced downturn in credit conditions and loan applications spreads out further into the economy, it is going to take an actual downturn in ongoing construction (of which there is scant evidence so far) to produce it.