Monday, March 10, 2025

Scenes from Friday’s jobs report: the (totally contradictory) Big Picture


 - by New Deal democrat


There is no important economic data today, so let’s take a closer look at some of the noteworthy items from Friday’s jobs report. I’ll start out with the Establishment Survey side, and then turn to the Household Survey side.


Goods producing vs. service providing

In the past, a turndown in goods producing job has always preceded a recession. Any turndown in the service sector has happened much later. So I have been focusing on the former.

In February, the goods producing side added 34,000 jobs, its best showing since June of 2023. On a YoY basis, goods producing jobs are up by 0.4%, while service providing jobs are higher by 1.4%. The below graph norms each of those levels to zero:


The pace of decline in each sector is decelerating. Whether it has stopped is very much open to question.

The norming of current YoY levels to zero was for the purpose of showing the long term historical comparisons, as below, first from 1948 to 1982:


And secondly from 1982 through 2019:


The first thing to notice is that the goods producing sector has *always* turned negative first, with the sole exception of the 1982 Volcker-induced recession, when they both turned down simultaneously. Note also that there have been 5 occasions when the goods producing sector turned negative YoY without a recession occurring. 

Second, while before 1982 the goods producing sector might not turn lower than its current YoY level until after a recession had begun, since then goods producing jobs have always been lower by about -2% more than its current level before the onset of a recession - and sometimes lower than its current YoY level for over a year.

How close are we to that? Here is the absolute level of goods producing jobs, normed to 100 as of last May:
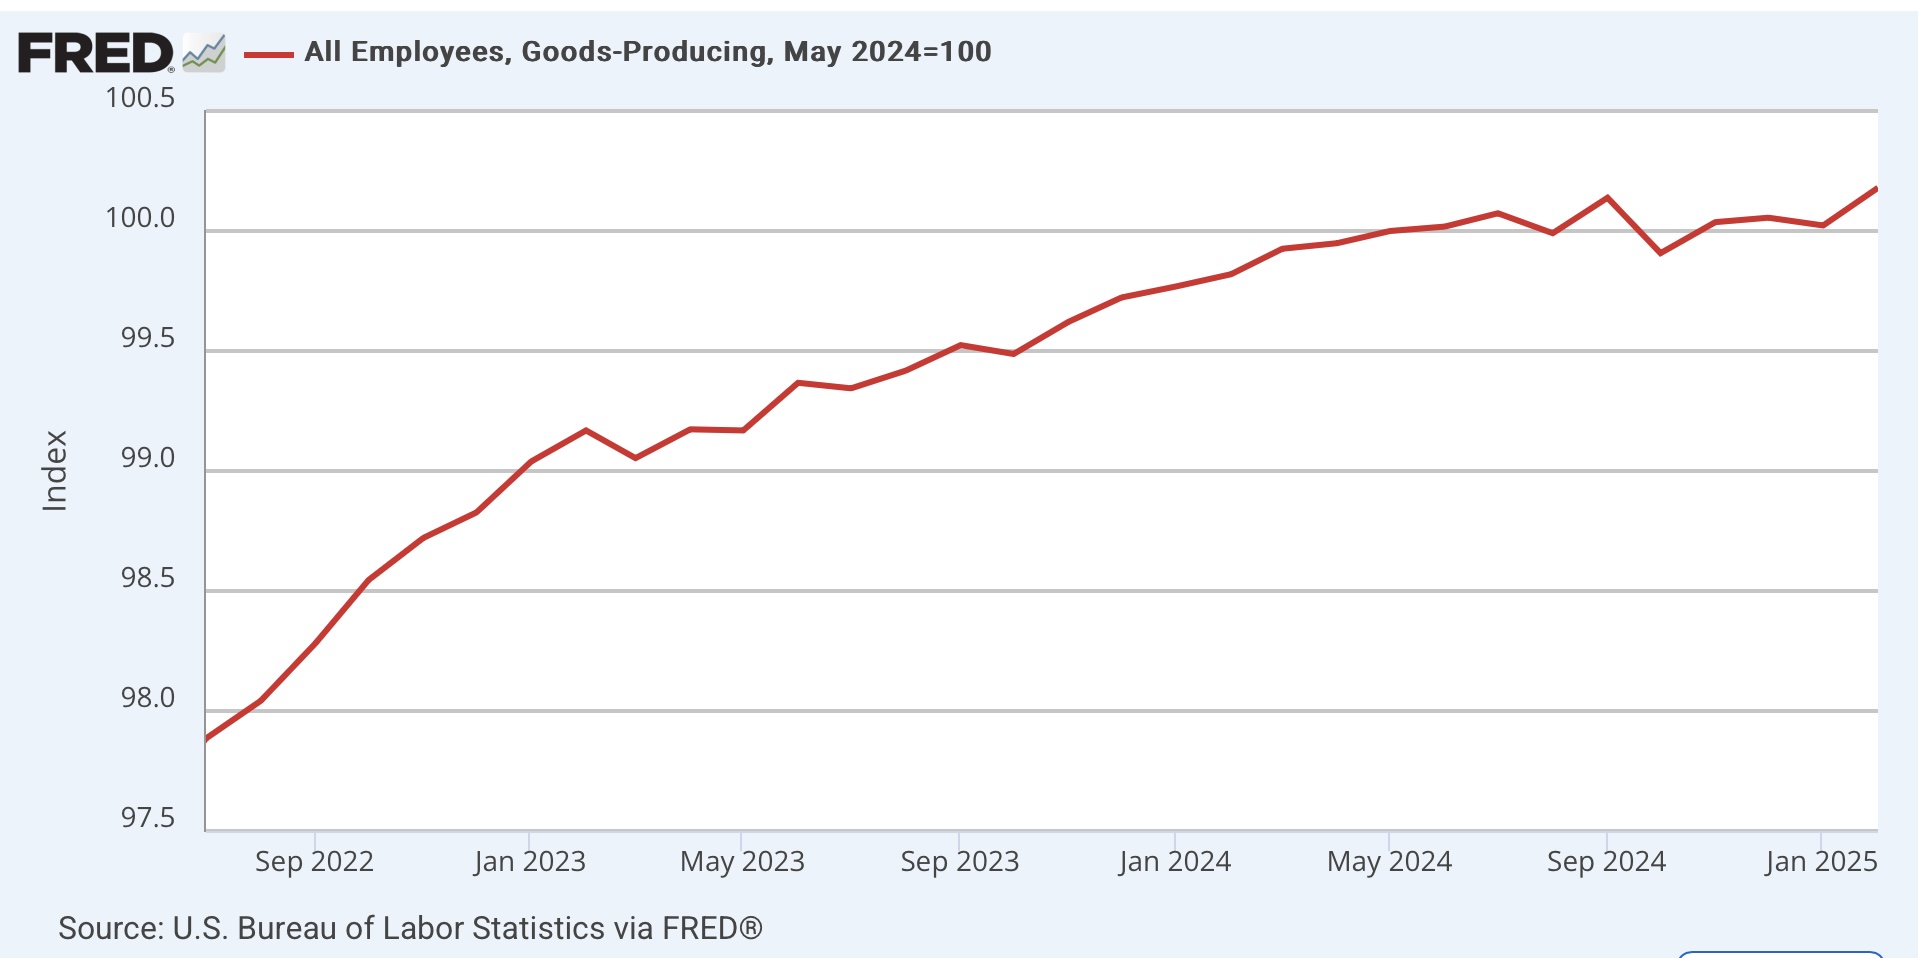


With the jump in February, this sector is higher by 0.2% than nine months ago. The most reasonable pessimistic case is that it won’t be lower YoY until at least May - and even if it turns down, it could be much longer than that.

The bottom line is that employment in the goods producing sector is not forecasting a recession any time soon.

Housing construction

There is one sub-sector that I’ve been paying particular attention to, because although I won’t bother with the graph, manufacturing jobs have been down since February of 2023. It has been construction, and specifically housing construction, which has been holding up the goods producing sector. And as I’ve recently written, although housing permits, starts, and sales turned down long ago, housing units under actual construction levitated for many months thereafter before finally turning down last year. And I pointed out that usually jobs in housing construction have typically levitated for many months after that.

And the levitation of employment in housing construction continued in February, still up by over 2.5% YoY (red, left scale in the graph below) although only 100 jobs were added (blue, right scale):


In other words, the upward trend in housing construction doesn’t even show any signs of slowing down yet. 

In summary, that’s why the Establishment report on Friday was positive. Now let’s turn to the Household survey side, which was horrible - in other words, once again it was recessionary.

Unemployment and Underemployment

The headline was that the unemployment rate ticked up by 0.1% to 4.1%, and the broader underemployment rate spiked higher by 0.5% to 8.0%, the highest level in over 3 years. 

As with the above, I am going to focus on YoY comparisons. On that basis, the unemployment rate was higher by 0.2%, and the underemployment rate higher by 0.7%. Again, for historical purposes here is that graph for the last several years, normed to zero as of the latest readings:


While the U6 underemployment levels are noisier than the unemployment rate levels, the YoY increases in each has decelerated in recent months, which is a good sign.

But now let’s look at that historically. Because the U6 data didn’t start until 1994, here is the unemployment rate YoY before than:


And now here is the record for both from 1994 until the pandemic:


With respect to the unemployment rate, while far more often than not even a 0.2% increase YoY has meant recession, there have been a number of false positives, including in the 1950s, 1960s, one month in the 1980s, and the near “double dip” in 2002.

But with respect to the underemployment rate, being higher YoY by the current level has meant recession in each case except for the 2002 near “double dip.”

But since this past month was a spike, let’s show the above graph again, this time using the average of the last 3 months, which is an increase YoY of 0.43%:


We still get the same result.

In other words, the changes in both the unemployment and underemployment rates are recessionary. But with the big caveat that they have been so for the past year or so, and no recession has happened. In other words, it looks like another false positive.

The Employment Population Ratio

I performed the same exercise with the Labor Force Participation Rate, including focusing on the prime age 25-54 rate, but to cut to the chase, it was of little value because of distortions from the entry of women into the labor force in the 1960s through the 1990s, and also due to the demographics of the Baby Boom followed by the Gen X bust, followed by the Millennial Boom.

But the employment population ratio does give meaningful information, particularly when we look at the prime age component. This declined -0.2% in February to 80.5%, which is down -0.4% from its recent peak last summer. 

Once again I looked YoY, and because this data is also noisy, I used the average the last three months, which was -0.033%. The below graph shows this data monthly (blue), and on a quarterly average basis (red):


Again, it is negative, but the pace of decline has stopped in recent months.

Now here is the entire historical look, also normed to zero as of the current 3 month average:


With the exception of several months in the 1950s, several months in 1995 and 1998, and the 4th Quarter of 2013, the current YoY decline in the prime age employment population ratio has *always* previously meant recession. But again, we have been at this level for nearly a year, and no recession has occurred - at least not yet.

I should add that I have two major concerns, one for each survey.

As to the Establishment Survey, the QCEW, which is the gold standard, on a preliminary basis indicates that employment gains last year through Q3 were about 500,000 less than currently shown. So this survey is likely to look weaker when rebenchmarked using that data - unless the preliminary QCEW data is itself revised higher.

As to the Household Survey, I remain concerned that it still is not properly accounting for the massive immigration wave of the several years immediately following the COVID pandemic. What i really mean is that the increases in the unemployment and underemployment rates, as well as the downturn in the prime age employment population ratio, might really be about recent immigrants finding it harder to gain employment than several years ago. Which means that the economy is still growing, just not fast enough to digest all of the new entrants to the market.

Sunday, March 9, 2025

The “Constitutional Interregnum”


 - by New Deal democrat


Is there anything that can be done with a President who has the support of 1/3+ one member of the Senate?  Since he can’t be impeached and convicted, which requires 2/3’s of the Sentate, and as of last July per the Supreme Court he is above the criminal law in exercising his Presidential powers, apparently not.

A President in those circumstances who decides to do whatever he wants creates a complete lapse in the Rule of Law. Josh Marshall wrote an excellent essay last week, which is very close to my thinking, describing a “Constitutional Interregnum.” Here is the gist of it in quotes:

[C]ivic democrats in the US have far too great an essentialism about the law and constitutional jurisprudence, especially under the corrupted federal judiciary as it now exists. 

[For example,] Trump v. United States … isn’t a decision I disagree with. It’s simply wrong. . . .  [W]e must disengage from the idea that this is what the law is. It’s not. These are fraudulent decisions. 

We are living in a moment in which the system of legal, interpretive legitimacy has fatally broken down. It’s been in its death throes for a decade. Now it’s no longer operating at all. That throne is empty of anything that commands our allegiance or claims to legitimacy. . . .  [W]e are in this period of interregnum in which we are grappling with a renegade, corrupt court operating outside the constitutional order as well as a renegade and lawless president.

Fundamentally, it means grappling with the corruption rather than living within it, living within its ideas and ground assumptions and perforce being softly governed by them.

There are good odds the final decisions in the courts [concerning the actions of T—-p and DOGE] will themselves be corrupt and unconstitutional, at least in part.

The fact that we’re operating way outside the express text and logic of the Constitution, and no president in history has thought any of this stuff was possible . . . . We’re waiting to see if the courts will follow the Constitution. And there’s a good chance they won’t.

We’re embarked on a vast battle over the future of the American Republic, in which the executive and much of the judiciary is acting outside the constitutional order.

 In a similar vein, citing John Locke, Johann Neem has argued:

Our republic is quickly becoming a tyranny. Should that happen, we should remember that we have not pledged allegiance to any regime but to a republic. If the republic falls, our pledge does not oblige us to transfer our allegiance to what replaces it. Indeed, it may require us to oppose it.

’Where-ever law ends, tyranny begins,’ Locke wrote in his Second Treatise on Government. . . . . Locke sought to find a way to resist a ruler who comes to power constitutionally but threatens that very constitution.


According to Locke, when a ruler demonstrates their disregard for the constitutional order, they lose legitimacy; we can treat them as we would a ‘thief and a robber.’ …. [W]hen ‘whosoever in authority exceeds the power given him by the law and makes use of the force he has under his command, to compass that upon the subject, which the law allows not, ceases in that to be a magistrate; and, acting without authority, may be opposed, as any other man, who by force invades the right of another.’


There are a few ways in which we are still operating, at least formally, within Constitutional bounds. 


In the first place, T—-p has not openly defied any Court orders, although there are suggestions that his appointees may have ignored several.


Secondly, and perhaps even more importantly, he has not openly defied Congress either. Rather, he is operating with the tacit approval of majorities in both the House and the Senate, who have simply chosen to ignore the intrusions on their power. Presumably at some point T—-p could cross a “red line” where they would object. But if Congress’s supine reaction is also driven by the fear of physical threats from T—-p’s brownshirts, then we are already beyond Constitutional checks and balances.


There have been some similar periods in the past. For example, it wasn’t clear at all that Jefferson had the right to make the Louisiana Purchase without Congressional approval. Congress looked the other way, and at some point retroactively agreed to it. Andrew Jackson famously defied the Supreme Court’s decision that the Cherokee Nation could not be forcibly uprooted from its land. Abraham Lincoln suspended habeas corpus, and argued that Dred Scot was not the law of the land, vs. only binding the litigants in that case. And FDR’s New Deal, which was struck down on many occasions by the Supreme Court before 1938, was enacted by an enthusiastic Congress.


But all of those pale in comparison with the present President for all intents and purposes declaring himself an omnipotent king. And since he has control of the armed forces and the US Marshals, it is not clear that any Congressional act, or any Judicial decision, could be enforced against him short of the use of actual physical force. The idea that we are in a period of Constitutional Interregnum appears well founded.


Saturday, March 8, 2025

Weekly Indicators for March 3 - 7 at Seeking Alpha


 - by New Deal democrat


My “Weekly Indicators” post is up at Seeking Alpha.

The malign and moronic “policies” of the 2nd T—-p Administration so far have driven Economic Policy Uncertain to all time record highs:

But despite that, the rumblings under the surface of the data have been quite minor so far. There are changes in the Treasury yield curve, stock market, jobless claims, commodity prices, and the US$. But aside from the first two, the moves have not been significant, and haven’t been enough to move the overall needle.

As usual, clicking over and reading will bring you up to the virtual moment as to the state of the economy, and reward me with a couple of pennies for organizing it all and presenting it to you.

Friday, March 7, 2025

February jobs report: weak employment gains, but some 3+ year highs in unemployment metrics


 - by New Deal democrat


My question over the past year has been whether “decleration” would turn into “deterioration.” For a “soft landing,” deceleration would need to end, and the numbers stabilize, vs. continuing to deteriorate towards an actual downturn. 

The verdict this month was mixed. On the employment side, YoY job gains have been relatively stable for the past six months, as has the three month average. But on the unemployment side, there were a number of poor readings at 3+ year highs. Additionally, real aggregate payroll growth shows continuing signs of a marked slowdown.

Below is my in depth synopsis.


HEADLINES:
  • 151,000 jobs added. Private sector jobs increased 140,000. Government jobs increased by 11,000. Noteworthily, federal jobs decreased -11,000. The three month average was an increase of +200,000.
  • The pattern of downward revisions to previous months, which was broken last month, resumed ever so slightly this month. December was revised upward by 16,000, while January was revised downward  by -18,000, for a net decrease of -2,000.
  • The alternate, and more volatile measure in the household report, showed a decrease of -588,000 jobs. On a YoY basis, this series increased 2,294,000 jobs, or an average of 191,000 monthly.
  • The U3 unemployment rate rose 0.1% to 4.1%. Since the three month average is 4.067% vs. a low of 3.733% for the three month average in the past 12 months, or an increase of less than 0.4%, this means the “Sahm rule” remains off the table. 
  • The U6 underemployment rate rose sharply, by 0.5%, to 8.0%, its highest level since October 2021, and 1.6% above its low of December 2022.
  • Further out on the spectrum, those who are not in the labor force but want a job now also rose a sharp 414,000 to 5.893 million, the highest number in over three years, vs. its post-pandemic low of 4.925 million in early 2023.

Leading employment indicators of a slowdown or recession

These are leading sectors for the economy overall, and help us gauge how much the post-pandemic employment boom is shading towards a downturn. This month they were generally positive:
  • the average manufacturing workweek, one of the 10 components of the Index of Leading Indicators, rose 0.2 hours to 40.8 hours, This remains down -0.7 hours from its February 2022 peak of 41.5 hours, and is tied with last May and December for the highest reading over the past 12 months.
  • Manufacturing jobs increased 10,000. Nevertheless this series is firmly in decline, as the three month average is the lowest since mid year 2022.
  • Within that sector, motor vehicle manufacturing jobs rose 8,900.
  • Truck driving decreased -1,900.
  • Construction jobs increased another 19,000.
  • Residential construction jobs, which are even more leading, rose by a mere 100 to another new post-pandemic high.
  • Goods producing jobs as a whole increased 34,000, and made their first post-pandemic new high since last September. This is especially important, because these typically decline before any recession occurs. On a YoY% basis, these jobs are only up 0.4%. Nevertheless, only during the 1985-86 slowdown and for 3 months during the 1990s and 2000s have manufacturing jobs had this anemic a YoY increase without a recession occurring. 
  • Temporary jobs, which have declined by over -550,000 since late 2022, declined by another -12,300. But this month remained above their October 2024 low, so this may still suggest that the bottom in this metric is in. 
  • the number of people unemployed for 5 weeks or fewer rose 47,000 to 2,337,000, vs. its 12 month high of 2,465,000 last August.

Wages of non-managerial workers
  • Average Hourly Earnings for Production and Nonsupervisory Personnel increased $.09, or +0.3%, to $30.89, for a YoY gain of +4.1%, the highest in three months, but right in line with its average YoY% gain since last April. Importantly, this continues to be well above the 2.9% YoY inflation rate as of 3.0% last month.

Aggregate hours and wages: 
  • The index of aggregate hours worked for non-managerial workers rose 0.2%, and is equal to its post-pandemic peak set in December This measure is also up 1.1% YoY, right in line with its average for the past 12 months. 
  • The index of aggregate payrolls for non-managerial workers rose 0.4%, but is up 5.1% YoY, slightly above its average YoY rate in the past 12 months. On the other hand - importantly - adjusted for inflation this series will probably only be up 0.3% +/-0.1% since last September, indicating at least a slowdown in the ability of households to increase consumption.

Other significant data:
  • Professional and business employment declined -2,000. These tend to be well-paying jobs. This series has been down YoY since September 2023, and is now -0.4% YoY, which in the past 80+ years - until now - has almost *always* meant recession. 
  • The employment population ratio declined -0.2% to 59.9%, vs. 61.1% in February 2020.
  • The Labor Force Participation Rate decreased -0.2% to 62.4%, vs. 63.4% in February 2020.


SUMMARY

This was a mixed but generally weak report. While the number of net jobs increased, and also increased in most of the leading sectors, most importantly at present in residential building construction and goods production as a whole, the numbers were not strong. The big weakness was on the unemployment side, where the unemployment rate, underemployment rate, number of newly unemployed, and those not in the labor force who want a job all increased sharply. The employment to population ratio and the labor force participation rate also declined.

Hours worked rose, but not by much; and both hourly wages and aggregate payrolls likely did little better than keeping even with inflation, although we won’t know that for sure until next week. Most concerning is the likely slowdown in aggregate real payrolls in the past five months.It isn’t negative, but it could indicate that a peak is forming.

So again, the verdict is “positive but weak.”

Thursday, March 6, 2025

Jobless claims decline back into neutral territory


 - by New Deal democrat


After last week’s big jump, this week initial jobless claims declined -21,000 to 221,000. The four week moving average increased 250 to 224,250. With the typical one week delay, continuing claims rose 42,000 to 1.897 million:


On the more important YoY basis for forecasting purposes, initial claims were higher by 5.2%, the four week moving average was up 7.6%, and continuing claims were up 5.7%:


After last week, I think all observers were waiting to see if Federal employee layoffs would drive this series further into negative territory. This week, at least, they did not. These are all “neutral” readings, suggesting a somewhat sluggish but still growing economy.

Finally, since this week’s jobless claims feed into the March rather than February average, they do not affect the latest monthly average of claims. Thus the leading indicator for the unemployment rate in tomorrow’s jobs report remains the same as last week:


Which means that the conclusion is also the same as last week, to wit:   On a monthly basis initial claims are up 7.0% YoY, and initial + continuing claims together are up 10.4%. Since one year ago the unemployment rate was 3.8%, for the first time in many months this suggests upward pressure on the unemployment rate, since 3.8%* 1.07 and *1.10 indicates an unemployment rate of 4.1% or 4.2%, vs. last month’s 4.0%.

Wednesday, March 5, 2025

Economically weighted ISM indexes for February indicate continued slow growth


 - by New Deal democrat


Because manufacturing is now of much less importance to the economy than in the decades before the Millennium, I now use a weighted average of the ISM services index (75%) as well as manufacturing (25%) as the primary forecasting tool. This economically weighted average, especially over a three month period, has been much more accurate since 2000.

In February the expansionary readings in the ISM services report continued, with the total index coming in at 53.5, and the more leading new orders subindex at 52.2. These aren’t strong, but they are expansionary. The three month weighted average of each was 53.4 and 52.6 respectively.

Here is a graph of both the headline number (blue) and the new orders subindex (gray) for the past three years:


It is interesting that the new orders component appears to be in a continued slight downtrend, but there is no indication that it will be below 50.0 and thus indicating contraction soon.

More importantly, since the three month total average in the manufacturing index was 50.1, and for the new orders subindex 51.9, that means the three month economically weighted average for the manufacturing and non-manufacturing indexees is 52.6 for the headline, and 52.4 for new orders.

In short, the economically weighted average of the two ISM indexes continues to forecast growth, if at somewhat a slow pace, in the months ahead.


Tuesday, March 4, 2025

Important changes in trend in the bond and stock markets, and a note on GDP estimates as well


 - by New Deal democrat


There’s no important economic data today, so this is a good time to write about several important developments in the stock and bond markets.


First of all, as many of you may already know, a portion of the US Treasury yield curve, between the 10 year and 3 month Treasuries, re-inverted last week. Here’s what that looks like (dark blue), plus the similar pattern as to the Fed funds rate (light blue):


I put up a post over at Seeking Alpha about how this is not uncommon, and what it means going forward (hint: not so good).

Secondly, especially with the Administration’s latest geopolitical and economic moves, there’s been a little excitement over at the stock market as well. Below is a graph of the S&P 500 Index normed to 100 as of November 1, 2023. I’ve put a line through the level as of November 6, one day after the Election:


As you can see, in the year before the Election, stock prices had increased nearly 40%. That is a huge bull move. While there was a 4% spurt higher on the day after the Election, and several new all-time highs, most recently on February 19, the overall trend in the four months since Election Day has been flat. In fact, yesterday during the day they briefly made a new 3 month low. Should such a low be made at the close of the trading day, that would break the long term uptrend.

UPDATE: The S&P 500 did tumble to a new 3+ month low on the close today, at 5778.15. This breaks the uptrend of the past two years.

There’s also been quite the hubbub in the last few days - particularly by political activists - about the negative GDP prints in the Atlanta Fed’s “nowcast” series, as below:


I suggest taking this with more than a few grains of salt.

The Atlanta Fed’s nowcast of quarterly GDP is an ongoing estimate that changes with each new data point, and can vary widely between the beginning of the Quarter and the end. For sxample, here is the nowcast’s record from Q3 2022, at a time when many observers were predicting a recession:


Note that at the end of August, with only one month to go in the Quarter, it was “nowcasting” a GDP print of nearly 3%. Three weeks later it was barely above 0%. 

What actually happened? It was first reported as up 2.6%, and after many revisions, it is presently reported to have been 2.7%.

Even when the nowcast gets it “right,” as it did last Quarter, there is still a lot of variation in the estimate over the course of the three months:


The bottom line is that it would not be surprising at all if the Atlanta Fed’s nowcast rebounded in the next month just as sharply as it declilned in the last week. 

The most up to the moment forecasting tool I have is the “quick and dirty” model using the YoY% changes in stock prices and (inverted) initial jobless claims:


While the four week average of jobless claims is higher - but by less than the 10% necessary for me even to consider it a “yellow flag,” even after their 5% sell-off, stock prices are still higher by 14% YoY. The upturn in claims, and downturn in stocks, must get considerably worse for me to issue a “recession watch,” let alone a “warning.”

It is important to note that sometimes the main factors affecting the economy are intrinsic to it, like wage gains or commodity prices. But there are also individual (or small group of) actors with singular economic power, and the decisions they make can have immediate or nearly immediate impacts on the situation. That was the case with the OPEC price hikes of the 1970s, and Paul Volcker’s single-handed ratcheting up of interest rates that caused the 1981 “double dip” recession. 

The new Administration is behaving like the proverbial “bull in a china shop,” in a way it did not in 2017, because at that time T—-p did not know how to use the levers of economic power available to the President. This time around he does, and is ignoring Congress, and previous laws and appropriations passed by it, right and left. Many voters in 2024 probably expected that a 2nd T—-p Administration would look like the 1st, which was a traditional GOP Administration when it came to the economy. Obviously that is not going to be the case.

I am going to continue to look at the data (which hopefully will remain reliable for a long enough time), and not go further than what it tells me in terms of forecasting the near term trend going forward in the economy.

Monday, March 3, 2025

ISM manufacturing index and construction spending report paint a picture of a goods producing sector that is no longer expanding


 - by New Deal democrat


Although manufacturing is of diminishing importance to the economy, (it was in deep contraction both in 2015-16 and again in 2022 without any recession), the ISM manufacturing index remains an important indicator with a 75+ year history of accurately describing that sector and forecasting it over the short term. 

Any number below 50 indicates contraction. The ISM indicates that the number must be 42.5 or less to signal recession. I use an economically weighted three month average of the manufacturing and non-manufacturing indexes, with a 25% and 75% weighting, respectively, for forecasting purposes.

The last few months may have an additional confounding factor in that after the Election, most businesses likely figured that the new Administration would be laying more tariffs, and may well have been in a rush to get their orders in ahead of time.

This probably figured into the fact that the ISM report for January was the strongest since the second half of 2022. And now in February the Index has fallen back. Specifically, the total index fell -0.6 to 50.3, and the more leading new orders subindex fell from its very strong January reading of 55.1 back into contraction at 48.6, the lowest reading in four months.

Here is a look at both the total index and new orders subindex since the Great Recession:


Including this month, here are the last six months of both the headline (left column) and new orders (right) numbers:

SEP 47.2. 46.1
OCT 46.5. 47.1
NOV  48.4. 50.4
DEC 49.2. 52.1
JAN 50.9  55.1
FEB  50.3  48.6

The current three month average for the total index is 50.3, and for the new orders subindex 51.9.

The surge and then retreat in new orders in particular certainly looks like front-running potential tariffs. The regional Fed manufacturing reports will take on added significance this month to see if they confirm whether that is the case.

For the economy as a whole, the weighted index of manufacturing (25%) and non-manufacturing (75%) indexes is more important. Since the latter has been very positive in the past few months, the combined indexes have suggest continued growth in the months ahead. The non-manufacturing index will be reported on Wednesday.

Meanwhile, construction spending declined as well in the latest report, which was for January. Total spending fell -0.2% and residential spending fell -0.5%. Both of these have been close to flat in the past twelve months:


After declining slightly during the first nine months of 2024, the prices of construction materials have increased in the past few months:


Finally, the boom in manufacturing construction that followed the Inflation Reduction Act has also flattened:


Construction spending isn’t declining in any significant way, but it is no longer increasing either.

Together, this morning’s ISM and construction spending reports paint the picture of the goods producing sector of the economy that is not contracting, but is also no longer expanding.


Saturday, March 1, 2025

Weekly Indicators for February 24 - 28 at Seeking Alpha


 - by New Deal democrat


My “Weekly Indicators” post is up at Seeking Alpha.

Last week I wrote that exogenous factors - like political decisions - could have nearly simultaneous effects across all timeframes of indicators. In other words, the long and short leading indicators as well as the coincident indicators, could all react at the same time.

This week there was evidence of exactly that.

As usual, clicking over and reading will bring you up to the virtual moment as to the state of the economy, and reward me a little bit for organizing the data for you.

Friday, February 28, 2025

January income and spending show unresolved seasonality in a typical late cycle configuration


 - by New Deal democrat


There were two important points in this morning’s personal income and spending report for January. The first is that there appears to be some unresolved seasonality at work. The second is that nevertheless both were weaker than one year ago.

Nominally personal income rose 0.9%, while spending declined -0.2%. Since the deflator increased 0.3%, real income rose 0.6%, and real spending declined -0.4%. Income was a new record high, while spending obviously pulled back:


But a look at the monthly comparisons for the last several years shows that the sharpest increase in real income all last year was also in January, up 0.9%, and the sharpest decrease in real spending was also in last January, down -0.3%:


This strongly hints at unresolved seasonality.

On a YoY basis, the chain type price deflator (blue) was up 2.5%, average for the past six months. Indeed (not shown) since last April prices are up 1.5% for a 2.1% annualized rate over the past nine months. Decomposing the price deflator shows that for goods the index rose a sharp 0.5% for the month, while for services it rose 0.3%. On a YoY basis, the index for services (gold) rose 3.4%, the lowest such increase since March 2021, while for goods (red) it rose 0.6%, the biggest increase since September 2023:


This points to the end of the deflationary period in commodities as being the underlying reason why the PCE inflation index has not declined further since early 2024.  While I won’t bother with the graph this month, despite the decrease in YoY inflation in services consumption, the number is high compared with the 30 years before the pandemic. As I wrote last month, it is noteworthy that goods inflation increasing, and services inflation remaining elevated, is a typical late cycle configuration.

More evidence for residual seasonality was that the personal saving rate jumped from 3.5% to 4.6% on a month over month basis. As the graph below shows, the very same jump happened in January of last year:


Ordinarily I would consider such a jump as a potential precursor to recession, showing an increase in consumer caution, but compared with last January’s rate of 5.5%, the suggestion is that the real trend is a continued slow decline in saving - again, a typical late cycle phenomenon. In other words, as expansions continue, consumers get further out over their skis, and so more vulnerable to an adverse shock.

Some good news was that real income less government transfers, one of the metrics that the NBER looks at to determine economic expansions vs. recessions, increased by 0.3% in January to another new high:


Finally, the PCE price index is used to calculate real manufacturing and trade sales (with a one month lag), another metric used by the NBER to determine if the economy is in recession or not. These jumped 0.7% in December, continuing their post-pandemic uptrend:


Because of the apparent unresolved seasonality in the January numbers, I think we have to turn to the YoY trends for more insight this month. These show continued but decelerating growth in both income and spending, as well as a likely continuing ebbing of the saving rate. Prices of goods are firming and picking up, while services remain elevated. This continues to be a typical late cycle type of configuration.

Thursday, February 27, 2025

The end of “steady as she goes” in jobless claims?


 - by New Deal democrat


This week’s report on initial jobless claims was of particular interest, because of the issue of whether Federal employees laid off by the new Administration would cause an increase. It appears they did.


Initial jobless claims rose 22,000 for the week to 242,000, and the four week moving average rose 8,500 to 224,000. With the typical one week delay, continuing claims declined -5,000 to 1.862 million:


As you can see from the above graph, initial claims tied for the second highest weekly number in the past six months. A preliminary check of the state by state data indicates that there was a sharp increase in claims in Washington DC, but that would only marginally increase the weekly number. There was also a significant increase YoY in Virginia, but not in Maryland. So as an initial matter it appears that the Federal layoffs were only a part of this increase.

The sharp increase also showed up in the YoY% changes, which are more important for forecasting purposes. There, initial claims were up 13.6% YoY, the four week average up 7.0%, and continuing claims up 3.2%:


Of note, the average of the last two weeks in initial claims is +11.3% YoY.

These numbers are still neutral for forecasting purposes, since the four week moving average is more important than the noisy weekly numbers. But as per the above, that could change as early as next week.

Finally, let’s update our look at what this suggests about the unemployment rate in the months ahead, since initial claims in particular have a very long record of leading the unemployment rate:


On a monthly basis initial claims are up 7.0% YoY, and initial + continuing claims together are up 10.4%. Since one year ago the unemployment rate was 3.8%, for the first time in many months this suggests upward pressure on the unemployment rate, since 3.8%* 1.07 and *1.10 indicates an unemployment rate of 4.1% or 4.2%, vs. last month’s 4.0%.