- by New Deal democrat
There is no important economic data today, so let’s take a closer look at some of the noteworthy items from Friday’s jobs report. I’ll start out with the Establishment Survey side, and then turn to the Household Survey side.
Goods producing vs. service providing
In the past, a turndown in goods producing job has always preceded a recession. Any turndown in the service sector has happened much later. So I have been focusing on the former.
In February, the goods producing side added 34,000 jobs, its best showing since June of 2023. On a YoY basis, goods producing jobs are up by 0.4%, while service providing jobs are higher by 1.4%. The below graph norms each of those levels to zero:

The pace of decline in each sector is decelerating. Whether it has stopped is very much open to question.
The norming of current YoY levels to zero was for the purpose of showing the long term historical comparisons, as below, first from 1948 to 1982:

And secondly from 1982 through 2019:

The first thing to notice is that the goods producing sector has *always* turned negative first, with the sole exception of the 1982 Volcker-induced recession, when they both turned down simultaneously. Note also that there have been 5 occasions when the goods producing sector turned negative YoY without a recession occurring.
Second, while before 1982 the goods producing sector might not turn lower than its current YoY level until after a recession had begun, since then goods producing jobs have always been lower by about -2% more than its current level before the onset of a recession - and sometimes lower than its current YoY level for over a year.
How close are we to that? Here is the absolute level of goods producing jobs, normed to 100 as of last May:
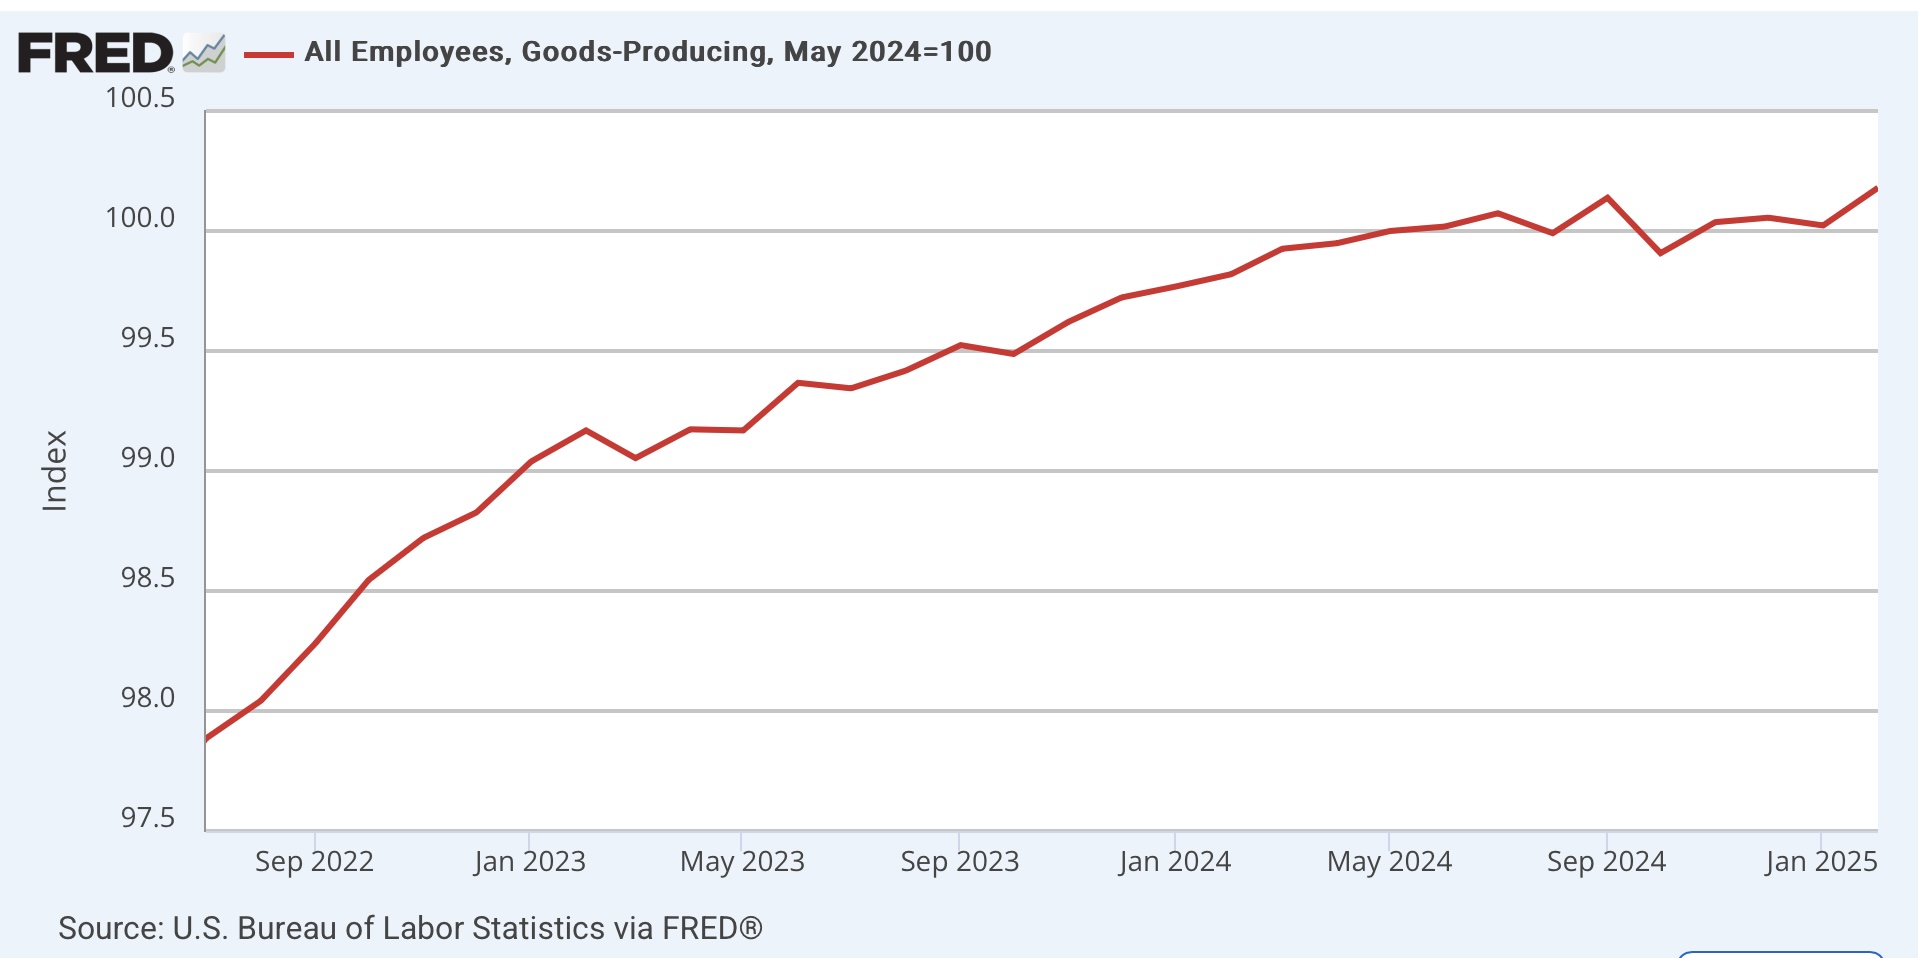
With the jump in February, this sector is higher by 0.2% than nine months ago. The most reasonable pessimistic case is that it won’t be lower YoY until at least May - and even if it turns down, it could be much longer than that.
The bottom line is that employment in the goods producing sector is not forecasting a recession any time soon.
Housing construction
There is one sub-sector that I’ve been paying particular attention to, because although I won’t bother with the graph, manufacturing jobs have been down since February of 2023. It has been construction, and specifically housing construction, which has been holding up the goods producing sector. And as I’ve recently written, although housing permits, starts, and sales turned down long ago, housing units under actual construction levitated for many months thereafter before finally turning down last year. And I pointed out that usually jobs in housing construction have typically levitated for many months after that.
And the levitation of employment in housing construction continued in February, still up by over 2.5% YoY (red, left scale in the graph below) although only 100 jobs were added (blue, right scale):

In other words, the upward trend in housing construction doesn’t even show any signs of slowing down yet.
In summary, that’s why the Establishment report on Friday was positive. Now let’s turn to the Household survey side, which was horrible - in other words, once again it was recessionary.
Unemployment and Underemployment
The headline was that the unemployment rate ticked up by 0.1% to 4.1%, and the broader underemployment rate spiked higher by 0.5% to 8.0%, the highest level in over 3 years.
As with the above, I am going to focus on YoY comparisons. On that basis, the unemployment rate was higher by 0.2%, and the underemployment rate higher by 0.7%. Again, for historical purposes here is that graph for the last several years, normed to zero as of the latest readings:

While the U6 underemployment levels are noisier than the unemployment rate levels, the YoY increases in each has decelerated in recent months, which is a good sign.
But now let’s look at that historically. Because the U6 data didn’t start until 1994, here is the unemployment rate YoY before than:

And now here is the record for both from 1994 until the pandemic:

With respect to the unemployment rate, while far more often than not even a 0.2% increase YoY has meant recession, there have been a number of false positives, including in the 1950s, 1960s, one month in the 1980s, and the near “double dip” in 2002.
But with respect to the underemployment rate, being higher YoY by the current level has meant recession in each case except for the 2002 near “double dip.”
But since this past month was a spike, let’s show the above graph again, this time using the average of the last 3 months, which is an increase YoY of 0.43%:

We still get the same result.
In other words, the changes in both the unemployment and underemployment rates are recessionary. But with the big caveat that they have been so for the past year or so, and no recession has happened. In other words, it looks like another false positive.
The Employment Population Ratio
I performed the same exercise with the Labor Force Participation Rate, including focusing on the prime age 25-54 rate, but to cut to the chase, it was of little value because of distortions from the entry of women into the labor force in the 1960s through the 1990s, and also due to the demographics of the Baby Boom followed by the Gen X bust, followed by the Millennial Boom.
But the employment population ratio does give meaningful information, particularly when we look at the prime age component. This declined -0.2% in February to 80.5%, which is down -0.4% from its recent peak last summer.
Once again I looked YoY, and because this data is also noisy, I used the average the last three months, which was -0.033%. The below graph shows this data monthly (blue), and on a quarterly average basis (red):

Again, it is negative, but the pace of decline has stopped in recent months.
Now here is the entire historical look, also normed to zero as of the current 3 month average:

With the exception of several months in the 1950s, several months in 1995 and 1998, and the 4th Quarter of 2013, the current YoY decline in the prime age employment population ratio has *always* previously meant recession. But again, we have been at this level for nearly a year, and no recession has occurred - at least not yet.
I should add that I have two major concerns, one for each survey.
As to the Establishment Survey, the QCEW, which is the gold standard, on a preliminary basis indicates that employment gains last year through Q3 were about 500,000 less than currently shown. So this survey is likely to look weaker when rebenchmarked using that data - unless the preliminary QCEW data is itself revised higher.
As to the Household Survey, I remain concerned that it still is not properly accounting for the massive immigration wave of the several years immediately following the COVID pandemic. What i really mean is that the increases in the unemployment and underemployment rates, as well as the downturn in the prime age employment population ratio, might really be about recent immigrants finding it harder to gain employment than several years ago. Which means that the economy is still growing, just not fast enough to digest all of the new entrants to the market.