Tuesday, February 9, 2021

December JOLTS report shows renewed stalled jobs market due to out of control pandemic


 - by New Deal democrat

This morning’s JOLTS report for December confirmed a jobs market recovery that has  paused due to the increasing effects of the out of control pandemic. Most importantly, hires declined sharply - down by over 5% in a single month!

While the JOLTS data is a deep dive into the dynamics of the labor market, since it only dates from 2001, there are only 2 previous recoveries with which to compare the present. Nevertheless it is worthwhile to make the comparison.

In the two past recoveries: 
  • first, layoffs declined
  • second, hiring rose
  • third, job openings rose and voluntary quits increased, close to simultaneously

Let’s examine each of those in turn. In each case.

What appears below is that, although there has been some variation, the year 2020 through December has recapitulated the pattern from the last two early recoveries: the first two data series to turn - layoffs and hires - have indeed turned, while the last two - job openings and voluntary quits - have appeared to bottom but have had a much less dramatic rise. With increased pandemic restrictions and consumer caution, several renewed negative readings in November, but not enough to significantly change the trend.

This first graph compares layoffs and discharges (blue) with the 4 week average of initial jobless claims (red) prior to this recession, for reasons of scale since March and April would be “off the charts”:
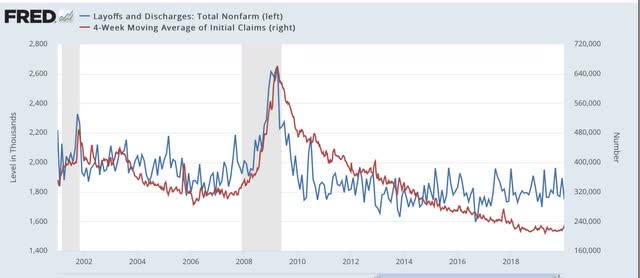
You can see that, by the end of the recessions, layoffs were already declining, and continued to decline steeply over the next 3-8 months before reaching a “normal” expansion level. The turning point coincides exactly with the much less volatile, but more slowly declining, level of initial jobless claims.

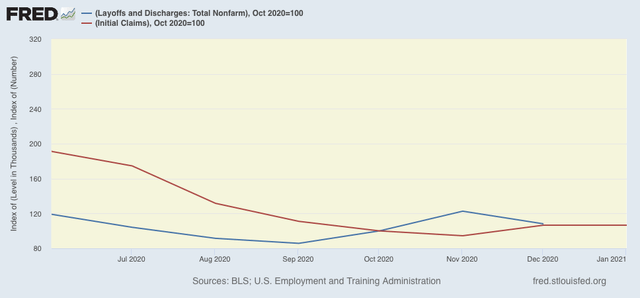
The same had been the case this year up through October. Layoffs and discharges already declined to their “normal” level in May, while initial jobless claims peaked one to two months later, and continued to decline (slowly) into autumn. Then, in November, layoffs and discharges increased and remained elevated in December. Initial claims followed suit with a one month delay: 


Next, here is the entire historical relationship between hires (red) and job openings (blue) through 2020:
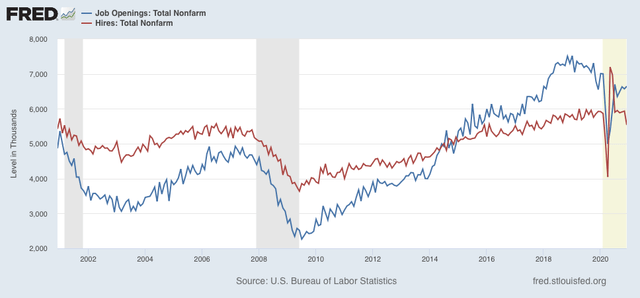

In the past two recoveries, actual hires started to increase one to two months before job openings.

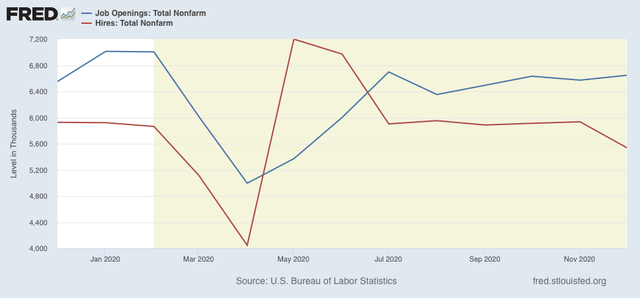
Both made troughs in April, but hires initially rebounded more sharply ever since May compared with job openings. Since July openings have stagnated, while hires actually declined significantly in December to their worst level since the April lockdowns:

Next, here are quits (green) vs. job openings (blue): 
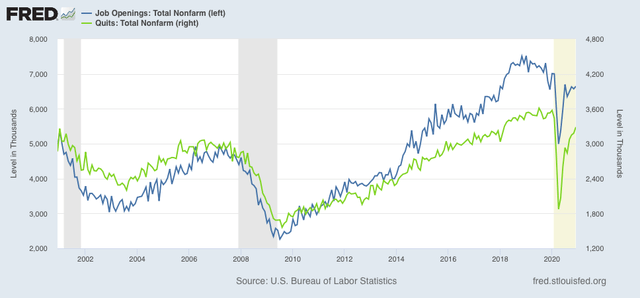

In the past two recoveries, openings rose first, followed by quits, suggesting it is openings that leads to the increase in voluntary quits. That has been the case in 2020 as well.

Because of the enormous moves during this pandemic year, seasonal adjustments might not be leaving us with a true picture, so here are job openings (blue), hires (red), and voluntary quits (green), measured YoY instead, for the entirety of the series up through the present:
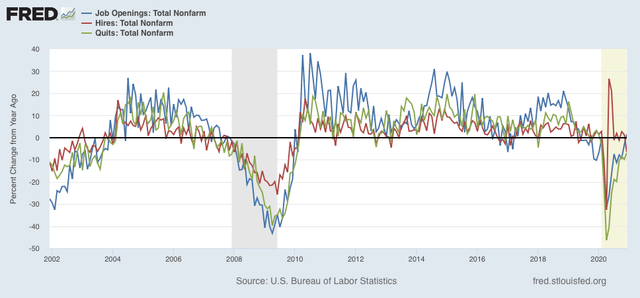

We can see that hires rebounded first following the 2001 and 2008-09 recessions. Quits and openings moved generally in tandem with a slight lag. The same pattern generally appeared in 2020, with quits perhaps slightly lagging.

Finally, I have broken out layoffs and discharges separately below, because the their level in April and May of this year would obliterate all other variations. The first graph covers their entire history through 2019, and the second 2020 beginning in June:
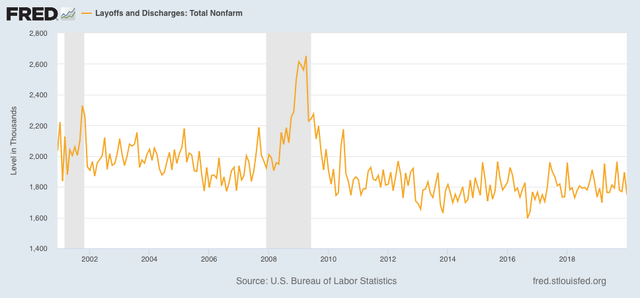
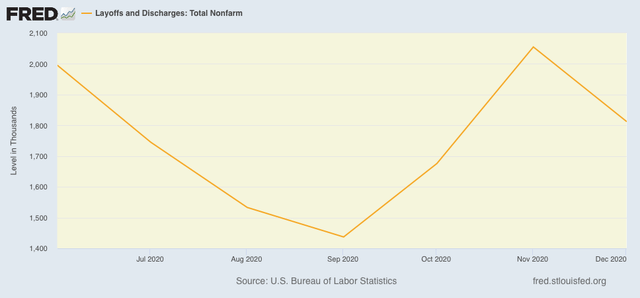

This metric returned to normal almost immediately after both of the past two recessions, and did so again by June of last year, and has stayed in that normal range ever since, although layoffs and discharges have clearly increased since September.


To sum up, the December JOLTS report once again shows:

1.  A pattern generally consistent with the past 2 recoveries, with layoffs having returned to normal levels, then hiring having increased, and finally quits and openings increasing as well;

2. The late autumn and early winter surge in the out of control pandemic has shown up in  increasing layoffs and separations, and a downturn in hiring.

With new infections having sharply declined in the past 4 weeks, and 40+ million doses of vaccine administered, I am expecting a positive reversal, but not until at minimum the JOLTS report covering this month,  which will be released in April.

Monday, February 8, 2021

The short term 2021 economic forecast + brief coronavirus update


 - by New Deal democrat

At the beginning of each year, I have usually posted both short and long term forecasts. Because of the impact of the pandemic, I refrained from doing so. But with light at the end of the tunnel courtesy of the vaccines, it makes sense to do updates now.

So . . . my K.I.S.S. short term forecast is up at Seeking Alpha. As usual, clicking on over to the link will give you some useful economic information about the likely trajectory of the economy through midyear, and also reward me a little bit for the effort I put in.

Meanwhile, some significant news on the pandemic front.

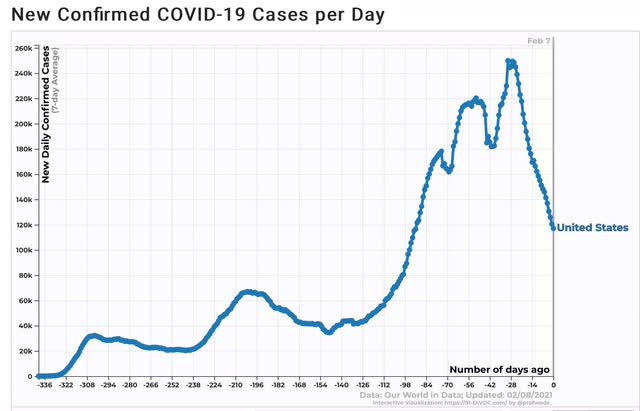
While we wait to see if the Super Bowl was another super spreader event, the one week average of cases through yesterday was at the lowest point in 3 months:

If the downward trajectory continues, we’ll be at our spring and summer averages within 3 weeks.

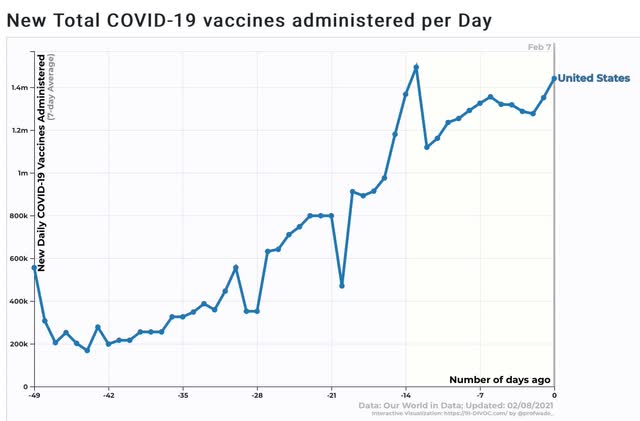
And vaccinations continue to improve, with the weekly rate at over 1.4 million daily:

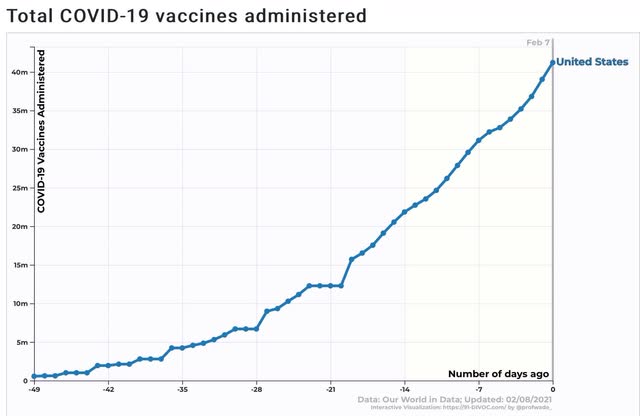
total vaccinations have reached over 40 million:

That is still less than 10% of what we need to bring the pandemic truly under control.


Saturday, February 6, 2021

Weekly Indicators for February 1 - 5 at Seeking Alpha


- by New Deal democrat

My Weekly Indicators post is up at Seeking Alpha.

All of the leading sectors - manufacturing, housing, interest rates, money supply - are revving in place, just waiting for the pandemic to be brought under control.

As usual, clicking over and reading will bring you up to the virtual moment, and bring me a tiny bit of jingle in my pocket.

Friday, February 5, 2021

January 2021 jobs report: a strong divergence between very weak job gains, but a big drop in unemployment; but the only critical number is the doses of vaccine administered


 - by New Deal democrat

For the past several weeks, based on the increase in initial jobless claims, I have warned that the December employment report might have a negative number, or at very least a very weak positive. Once again this was an accurate forecast.

There was a strong divergence between the household and establishment reports this month. And to cut to the chase, the only real critical number is the amount of vaccinations administered.

HEADLINES:
  • 49,000 jobs added, only 5,000 of which were in the private sector and 43,000 in government. The alternate, and more volatile measure in the household report indicated a gain of 201,000 jobs, which factors into the unemployment and underemployment rates below.
  • U3 unemployment rate declined 0.4% at 6.3%, compared with the January 2020 low of 3.5%.
  • U6 underemployment rate fell -0.6% to 11.1%, compared with the January 2020 low of 6.9%.
  • Those on temporary layoff decreased 293,000 to 2,746,000.
  • Permanent job losers increased by 133,000 to 3,503,000.
  • November was revised downward by 72,000. December was also revised downward by 87,000 respectively, for a net loss of 159,000 jobs compared with previous reports.
Leading employment indicators of a slowdown or recession

I am still highlighting these because of their leading nature for the economy overall.  These were mixed: 
  • the average manufacturing workweek increased to 40.4 hours. This is one of the 10 components of the LEI.
  • Manufacturing jobs declined by 10,000. Manufacturing has still lost -592,000  jobs in the past 11 months, or 5% of the total. About 60% of the total loss of 10.6% has been regained.
  • Construction jobs decreased by 3,000. Even so, in the past 11 months -256,000 construction jobs have been lost, 3% of the total. About 80% of the worst loss of 15.2% loss has been regained.
  • Residential construction jobs, which are even more leading, *rose* by 3,600. Since February there have now been actual job *gains,* and employment in this sector is at another new 10 year+ high.
  • temporary jobs increased by 80,900. Since February, there have still been 241,100 jobs lost, or 8% of all temporary help jobs.
  • the number of people unemployed for 5 weeks or less declined by -626,000 to 2.278  million, compared with April’s total of 14.283 million.
  • Professional and business employment rose by 97,000, which is still 825,000, or about 4% below its February peak.

Wages of non-managerial workers
  • Average Hourly Earnings for Production and Nonsupervisory Personnel: rose $0.03 from $25.15 to $25.18, which is a 5.4% YoY gain. This is a level not seen in the past 10 years outside of the first months of this pandemic. Relative gains in this measure reflect that job losses during the pandemic have occurred primarily among lower wage earners.

Aggregate hours and wages:
  • the index of aggregate hours worked for non-managerial workers rose by 0.5%. In the past 11 months combined this has nevertheless fallen by about  5.5%.
  •  the index of aggregate payrolls for non-managerial workers rose by 0.6%. In the past 11 months combined this has nevertheless fallen by about 2.5%. Still, over 90% of the loss from February to April has been made back up.

Other significant data:
  • Full time jobs gained 301,000 in the household report.
  • Part time jobs declined 456,000 in the household report.
  • The number of job holders who were part time for economic reasons decreased by 216,000 to 4.567 million. This is still an increase since February of 1,556,000.
  • UPDATE: The pandemic has had a singular effect on food and drink establishments. Since October, there have been 446,400 jobs lost. “Only” 19,400 of those were in January - so that is at least “less awful.” 

SUMMARY

Once again the household and establishment reports strongly diverged. The household report, from which unemployment rates and the number of full time vs. part time workers are taken, showed strong gains, driven by both increased employment and a slight decrease in the number of people in the jobs market. The establishment report, by contrast, showed weak gains or outright losses, depending on the employment sector. What stands out is the huge gains in temporary employment, which is a leading sector, but also strongly suggests that employers are not willing to make permanent commitments in this volatile environment.

But for the vaccines, the December and January reports together would strongly suggest that a “double dip” recession has started, due to the tremendous surge in new COVID cases during the past 3 months. I suspect, however, that competent policy from the Biden Administration and the continuing improvement I the number of vaccines administered daily, plus the onset of warmer weather in spring, will end these week numbers in a month or two.

Thursday, February 4, 2021

Initial claims decline, continuing claims set another new pandemic low


 - by New Deal democrat

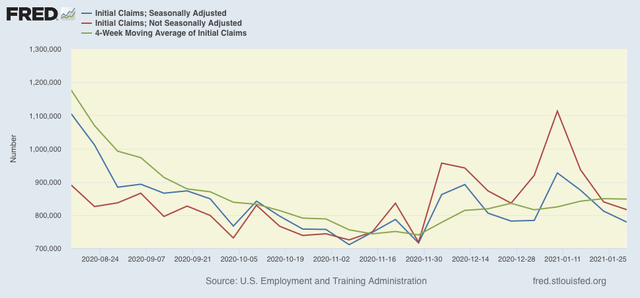
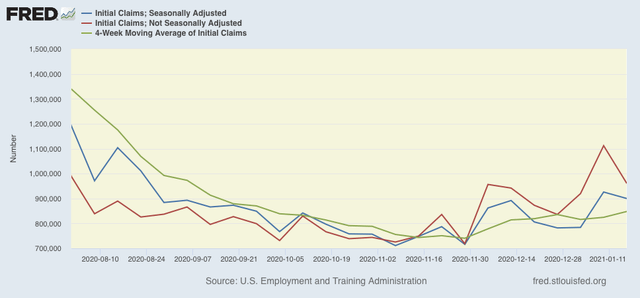
On a unadjusted basis, new jobless claims declined by 23,525 to 816,247. Seasonally adjusted claims declined by 33,000 to 779,000. The 4 week moving average also declined by 1,250 to 848,250. 

Here is the close up since the end of July (these numbers were in the range of 5 to 7 million at their worst in early April): 

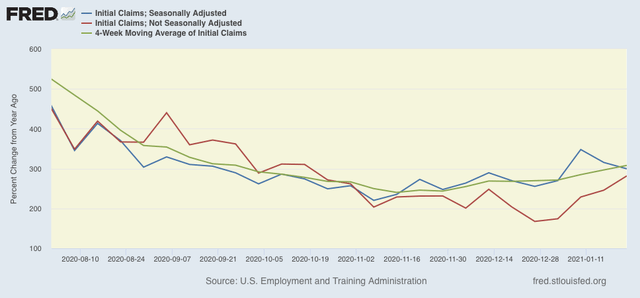
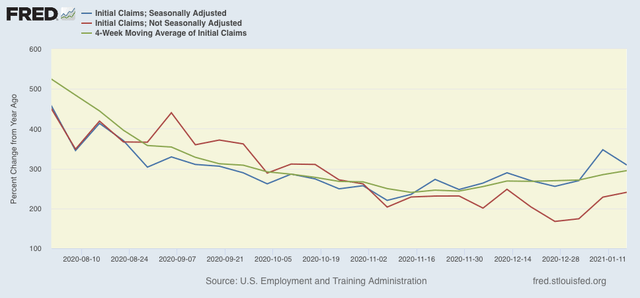
Because of the huge swings caused by the scale of the pandemic - typically claims only vary by 20,000 or less from week to week, but since the start of the pandemic, swings of 50,000 or 100,000 per week have happened as often as not, I have been posting the YoY% change in the numbers as well, since they will be much less affected by scale. As a result, there is less noise in the numbers, and the trend can be seen more clearly:

Here’s what that looks like:

The recent elevation in new claims compared with their November lows is clear. Whether the last several weeks’ declines in new claims, which were over 900,000 only 3 weeks ago, means the upward trend has peaked, will have to await several more weeks’ data.


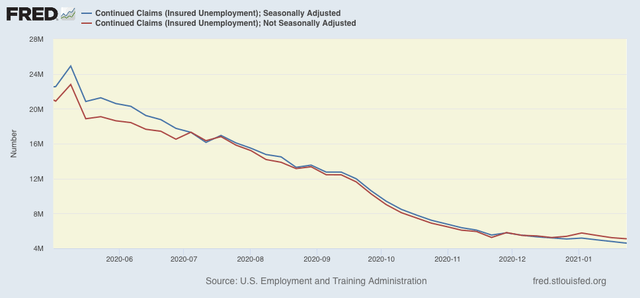
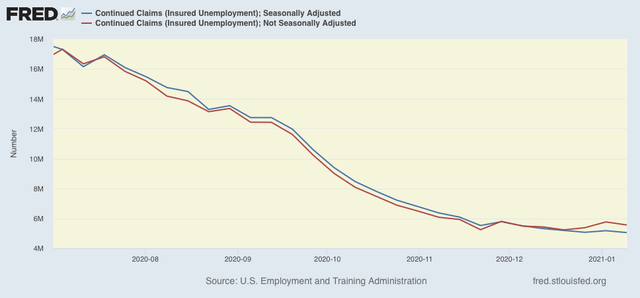
Meanwhile continuing claims, which historically lag initial claims typically by a few weeks to several months, made still more new pandemic lows this week. Seasonally adjusted continuing claims declined by 193,000 to 4,592,000, while the unadjusted number declined by 127,726 to 5,094,605:


Although I had suspected that we would see an upward reversal, obviously that hasn’t happened. 

As I usually note, a reminder that both initial and continued claims remain at or above their worst levels from the Great Recession.

Finally, tomorrow we will get the January employment report. For the relevant set of weeks, January claims averaged about 20,000 higher than December. Last week, when the average was 40,000, I wrote that it appeared more likely than not that we will see another slightly negative jobs report. We still might, but with the revisions a small gain is equally possible.

Because of the much more coherent, comprehensive, and forceful approach to the pandemic from the new Biden Administration, and the simple fact that the weather will begin to warm up in a month, I am expecting the trend in claims to peak and to reverse again by the beginning of April - hopefully for good.

Wednesday, February 3, 2021

Q4 GDP’s long leading indicators suggest slowing by year-end 2021


 - by New Deal democrat

Last Thursday GDP for Q4 was released. That report contains two long leading indicators, which help fill in the picture for year-end 2021.

I put up a fuller report over at Seeking Alpha.

As usual, clicking over and reading rewards m a little bit for the effort I put into this endeavor.

Tuesday, February 2, 2021

Coronavirus dashboard: Groundhog Day


 - by New Deal democrat

Today is Groundhog Day, America’s version of the midwinter festival, where people can at least begin to look ahead to the coming of spring in the near future. That’s a good analogy for where we are in the COVID pandemic. 


Let me start with the ghastly news.

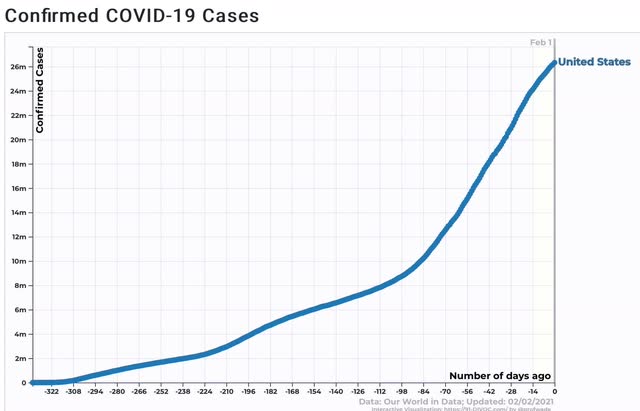
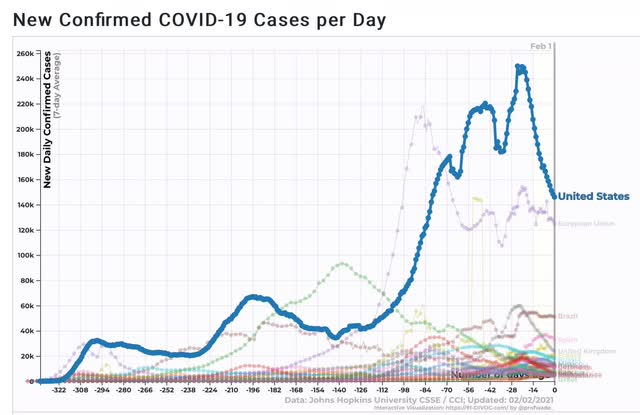
First, there have been over 26 MILLION confirmed cases. Since many unsymptomatic cases have gone undiagnosed, it is very likely that over 33 million, or 1 in every 10 Americans, has been infected with the disease:  


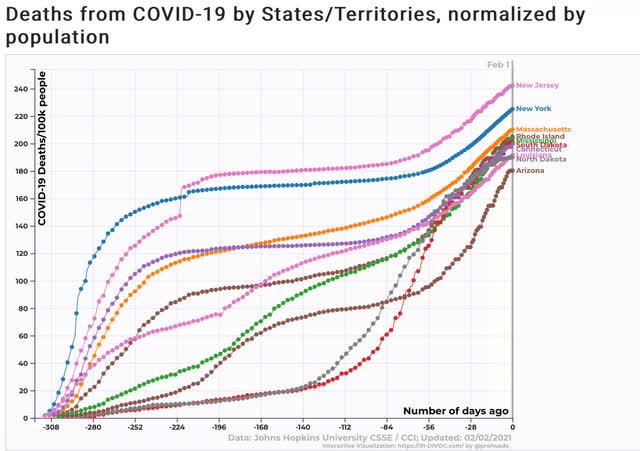
Further, in the 10 worst hit States, roughly 1 in every 500 people in the entire population has died. In the case of New Jersey, it’s 1 in 400:


As has been the case throughout the pandemic, panic has bred caution. The total number of new infections in the past week has been at a 3 month low:


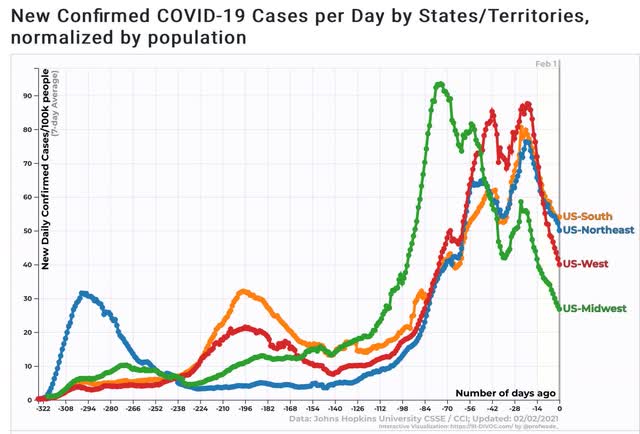
And all 4 regions of the country are showing a decline, with the lowest regions being the warmer ones of the South and West Coast, where presumably people are engaging in more activity outdoors rather than risky indoor groups:


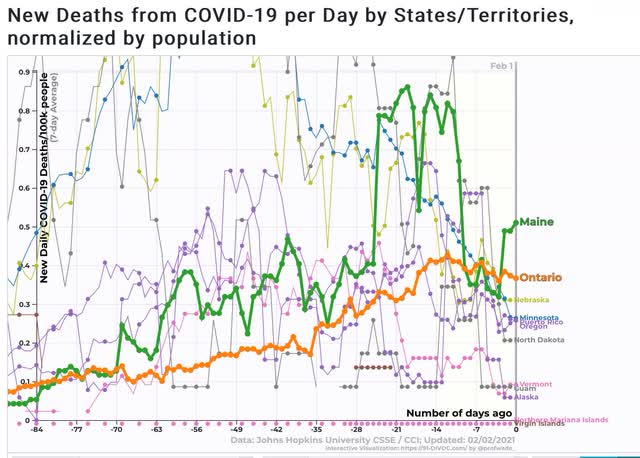
The States which have historically done the best in this pandemic: Maine, Vermont, Oregon, and Alaska, continue to do well, as shown in the below graph of the 10 States and territories with the lowest death rates, plus Ontario, Canada for comparison:

 
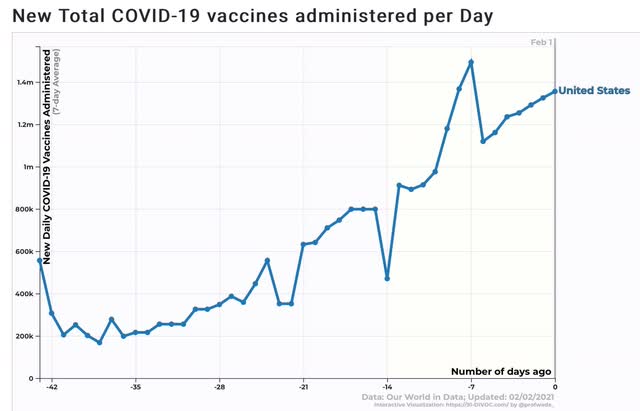
Finally, vaccine administration is continues to ramp up arithmetically, currently averaging 1.35 million doses daily for the past week:


At the current rate of increase, we will be at 2 million doses a day in about 3 weeks. That would enable us to vaccinate the entire population by the end of this year. 

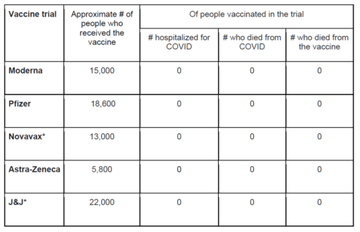
The best news of all comes from this spreadsheet. In the trials for the five leading vaccines, about 75,000 people were vaccinated. Exactly *ZERO* of the participants subsequently have been hospitalized or died of COVID:


These are simply extremely effective vaccines.

Spring is coming.

Monday, February 1, 2021

The two most leading sectors of the real economy - manufacturing and construction - remain “on fire”


 - by New Deal democrat

Data for January 2021 started out this morning with the ISM manufacturing index, while the December laggard of construction spending was also reported. 


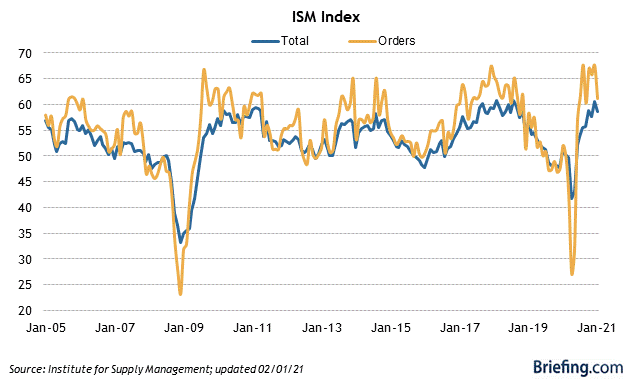
While the ISM manufacturing reading declined from 60.7 to 58.7, since 50 is the break even point, this is still a very strong positive. The even more leading new orders subindex also declined from 67.9 to 61.1, also still a very positive reading:


The manufacturing sector remains very healthy.

Turning to construction, one of my consistent themes in the past few months has been how the housing market is priming the economy for strong growth in 2021 as soon as the pandemic is brought under control. That was further confirmed as December construction spending surged yet again, confirming what we have already been seeing in housing permits and starts.


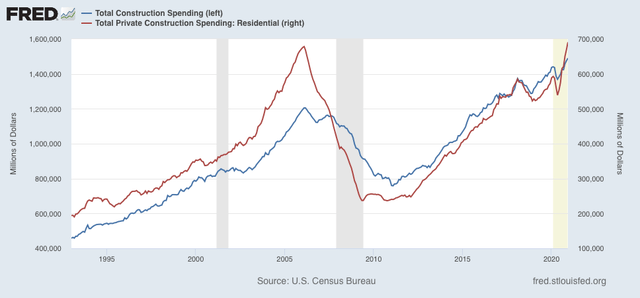
First of all, here are both total and residential construction spending for the past 25 years:


In raw, non-inflation-adjusted terms, both made new all-time highs last month.

Of the two, residential construction is the more important because it is more leading, indicator. Commercial and government construction, which are included in the total, relatively speaking lag.

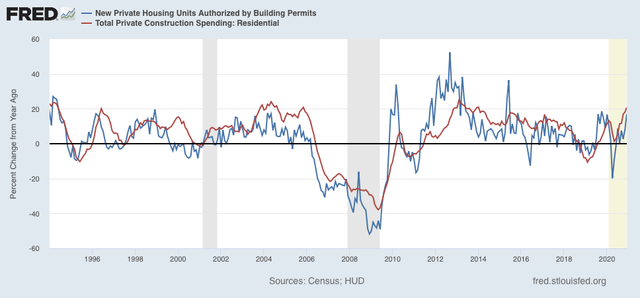
Because permits have to be taken out before construction can begin, typically these lead construction spending (although in fairness that really hasn’t been true in the past 2 years). Below I show the YoY% change in both, which helps take care of the fact that residential construction spending isn’t adjusted for inflation:


Beginning last May, residential construction spending has been increasing at a pace equivalent to its best in the past 5 years, just as permits have done even better. In short, soaring permits should mean soaring construction continuing through this spring and summer.

Simply put, this morning’s two reports together show that manufacturing and housing, the two most important leading sectors of the real economy, continue to be “on fire.”

Sunday, January 31, 2021

The historical use of the filibuster in the Senate


 - by New Deal democrat

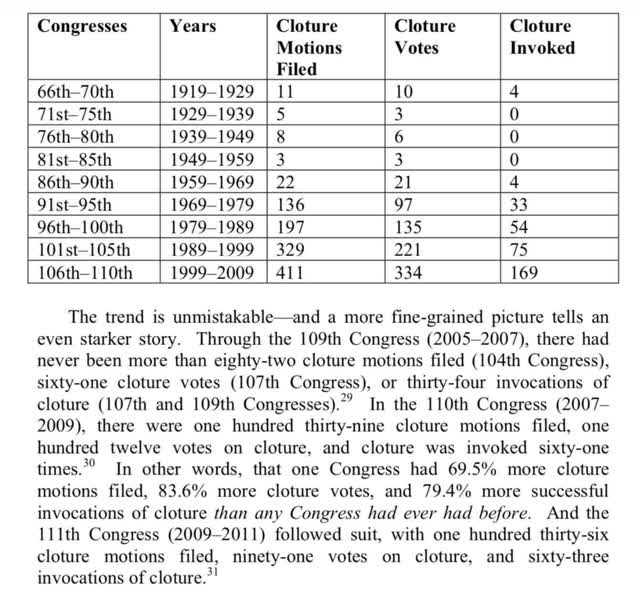
I came across the below table and explanation in the twitter feed of Matt Yglesias, I think, and wanted to post it here for preservation. It is a recapitulation by decade through 2009 of the use of the filibuster, and cloture motions, in the Senate:

Note that in the two year period of 2007-09, cloture was invoked more often than in the entire decades before 1980. And the Congress of 2009-11 had even more cloture motions than that.

In short, the filibuster has gone from a rarely-used, extreme instrument, to an ordinary course of business during our lifetimes.

Beyond that, as it currently exists, the filibuster overwhelmingly favors the GOP agenda. Since they don’t want to pass any new programs, or even enforce existing ones, a 60 vote requirement to enact those suits their purposes.  But the two things they *do* want - tax cuts and conservative judges - can be enacted with simple 50+1 vote majorities.

 The only downside for Democrats, if they did away with the filibuster - and it’s a big one -  is that the GOP would use the new rules to repeal whole rafts of one-standing progressive enactments - like Social Security, Medicare, and   the EPA - the next time they get the trifecta of House, Senate, and Presidential victories. Since an extreme backlash would follow, democrats would have to re-enact those things after the next Presidential election if they were victorious. 


But the current situation is simply intolerable.


Saturday, January 30, 2021

Weekly Indicators for January 25 - 29 at Seeking Alpha


 - by New Deal democrat

My Weekly Indicators post is up at Seeking Alpha.

After many weeks of stability, there is some turmoil - in opposing directions - among the short leading indicators in particular. It is an indication of the bifurcated nature of the economy at present, where portions of the service sector have a pandemic-sized hole blown in them, while  manufacturing is barreling ahead.

As usual, clicking over and reading will bring you up to the virtual moment, while putting a pittance in my pocket.


Friday, January 29, 2021

Real personal spending declines in December, while income rises; not quite enough to start a “double-dip” recession


 - by New Deal democrat

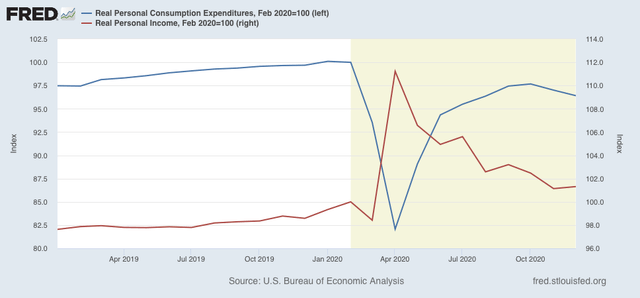
This morning’s report on personal income and spending for December reversed the pattern we have seen all during the second half of 2020. After rebounding strongly for 6 months, real personal spending (blue in the graph below) declined for the month by -0.2%, and is 3.6% below its February peak. Meanwhile real personal income (red), which has generally declined since April, rose 0.6%, and remains 1.3% higher than it was in February just before the pandemic hit:


The continued strength in income compared with prior to the pandemic has everything to do with the emergency stimulus Congress put in place early on after the pandemic hit. This has greatly ameliorated the privation which would otherwise have occurred.

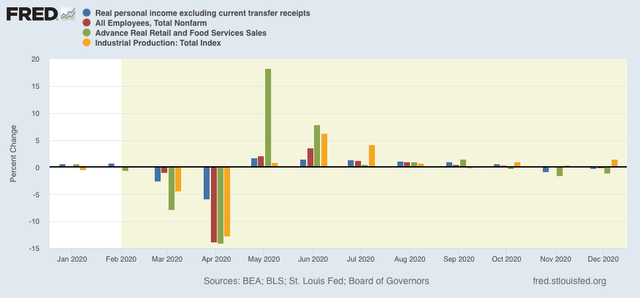
Further, real personal income excluding transfer payments (I.e., payments from the government like food stamps and unemployment insurance) is one of the four coincident indicators which the NBER makes use of in determining if the economy is expanding or not. This also declined -0.2% in December, the second monthly decline in a row after increasing in the 6 prior months. In the below graph I show that (blue) together with jobs (red), real retail sales (green), and industrial production (gold) for the year 2020:


All four of these data points have been deteriorating since strong rebounds in May and June. Two (sales and income) were negative in November, and payrolls also went negative in December. Because industrial production is the King of Coincident Indicators, however, I doubt the NBER will mark a renewed recession beginning in either month. Still, *if* production rolls over, and the other three decline further in January, that might mean the start of a “double-dip.” But because I expect the pandemic to be brought somewhat under control by spring sometime, I further suspect that it won’t be enough to qualify as a renewed recession.

Thursday, January 28, 2021

Upward trend confirmed in new jobless claims


 - by New Deal democrat

On a unadjusted basis, new jobless claims declined by 101,498 to 873,966. Seasonally adjusted claims also declined by 67,000 to 847,000. The 4 week moving average, however, rose by 16,250 to 868,000. Since the 4 week average has risen above 850,000, and weekly claims were above 900,000 for several weeks in a row, jobless claims have finally met my criteria confirming a change to an upward trend.

Here is the close up since the end of July (these numbers were in the range of 5 to 7 million at their worst in early April): 

Because of the huge swings caused by the scale of the pandemic - typically claims only vary by 20,000 or less from week to week, but since the start of the pandemic, swings of 50,000 or 100,000 per week have happened as often as not - and because the holiday season even in ordinary years plays havoc with seasonal adjustments, I have been posting the YoY% change in the numbers as well, since they will be much less affected by scale.

Here’s what that looks like:

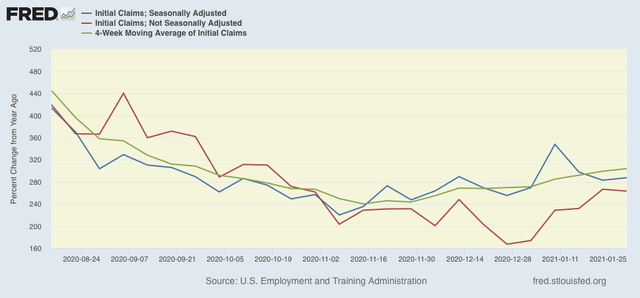
There is much less noise in the numbers, and while the change is more muted, the trend is now clearer. Both seasonally adjusted metrics are more than 300% higher YoY vs. 200-225% in November, while unadjusted claims are close to 300% vs. just over 200% higher YoY in early November.


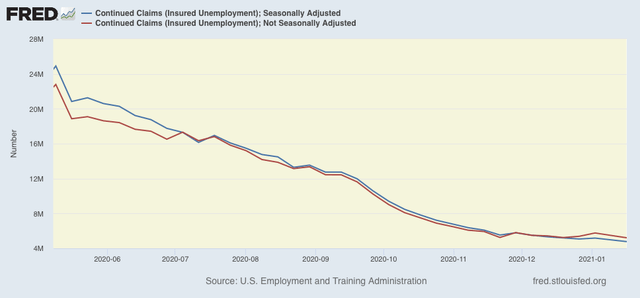
The story remains different with continuing claims, which historically lag initial claims typically by a few weeks to several months. Seasonally adjusted continuing claims declined by 203,000 to 4,771,000, while the unadjusted number declined by 274,055 to 5,208,719, both yet another pandemic low:


Because these lag initial claims, I have suspected that we would see an upward reversal, but obviously that hasn’t happened yet.

As I usually note, a reminder that both initial and continued claims remain at or above their worst levels from the Great Recession.

Finally, because for the past three weeks new claims have averaged about 40,000 higher than the comparable weeks in December, it appears more likely than not that we will see another slightly negative jobs report for January when it is reported next week.

Winter is going to give way to spring from south to north over the next 10 weeks, and already we have seen a much more coherent, comprehensive, and forceful approach to the pandemic from the new Biden Administration. For both of those reasons, I am expecting the trend in claims to peak and to reverse again by the beginning of April - hopefully for good.

Wednesday, January 27, 2021

The Quick and Dirty economic indicator forecast: another vote for “Here Comes the Sun”


 - by New Deal democrat

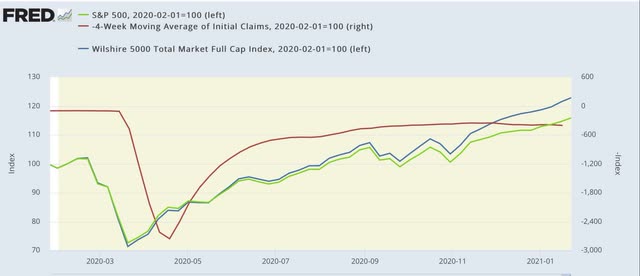
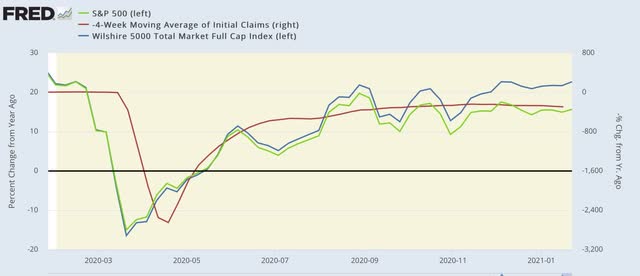
Still no important economic news yet this week, so let’s take a look at something I haven’t updated in awhile: the Quick and Dirty economic indicator of stock prices vs. new jobless claims.


Both metrics are short leading indicators, although historically stock prices have been more leading (3-9 months) than jobless claims (roughly 2-3 months). Both have the advantage of being updated daily or weekly, so we don’t have to wait a month for each update. If they are both going in the same direction (i.e., positive or negative) it’s a pretty good proxy for the overall direction of the economy in the months to come.

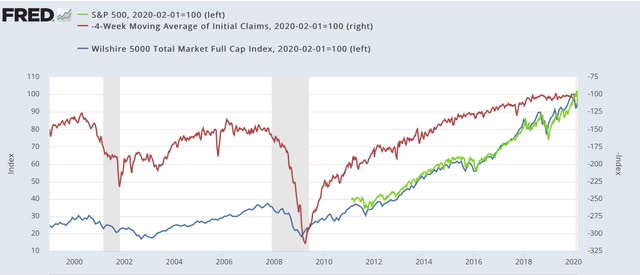
Here is the historical view of the actual readings of two stock market indexes - the Wilshire 5000 Total Market Index (blue) and the S&P 500 (green), plus the inverted reading of new jobless claims (red) for the past 20 years up until the pandemic hit:


Viewed this way, they aren’t too much help aside from noting that they appear to turn down in tandem prior to both of the past 2 recessions before the pandemic.

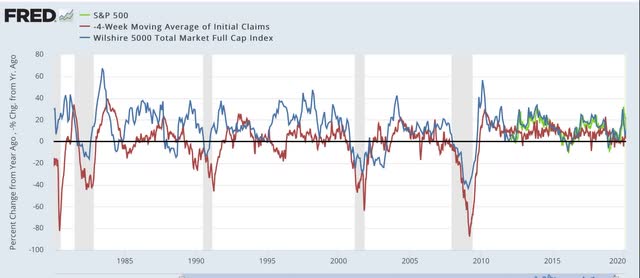
A better way to get information from them is to compare the YoY% changes, again with initial jobless claims inverted (because fewer is better):


They don’t always move in tandem, and usually - but by no means always! - stocks move first. This is because traders evaluate stocks based on anticipated *future* returns, whereas jobless claims react to present consumer demand situations.

In general, when both are better by less than 10% YoY, and decelerating sharply towards 0, the economy has a problem. When they are both negative, the economy is almost always about to enter a recession.

Here’s what the absolute index values look like for the past 12 months:


And here’s what the YoY% readings are:


After slowing during the summer and pausing in fall, stock prices have taken off again in the past few months. They have been consistently up over 10% YoY.

In other words, the Quick and Dirty economic indicator is not giving a recession signal, and is suggesting that with the end of winter (resumption of meaningful outdoor dining and other activities) and vaccine approvals and distribution, the economy is going to resume further growth in springtime.

One more reason why “Here Comes the Sun” is the theme song of 2021.

Monday, January 25, 2021

Coronavirus dashboard for January 25: a vaccination race against time vs. the new mutations


 - by New Deal democrat

All of the significant economic data is backloaded this week, onto Thursday and Friday. So don’t be surprised if I take a day off between now and then.

In the meantime, here is a Coronavirus update.

First things first: the most ominous thing I’ve read about the new coronavirus mutations comes from Dr. Eric Fiegl-Ding, who says, quite bluntly, “We need to switch to KN95, KF94, or European FFP2 masks ASAP. The new B117 COVID 19 is just too contagious. Cloth isn’t enough anymore folks.”

Everyone needs to take heed of that advice. There’s also evidence that the B117 variant infects people with much higher viral loads (I.e., copies of the virus at the outset), increasing the fatality rate significantly for older people. 

In the meantime, here is where we stand.

Total confirmed infections: 25,127,000 (I suspect the true number, including cases that were never tested, is closer to 33 million, or 1 in 10 Americans)
7 day average for last week: 170,032 (down from 249,168 peak on Jan 11)
Total deaths: 419,217
7 day average for last week: 3,088 (down from 3,355 peak on Jan 13)

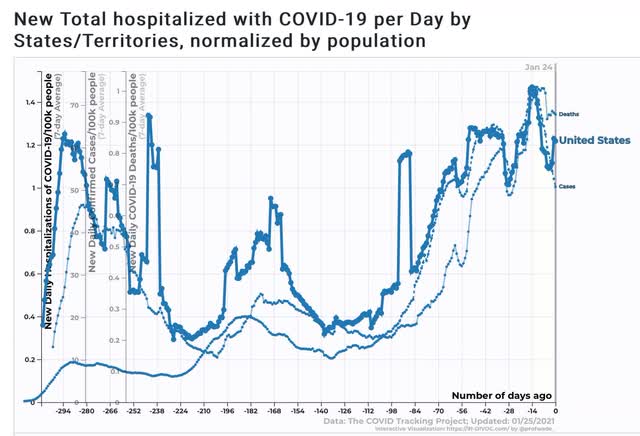
Here are the 7 day averages for infections, hospitalizations, and deaths per capita graphically (note separate scales):


There really isn’t a meaningful lag between confirmed infections and hospitalizations, indicating people are waiting till they are quite sick before getting tested. Deaths still lag both infections and hospitalizations. Crossing my fingers that we have hit the winter peak for all three metrics already, but very worried about the B117 variant, since most experts think it will become the dominant strain in the US by March - and because it is so much more infections, that means yet another spike.

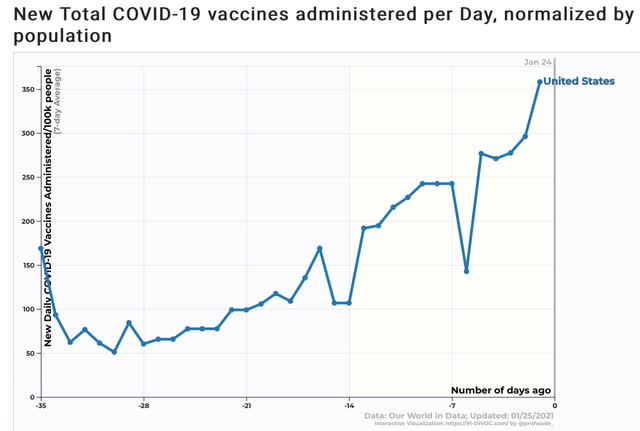
Now here is the vaccination data:

Total vaccinations: 20,537,900
7 day average for last week: 1,179,830 (new high)

Here is the average graphically, per capita:


The good news is that the rate of vaccination has continued to increase, and already surpasses Biden’s 1 million per day goal. But in order to get everyone vaccinated by the end of 2021, we need to see that rise to over 2 million per day. And in order to get older people vaccinated before the new mutations cause a big spike in deaths, we probably need to see that rise to over 3 million per day in the next 45 days.

Saturday, January 23, 2021

Weekly Indicators for January 18 - 22 at Seeking Alpha


 - by New Deal democrat

My Weekly Indicators post is up at Seeking Alpha.

The pandemic, and the monetary and interest rate responses to it, are dictating which sectors are improving and which are stagnated or worse.

But as vaccinations slowly progress, in springtime there may be growth in the garden.

As usual, clicking over and reading rewards me a little bit for the work I put in, and brings you up to the moment on the data.

Friday, January 22, 2021

A detailed, updated look at the housing market


 - by New Deal democrat

Existing home sales for December were reported this morning at 6.76 million annualized, just below the October 10 Year+ high of 6.86 million.

Although existing home sales are about 90% of the entire housing market, they are less important economically than new housing construction, which has multiplier effects which last 12-24 months.

But right now both existing home sales and new home construction are telling the same story: a market that is turning in its best performance since before the Great Recession. I have updated my detailed look at this very important long leading sector in an article over at Seeking Alpha.

Clicking over and reading will bring you thoroughly up to date about this crucial sector, and reward me a little bit for my work.

Thursday, January 21, 2021

Initial jobless claims: still elevated compared with several months ago, another negative jobs report for January a possibility


 - by New Deal democrat

Initial jobless claims this week came within a hair of meeting my criteria for a change to an upward trend. 

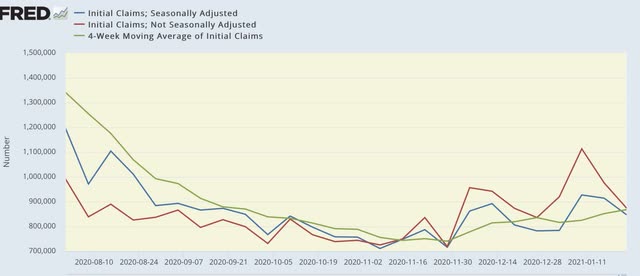
On a unadjusted basis, new jobless claims declined by 151,303 to 960,668. Seasonally adjusted claims also declined by 26,000 to 900,000 (last week’s numbers were also adjusted downward from 965,000 to 926,000). The 4 week moving average, however, rose by 23,500 to 848,000.

Here is the close up since the end of July (these numbers were in the range of 5 to 7 million at their worst in early April): 


There is now a 2 1/2 month trend of YoY% increases in initial claims. Further, by rising to  900,000 or higher for the second week in a row, seasonally adjusted claims hit one of my two markers for a fundamental change of trend. But the 4 week average - by a whopping 2,000 - remains under my marker of 850,000.

Why I’m still waiting at least one more week for confirmation can be seen in my next graph.

For the last couple of months, I have been cautioning that the holiday season plays havoc with seasonality even in normal years, let alone a year when the pandemic is causing changes in weekly numbers by an order of magnitude. Typically in the weeks after Christmas and New Years’, claims go up by 25,000 to 50,000 on an unadjusted basis, and then rapidly recede. This year claims both went up and then this week came down by up to 10x as much during this period. 

But when we look at the YoY% change in all of the above metrics, which washes out those outsized seasonal affects, the picture - especially in the critical, non-seasonally adjusted data - is not so negative:

While weekly seasonally adjusted claims have risen 310% - a YoY comparison last seen in August, the 4 week average is still in the YoY range they were in October, at +240%. Further, the the non-seasonal trend, at a 240% increase YoY, looks like a sideways rather than upward trend. If this changes next week, when it looks almost certain the 4 week average will exceed 850,000, then we’ll definitely know we are in an upward trend. But I’m giving it that one more week.


Turning to seasonally and non-seasonally adjusted continuing claims, which historically lag initial claims typically by a few weeks to several months, the former declined by 127,000 to a new pandemic low of 5,054,000, while the latter declined by 203,750 to 5,563,048:

Because these lag initial claims, I have suspected that we would see an upward reversal. Last week I wrote that it appeared to have arrived, but with the new pandemic low in adjusted claims, that is on hold.

As I usually note, a reminder that both initial and continued claims remain at or above their worst levels from the Great Recession.

Finally, because the past two weeks have been about 50,000 higher than the conquerable two weeks last month, it appears more likely than not that we will see another slightly negative jobs report for January when it is reported in two weeks.

As I wrote last week, renewed partial lockdowns and increased consumer caution due to the out of control pandemic have caused increased layoffs. At the same time, it isn’t quite as bad as I would have thought several months ago. Already in his first day in office, Joe  Biden has begun to tackle COVID in a far more forceful, cohesive manner. With increased federal authority behind mask-wearing and organized vaccination programs with the States, together with invocation of the Defense Procurement Act for both N95 mask and vaccine production, hopefully we will see a decisive downward trend in the pandemic by the spring equinox.

Wednesday, January 20, 2021

Happy Inauguration Day!


 - by New Deal democrat

Today is a day for rejoicing!

Back to the salt mines tomorrow.

Tuesday, January 19, 2021

“Those who cannot see must feel:” a retrospective on the Trump presidency


 - by New Deal democrat

Four years ago I wrote “Those Who Cannot See Must Feel,” which is

the translation of an old German saying that I used to hear from my grandmother when I misbehaved.  It is pretty clear that, over the next four years, the American public is going to do a lot of feeling ....  The results will range somewhere in between bad, disastrous, catastrophic, and cataclysmic, depending on how badly foreign affairs are bungled and how much basic norms of republican government irreversibly give way to despotism.  

... every [other] country in the world which has a Madisonian presidential system ... ha[s] [ ] somewhere along the line fallen into despotism.  I believe that the answer until now has been that the US is the only country which had not succumbed ....

I have some hope as to the former because both China and Russia are smart enough to figure out that they can get what they want by bribing Trump without resorting to armed conflict.  As to the latter, unfortunately, I hold out little hope.... there is not the slightest reason to believe Trump will allow himself to be constrained by, well, anything.

.... I have no illusion that we can do anything to prevent what is now directly in front of us.

I touched somewhat on economics, noting that 

demand side economics which target ordinary Americans works better to improve their lot.  In simple terms, give a wealthy man money and he will hoard most of it.  Give an ordinary person money and they will spend it. Spending has a bigger multiplier effect than hoarding.

And aside from the $1200 stimulus payment in early 2020, spearheaded by Democrats in Congress, Trump’s economy coasted on record low long term interest rates created in the aftermath of the 2016 Brexit vote; while his only noteworthy economic law was the gargantuan giveaway to the wealthy in the 2018 tax cut, with exactly the (lack of) results predicted.

But, as quoted above, mainly I focused on the political repercussions.

Four years later, the best that can be said is that we avoided cataclysm. Trump didn’t launch a nuclear war, and he didn’t start any other conflagration, although he did commit an act of War against Iran, which is almost certainly going to retaliate now that Trump is out of office (the most likely target being in the Trump family, but also possibly one or more senior military officials). 

We have also gotten pretty lucky as to the deterioration in the international situation. The US alliances with NATO and Japan have held; Biden is set to rejoin the Paris climate accords immediately. China did effectively subsume Hong Kong without a peep from the US, but has not made any irreversible moves on Taiwan. The Big Unknown is Russia, where, although it didn’t militarily take over Belarus or Ukraine,  every single arms agreement has been terminated, almost certainly in accordance with a plan by Putin, and even more alarming, the US should assume at this point that Trump and his cronies have compromised the entire US defense apparatus aside from anything the Pentagon has managed to conceal from him.

But the events of January 6 showed that the internal US system has sustained grave damage. It held, due mainly to the independence of the Judiciary (which Trump never expressly disobeyed), and due to the integrity of a few crucial local and State GOP election officials. But Congressional oversight utterly failed. Trump contemptuously ignored subpoenas and legal mandates without consequence. He ignored Congressional spending restraints, invoking a State of Emergency that Congress failed to overrule (with a 2/3’s vote of both Houses being necessary). With GOP Senate backing, one impeachment and conviction attempt has already failed. 

In short, Trump effectively showed that, so long as a President has the backing a majority of the House, or 1/3+ of the Senate, he can do whatever he wants without fear of being held to account in any fashion. Put that together with effective control over the prosecutorial system and the nearly absolute pardon power, and he can behave with complete impunity. Finally, he established on January 6 that, in the future, with the backing of a majority in Congress, the will of the Electorate, even as expressly confirmed and certified by the Electoral College, can be overruled and he can continue in office. And he might even be able to pardon the perpetrators.

In other words, the last successful Madisonian system has almost certainly been fatally wounded.

Because for decades I have been a voracious reader of history, and because I believe that learning principles from psychology can be applied to society as a whole, here is some lessons about where we are in the cycle:

1. Stability breeds instability - Economist Hyman Minsky famously theorized that stability breeds instability in economic systems. It is clear that the same is true in political systems. For example, it is clear that the peace and stability in Europe in the 19th Century after 1815 bred complacency in its governing aristocratic elites. As a result, the ruling monarchies proverbially pushed on the edge of the envelope in ever more extreme fashion. And for decades, the system held. Until in 1914, it didn’t, with catastrophic effects. Stability had bred instability.

Similarly, for the past 40 years, the Right in America has become ever more radicalized, as norm after norm has been breached. And yet - until January 6 at least - the system held. Ironically the fact that the system held up for so long only encouraged more rule-breaking, more “Constitutional hardball.” After all, if the system is impregnable, why worry?

And now the fabric of the system is finally tearing.

2. The rise of brownshirts. One specific way in which the fabric of the system is tearing is the rise of brownshirts. Before Trump, it was very much a fringe problem. But first with Charlottesville, then with the Second Amendment militias appearing in State capitals like Richmond VA early in 2020, then spreading to the anti-lockdown and anti-mask movements in other State capitals like in Michigan, armed brownshirts are now regularly appearing on American streets to physically threaten and intimidate those with whom they disagree. The January 6 putsch attempt in the US Capitol, with the intention to lynch the Vice President, the Speaker of the House and others, shows that the problem is now fully-formed.

In ancient history the use of brownshirts during the times of the Gracchii Brothers in the Roman Republic was the clarion sounding for a fatal wound being inflicted on the Republic, even if it took another generation until, with Sulla’s proscriptions, the Republic was dead on its feet. In the Weimar Republic and in other fascist uprisings in Europe after WW1 the widespread appearance of brownshirts similarly hailed the beginning of the end of Constitutional government.

Borwnshirts also plagued the flailing medieval city-state Republics, particularly Genoa and Florence. And we need only mention the 20th century example of the Weimar Rebpuclic, but also armed fascist uprisings in other 20th century European States.

Now we have a pattern of right-wing brownshirts on the streets of the US. Between no left-wing counterpart, and meeting force with left-wing force, the latter is the least worst option - but in either case the Republic is failing. The only other possibility is that with ruthless and unrelenting prosecutions for threats and violence the inflorescent movement might be brought to heel.

3. The right wing has learned that it has near impunity. This brings up a more general point about learning. If you ever watched the reality show “Supernanny,” you saw parents whose households were completely ruled by young children and even toddlers, because temper tantrums had always proven effective, as one or both parents always ultimately gave in. Supernanny never advocated using force, nor any punishment worse than being forced to stand or sit in a “quiet corner.” But the system had to be used relentlessly. Any time one or both parents abandoned it, the child had simply learned that throwing a tantrum long enough was successful. Thus the longer the coddling had gone on, the longer the tantrum and the more arduous the first application of the new system had to be in order finally to break the child’s will.

Similarly, right-wing extremism has been coddled in the US for over a generation - at very least since Gingrich’s 1994 conservative revolution in Congress. The center and the left have been hoping that half-measures and indulgence will make the problem go away. Instead the problem has gotten worse and worse - because the right-wing tantrums have almost always ultimately been successful.

The Biden Presidency may be liberal democracy’s last chance in the US. Like the parents in Supernanny, Biden and the Democrats must be prepared to “flood the zone” with changes, and be unrelenting for a long time in their application, to demonstrate to the right-wing that extremist tantrums will no longer be successful. Because the right-wing extremists probably have to be successful in only one more Presidential election.

4. Finally, and most fundamentally, as David Frum wrote, “If [a faction] become[s] convinced that they can not win democratically, they will not abandon conservatism. They will reject democracy.” 

This was just as true back in Ancient Rome. The patricians who dominated the Senate, moreso than their adversaries, the plebeians and the Italian allied states, in order to prevent the dilution of their vast wealth in the latifundia (huge rural plantations), were willing to compromise and ultimately shred the entire fabric of the Republic in order to avoid that loss. Similarly, in medieval Florence, the Medicis and their allies believed they would be better off if the Republic was subverted than if it was allowed to continue. The same held true in in the faction-riven Republic of Genoa, and the partisans of Prince Willliam in the Dutch Republic.
  
Similarly, whether we call them conservative evangelicals, social conservatives, or the White Herrenvolk, there is a large minority in the US that believes that its fundamental worldview is in danger of being permanently overturned. There is also another minority of the wealthy who believe that taxation for any government programs to improve the condition of the vast lower middle and working classes is a permanent and fundamental assault on their right to sequester their (often inherited) wealth. Both of these groups have been showing, and are continuing to show, that they are prepared to overturn the US’s representative democratic system itself if that is what it takes to maintain their position.

In sum, the Trump Presidency has shown that the US representative democratic Republic is under grave assault, and has sustained near-mortal damage unless it is reversed quickly and thoroughly. Those who could not see in 2016 have been and are feeling.

Monday, January 18, 2021

NFIB small business optimism vs. reality


 - by New Deal democrat

This is a really slow news week - on the economy!  My retrospective on the Trump Presidency is nearly complete and will be published tomorrow morning.

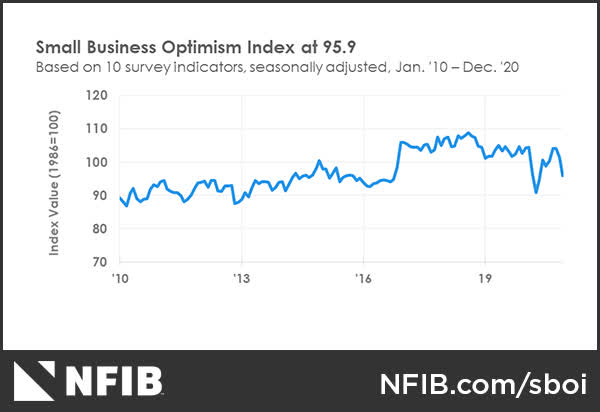
In the meantime, here is a brief note on the Small Business Optimism index which was updated for December last week, showing a steep decline across the board. Here it is:


What happened? Was there some earthshaking economic news? A hidden cataclysm of supply or demand?

Hardly.

What happened is that it became apparent to the small businessmen who primarily make up the National Federation of Independent Business that Biden had been elected to the Presidency.

As has been noted from time to time, Trump’s core constituency is not the white working class, but rather white small businessmen. When Trump shockingly won the 2016 election, their outlook soared - as is easily seen on the graph. Now that Trump has lost in 2020, their viewpoint has returned to where it was under Obama (note: the other big downward spike was March and April, when the COVID lockdowns went into effect).

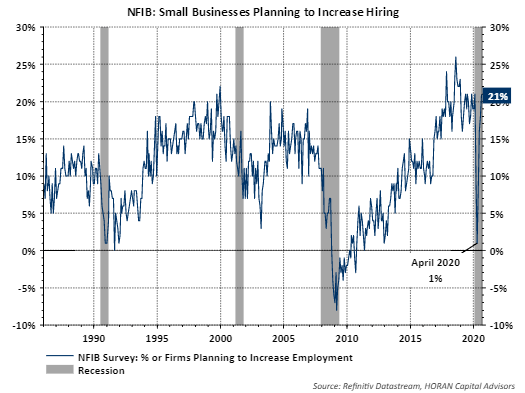
A similar effect shows up in the same survey’s index for hiring plans:


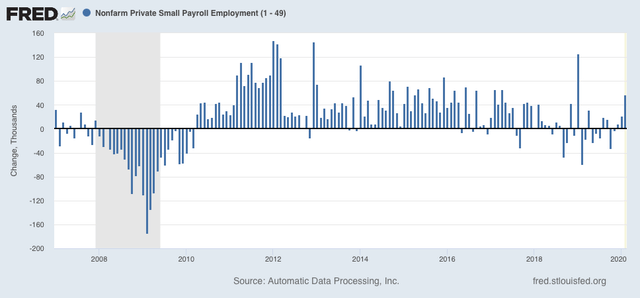
What actually happened, according to ADP’s index of small business hiring, is that it tapered off dramatically after 2017, and after surging the most from 2011-15:


Gee, small businessmen didn’t actually hire more workers in response to bog-standard GOP economic policies. Hoocoodanode?

Sunday, January 17, 2021

The Federalist Papers #74 on insurrections, treason, and the pardon power: an argument that such pardons would be invalid as “arising in a case of impeachment”


 - by New Deal democrat

The Insurrectionists from January 6 are already asking Trump for pardons. Probably the only thing that would hold him back from doing so is his innate selfishness: what would be the benefit to *him*?

The thought that Trump could issue Got Out of Jail Free cards to the very people he incited to riot is mind boggling.

But it’s at least possible that he might not have the right to do so. 

Article III, Section 2 of the Constitution provides that “The President ... shall have the power to grant] reprieves and pardons for offenses against the United States, EXCEPT IN CASES OF IMPEACHMENT.'' 

That last bit isn’t just my emphasis. It’s also the emphasis placed on the quote in the discussion of the President’s pardoning power in The Federalist No. 74, which also discusses the right of the President to issue pardons in the cases of sedition and treason. Below is the entirety of the relevant discussion: 

Humanity and good policy conspire to dictate, that the benign prerogative of The expediency of vesting the power of pardoning in the President has, if I mistake not, been only contested in relation to the crime of treason. This, it has been urged, ought to have depended upon the assent of one, or both, of the branches of the legislative body. I shall not deny that there are strong reasons to be assigned for requiring in this particular the concurrence of that body, or of a part of it. As treason is a crime leveled at the immediate being of the society, when the laws have once ascertained the guilt of the offender, there seems a fitness in referring the expediency of an act of mercy towards him to the judgment of the legislature. And this ought the rather to be the case, as the supposition of the connivance of the Chief Magistrate ought not to be entirely excluded. But there are also strong objections to such a plan. It is not to be doubted, that a single man of prudence and good sense is better fitted, in delicate conjunctures, to balance the motives which may plead for and against the remission of the punishment, than any numerous body whatever. It deserves particular attention, that treason will often be connected with seditions which embrace a large proportion of the community .... In every such case, we might expect to see the representation of the people tainted with the same spirit which had given birth to the offense. And when parties were pretty equally matched, the secret sympathy of the friends and favorers of the condemned person, availing itself of the good-nature and weakness of others, might frequently bestow impunity where the terror of an example was necessary. 


On the other hand, when the sedition had proceeded from causes which had inflamed the resentments of the major party, they might often be found obstinate and inexorable, when policy demanded a conduct of forbearance and clemency. But the principal argument for reposing the power of pardoning in this case to the Chief Magistrate is this: in seasons of insurrection or rebellion, there are often critical moments, when a well-timed offer of pardon to the insurgents or rebels may restore the tranquillity of the commonwealth; and which, if suffered to pass unimproved, it may never be possible afterwards to recall. The dilatory process of convening the legislature, or one of its branches, for the purpose of obtaining its sanction to the measure, would frequently be the occasion of letting slip the golden opportunity. The loss of a week, a day, an hour, may sometimes be fatal. If it should be observed, that a discretionary power, with a view to such contingencies, might be occasionally conferred upon the President, it may be answered in the first place, that it is questionable, whether, in a limited Constitution, that power could be delegated by law; and in the second place, that it would generally be impolitic beforehand to take any step which might hold out the prospect of impunity. A proceeding of this kind, out of the usual course, would be likely to be construed into an argument of timidity or of weakness, and would have a tendency to embolden guilt.


On the one hand, the above passage would seem to support the right of Trump to pardon the seditionists of January 6. But I think there is an important distinction.

Federalist No. 74 envisions the President intervening in moments of societal peril so that “a well-timed offer of pardon to the insurgents or rebels may restore the tranquillity of the commonwealth.” While certainly not exactly on point, this is akin to Jimmy Carter’s blanket pardon of Vietnam War draft dodgers - an attempt to heal a festering rift in society. In the hypothetical noted by the Federalist papers, it defuses an imminent rupture.

But that is exactly opposite to the case where the sedition has occurred precisely *because* of incendiary actions of the very President himself. In this case, take out Trump’s own incitement, and there is no riot or sedition.

Further, Trump has in fact *been impeached* by the House, whether or not he is ever convicted by the Senate. So the criteria for the exception - “except in cases of impeachment” - while they may specifically be meant to exclude pardons for those civil officers who have been impeached, nevertheless may apply here. Literally, textually (for those who are devotees of textualism, as current members of the Supreme Court allegedly are), the acts for which the insurrectionists are seeking pardons exactly gave rise to this “case of impeachment.” Further, had the Founders chose to do so, they could have said that the exception only applies “in cases of impeachment *and conviction.*” They didn’t include that qualification, and in other cases, e.g., theSlaughterhouse Cases concerning the 14th Amendment, the Supreme Court has held such omissions to be meaningful. 

In short, even if Trump does issue pardons to the insurrectionists, I think prosecutors should argue that the pardons are invalid under the Constitution. The cases would surely be taken to the Supreme Court, where both the textualists and those looking to the spirit of the law, surely aware that these cases are “sui generis” (I.e., in a class all by themselves, extremely unlikely ever to be repeated), might decide that the pardons arose “in a case of impeachment” and hold that the proffered pardons are null and void.