Thursday, April 23, 2020

Abbreviated Coronavirus dashboard for April 23: New York accounts for ALL of the US’s progress


 - by New Deal democrat

No big changes today, and since a picture is worth 1000 words, let me let the graphs speak pretty much for themselves.


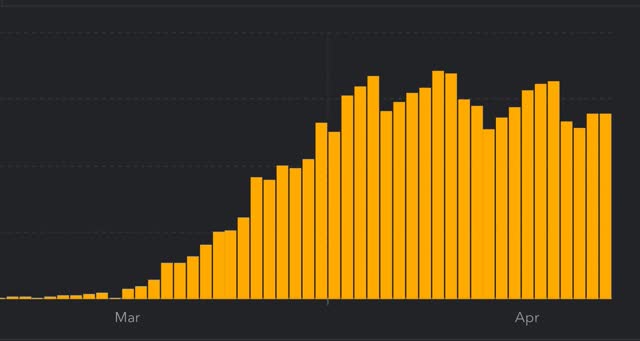
1. Daily infections for the US as a whole continue to look like they are trending slightly down (but more on that below):
 

2. The 7 day rate of new infections remains stuck at +4%. There is very little evidence of this rate of increase slowing:

3. The trend in deaths has not peaked:

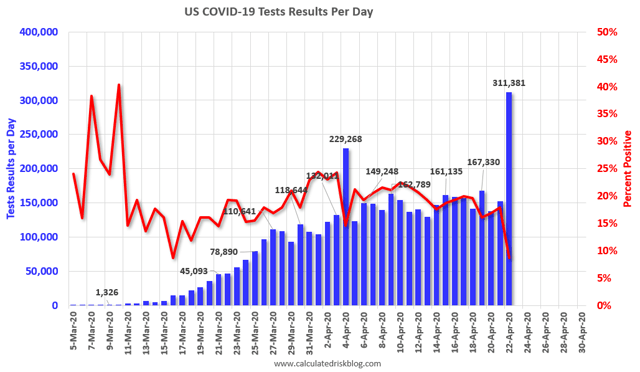
4. California cleared a big backlog in testing yesterday, which is why the number of tests spiked and the ratio of positive tests to total tests sharply declined: 

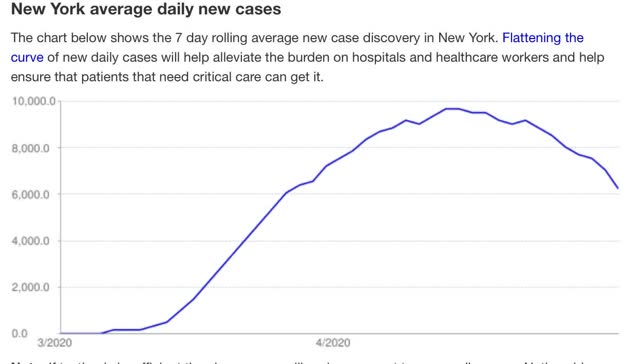
5. BUT - when we look at the 7 day rolling average of new daily infections, New York State has steeply declined, by over 33%, from a peak of 9,651 on April 9 to 6,205 yesterday: 
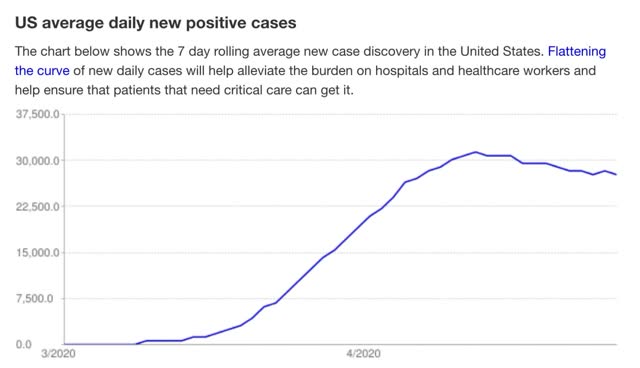
6. By contrast, during that same period the decline for the entire US has only been a little *under* 3,000 new infections daily, from 30,747 to 27,754:

(H/t Department of Numbers for graphs #5&6)

7. Which means that the 3,400+ decline in NY accounts for *more* than the entire decline in the US, I.e., ex-NY new infections have continued to *climb* slightly over the past 2 weeks.  Not good at all, and certainly not a basis for any “opening up” of the economy. 

Wednesday, April 22, 2020

The actual US coronavirus trajectory: “flattening the curve” at least until 2021


 - by New Deal democrat

You probably remember the diagram from a month or so ago about “flattening the curve” of coronavirus infections. This was the concept that, once efforts to contain the pandemic had failed, the least worst option was to slow the spread of the infection so that medical facilities and supplies were not overwhelmed, because if infections exceeded medical capacity, many unnecessary deaths would occur.

“Flattening the curve” was not such an appetizing option either, because it meant that *everybody* got infected with the disease during the period of flattening, and so the death toll would still be horrifying, perhaps 1% to 3%. It also meant that the period that the infection would curtail society was extended to several years. 

Shortly a much better alternative, based on the success of South Korea, was embraced. Described as “crush the curve,” it meant imposing firm lockdowns for a long enough period of time for thoroughgoing testing of the population, tracing contracts of those infected, and isolating the infected to be ramped up and in place. 

Here’s what the three alternatives look like in a diagram:
Throughout the latter part of March and into early April, one by one all but a few, mainly rural, States imposed lockdowns, and the rate of new infections quickly plateaued. But, due to the intransigence of Donald Trump personally and key members of his Administration, the ability to test in the number required was never implemented. In particular, Trump resisted for weeks making use of the Defense Procurement Act for obtaining the necessary medical equipment quickly.  He has never given the slightest indication that he views doing widespread testing as either necessary nor (politically) desirable. 

Now Trump appears to have reverted to his original approach from January and February: do as little as possible so that he can (in his mind) credibly deny responsibility, and forecast that the pandemic is receding or ending. He is railing almost daily against continued lockdowns, and his attorney general is threatening to sue States that do not comply with “reopening the economy.”

In short, any momentum towards “crushing the curve” has come to a halt, and there have even been reversals.

Plainly Trump’s number one priority is not public health, but rather to have the worst of the pandemic - whatever that might be - over by autumn, so that he can run for re-election as a leader who successfully navigated the issue. He is being supported in this position by a few Trumpist governors and a number of plutocrats who are astroturfing protests against governors who have implemented lockdowns.

But however much Trump might want to let the pandemic “wash over” society quickly, that approach is decisively not supported by a large majority of the public. This is why recalcitrant States in the old Confederacy ultimately gave in to pressure to implement lockdowns in the first place. What is going to happen in the States that “reopen” is that the disease will resurge towards exponential spread again, and that is going to lead to even more intense backlash and public pressure on the Trumpist governors to reimpose lockdowns. Meanwhile the Trump Administration’s absolute refusal to implement (and even to undermine) the regimen necessary to “crush the curve” means that option won’t happen either.

So what I see as likely to be the path of the pandemic in the US over the remainder of the year is one in which there are periodic flare-ups towards uncontrolled spread, followed by similar periods of being locked down but without the necessary conviction in the Administration to “crush the curve.”

And that means that, when all is said an done, the US is on a path of a year+ long period that most resembles “flattening the curve.” Most of the population will continue “social distancing” and even self-quarantine if possible, while those who see their risk as very small (the young) and those who are reckless will mainly resume close to normal activities. The disease will continue to slowly spread, and daily deaths will continue on a course for 1%+ mortality over several years. Except in local spots, the medical system will not be overwhelmed. But nor will meaningful progress be made towards containing the virus.

Finally, because the virus will be continuing to spread at roughly the rate it is now, and continuing to kill people at roughly the rate it is now, a very large percentage of people will refuse to engage in activities that require large social exposure. And that means that large portions - maybe even a majority -of the economy will continue on a path of contraction or stagnation, leaving an ever spreading wave of bankruptcies and closures in its path.

Since I do not see Trump ever changing, this path looks inevitable to me through the end of the year. Until at least next January 20, when the political situation might change dramatically, the US is going to follow a waxing and waning path of “flattening the curve.”
Coronavirus dashboard for April 22: a very discouraging day


 - by New Deal democrat

Here is the update through yesterday (April 21) 

As usual, significant developments are in italics. Yesterday was discouraging, as both daily new infections and deaths made new highs. All progress on “test, trace, and quarantine” seems to have stopped, and lockdowns are actively unraveling in some places.

Here are yesterday’s numbers. 

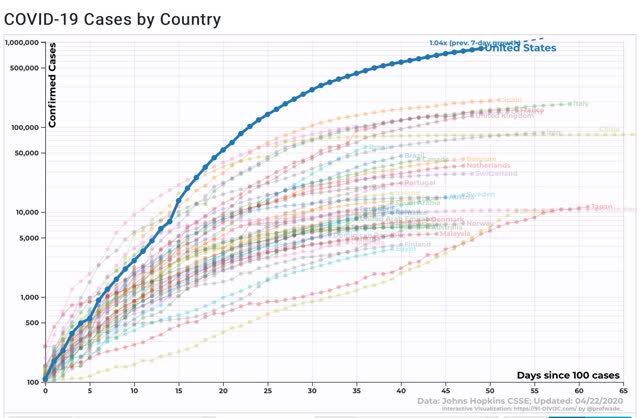
Number and rate of increase of Reported Infections (from Johns Hopkins via arcgis.com)
  • Number: up +37,346 to 825,306 (new daily peak)

  • ***Rate of increase: day/day: 5% (vs. 4% for the past week, and 4% on April 18)

The number of new infections made another new peak. The trend had seemed to be a slight decrease in the number of new cases. It is possible yesterday represented an outlier due to increased reporting.
Number of deaths and infections and rate of increase of testing (from COVID Tracking Project)
  • ***Number of deaths: Total 39,995, increase of +2,647 day/day (new daily high)

  • Rate: increase of 7% day/day vs. average of 7% in past week
  • Number of tests: 151,627, up day/day (vs. daily peak of 167,350 on April 18)
  • Ratio of positive tests to total: 5.6:1 (vs. daily peak of 6.2:1 on April 18)

US States and population in total lockdown, business lockdown, and partial restrictions - 3 renegades
Below are the States that have not gone to lockdown orders:
  • Partial restrictions on business (bars, restaurants): 5 States (IA*, ND^, NE, UT*^, WY^) 9.7 million, 2.9%
  • School closure only: 2 States (AR^, SD*) 3.9 million, 1.2%
  • Renegades (opening up w/o adequate precautions): (GA, TN, SC):22.5 million, 6.8%
*some local areas under lockdowns
^restrictions on or quarantine of travelers from out of State
US States and population with “test, trace, and quarantine” programs
  • East Coast consortium: 7 States: CT, DE, MA, MD, NJ, NY, PA, RI (53.7 million)
  • West Coast consortium: 3 States: CA, OR, WA (31.3 million)
  • Midwest consortium: 7 States: IL, IN, KY, MI, MN, OH, WI (57.0 million)
  • Mid-Atlantic consortium*: 3 Jurisdictions: DC, MD, VA (15.2 million)
  • Other areas of regional cooperation per map below:

*informal cooperation
Total population covered by consortiums: 157.2 million)
Summary for April 19

Here’s how we stand: 
  • The total US population remains under total lockdown is declining from about 95% to about 88% due to the three renegades in the Confederacy (which were also among the very last States to go to lockdowns a few weeks ago)
  • Both the number of daily new infections and deaths made new peaks. I seem to recall that one State had a slew of new reports yesterday, so this may be an outlier.
  • The trend number of daily tests appears to have improved a little bit to about 150,000-160,000. We are continuing to miss a large percent of new infections. My personal suspicion is that the actual number of total infections in the US is about 5x the official number, or roughly 4.1 million at present.
  • 20 States with almost half the US population  are either coordinating in making purchases of the necessary equipment, and/or to develop their own “test, trace, and quarantine” plan, but specifics in how to accomplish that have not emerged.
  • In general, progress has stalled, as Trump has reverted to his original desire to let the virus “wash over” society. He has found sympathetic ears in much of the Confederacy. Aside from travel restrictions, sending two hospital ships to two cities, and using the Defense Procurement Act once for ventilators and once for nasal swabs, he has done nothing to actually assist in containing the pandemic. Kushner’s ad how group has actively interfered in State and private groups’ actions to obtain necessary supplies.

Tuesday, April 21, 2020

Rates of testing, positive tests, and new infections by State


 - by New Deal democrat

So that I don’t lose them, I wanted to publish both the rates of testing (and positive tests) by State, as well as the (Rt) or rate of new infections for each. Both of these are as of last week.

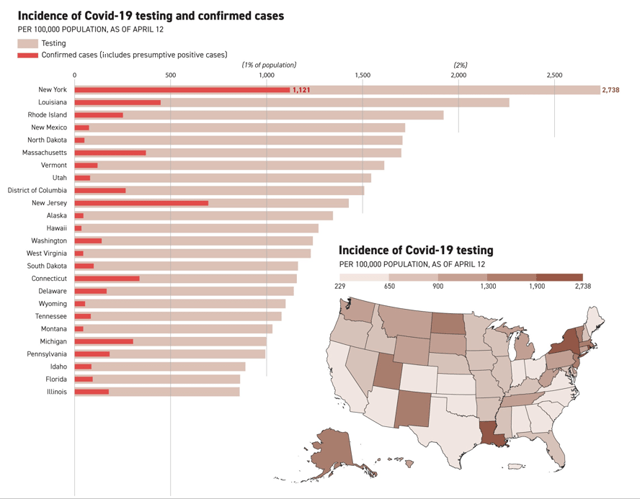
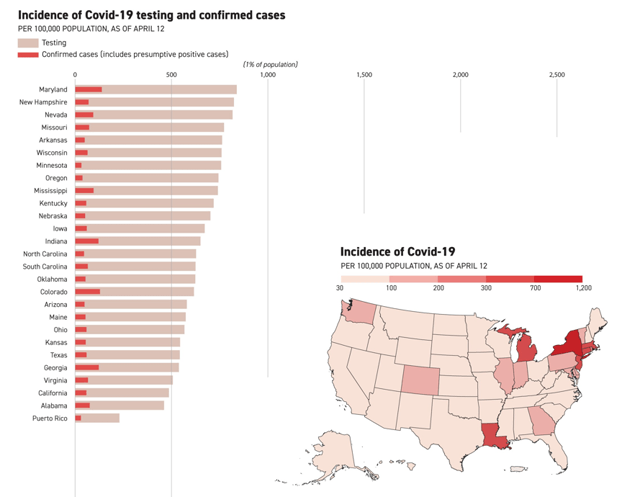
Here is the rate of testing (pink) and rate of positive tests (red) for each State:


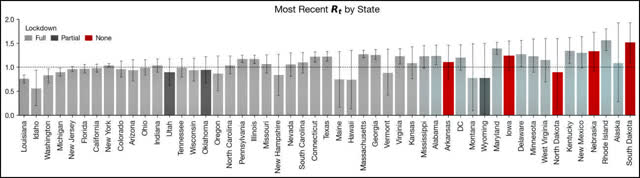
Here is the (Rt) rate of new infections by State (the skinny lines at the top of each are the Confidence intervals): 


The two States that have the most testing — LA and NY —  have the lowest Rt’s, which are less than 1, I.e., new infections are actually declining. 

By contrast, Georgia, which just rescinded its lockdown, is one of the 5 worst States for rate of testing, and is in the upper range rates of growth in new infections. In other words, Georgia isn’t plateauing, and has a lot more infections that it isn’t catching. Coronavirus will be an unforgiving teacher.