Tuesday, April 21, 2020

Coronavirus dashboard for April 21: as the trends look a little more positive, the retrograde renegades appear


 - by New Deal democrat

Here is the update through yesterday (April 20) 

As usual, significant developments are in italics. Yesterday the slightly positive trends in new infections and deaths continued; while 3 retrograde renegade Trumpist governors decided to “open up” their States, which should lead to a nice big increase in new infections in those States in a couple of weeks.

Here are yesterday’s numbers. 

Number and rate of increase of Reported Infections (from Johns Hopkins via arcgis.com) 
  • Number: up +28,174 to 787,960 (vs. 35,354 prior peak on April 17)

  • ***Rate of increase: day/day: 4% (vs. 4% for the past week, and 3% on April 18)

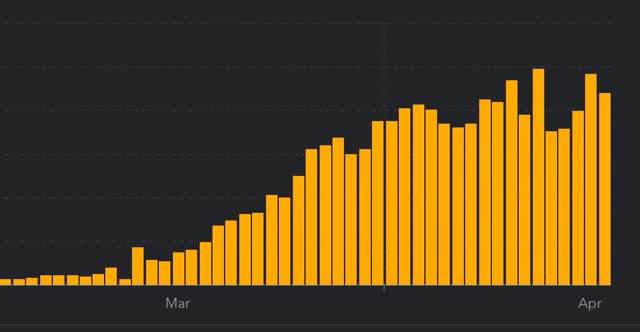
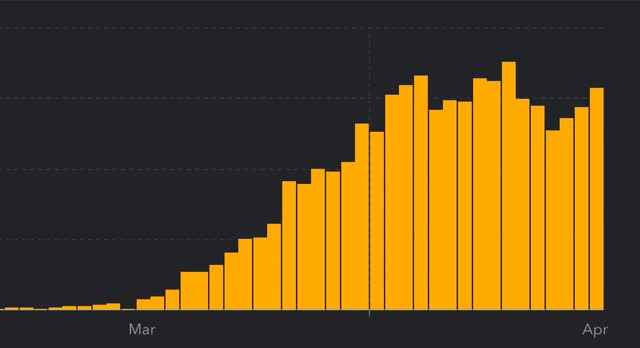
The number of new infections made a new peak last Friday. The trend seems to be a slight decrease in the number of new cases.
Number of deaths and infections and rate of increase of testing (from COVID Tracking Project)
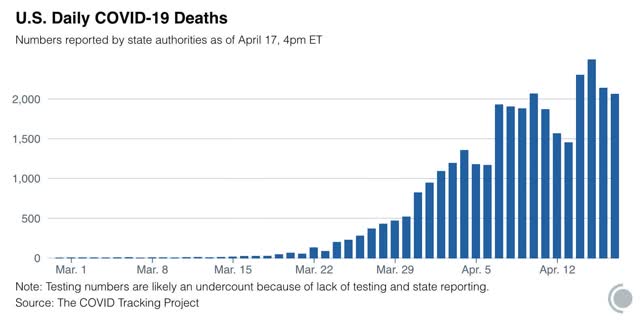
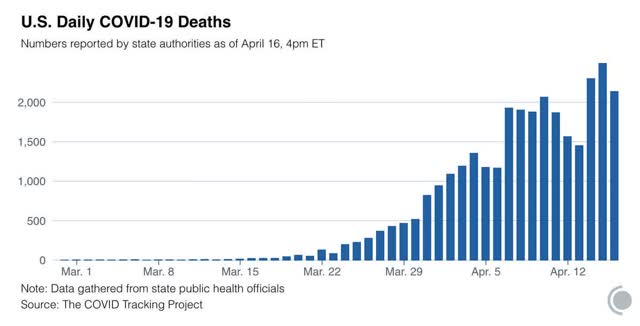
  • ***Number of deaths: Total 37,321, increase of +1,528 day/day (vs. 2,492 daily high on April 15)

  • Rate: increase of 4% day/day vs. average of 7% in past week (new low in rate of increase)
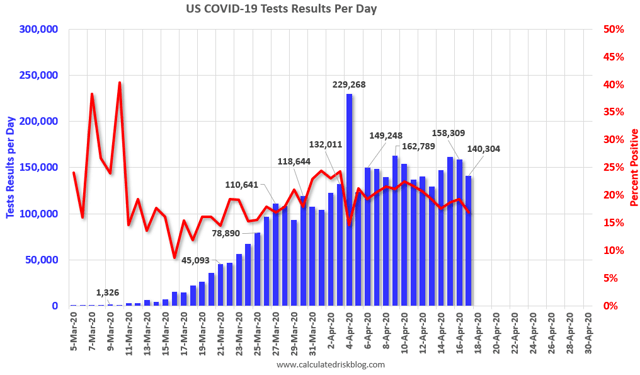
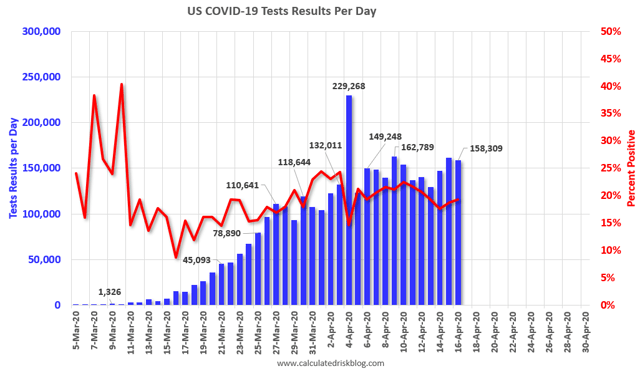
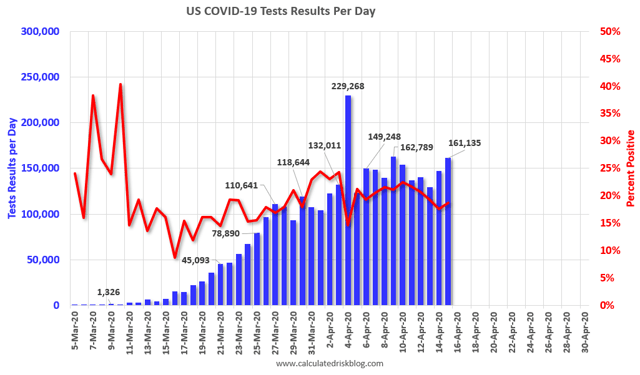
  • Number of tests: 137,687, down -29,357 day/day (vs. daily peak of 167,350 on April 18)
  • Ratio of positive tests to total: 5.9:1 (vs. daily peak of 6.2:1 on April 18)

US States and population in total lockdown, business lockdown, and partial restrictions - 3 renegades
Below are the States that have not gone to lockdown orders:
  • Partial restrictions on business (bars, restaurants): 5 States (IA*, ND^, NE, UT*^, WY^) 9.7 million, 2.9%
  • School closure only: 2 States (AR^, SD*) 3.9 million, 1.2%
  • Renegades (opening up w/o adequate precautions): (GA, TN, SC):22.5 million, 6.8%
*some local areas under lockdowns
^restrictions on or quarantine of travelers from out of State
US States and population with “test, trace, and quarantine” programs
  • East Coast consortium: 7 States: CT, DE, MA, MD, NJ, NY, PA, RI (53.7 million)
  • West Coast consortium: 3 States: CA, OR, WA (31.3 million)
  • Midwest consortium: 7 States: IL, IN, KY, MI, MN, OH, WI (57.0 million)
  • Mid-Atlantic consortium*: 3 Jurisdictions: DC, MD, VA (15.2 million)
*informal cooperation
Total population covered by consortiums: 157.2 million)
Summary for April 19

Here’s how we stand: 
  • The total US population remains under total lockdown is declining from about 95% to about 88% due to the three renegades in the Confederacy (which were also among the very last States to go to lockdowns a few weeks ago)
  • The trend in the number of daily new infections appears to be one of slight decline. Deaths appear to be plateauing. I am looking for a decline of roughly 15%/week in new infections if the peak has indeed been reached, so long as the lockdowns stay in place.
  • The trend number of daily tests appears to have improved a little bit to about 160,000, although yesterday was a poor day. We are continuing to miss a large percent of new infections. My personal suspicion is that the actual number of total infections in the US is about 5x the official number, or roughly 3.8 million at present.
  • The Trump Administration, after taking no steps for weeks, towards a nationwide “test, trace, and quarantine” plan that will be needed to lift lockdowns, or to assist States to do so, finally gave in to the unified voice of the States’ governors and utilized the Defense Production Act to order the production of the swabs necessary for use in the tests.
  • 20 States with almost half the US population  are either coordinating in making purchases of the necessary equipment, and/or to develop their own “test, trace, and quarantine” plan, but specifics in how to accomplish that have not emerged.
  • There have been small but very well publicized astroturf protests against lockdowns in States with Democratic or non-Trumpist Republican governors.

Monday, April 20, 2020

Trends in US States compared by coronavirus response


 - by New Deal democrat

I mentioned over the weekend that I wanted to break out and look at some different aspects of the coronavirus pandemic.

Here’s the first: how are States at different ends of the restrictions and testing spectrums faring?

Seven States have never even mandated lockdowns. Let’s look at these, alphabetically:

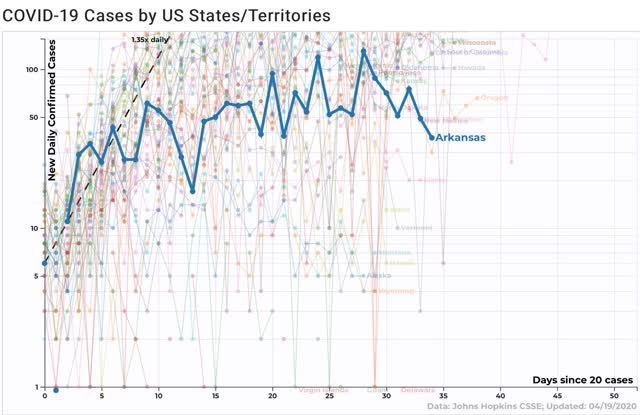
Arkansas:

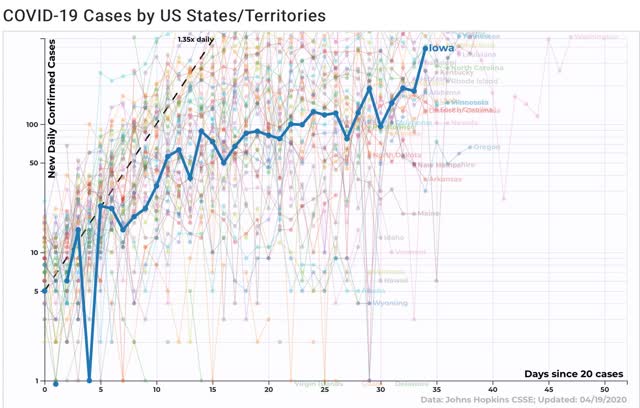
Iowa: 
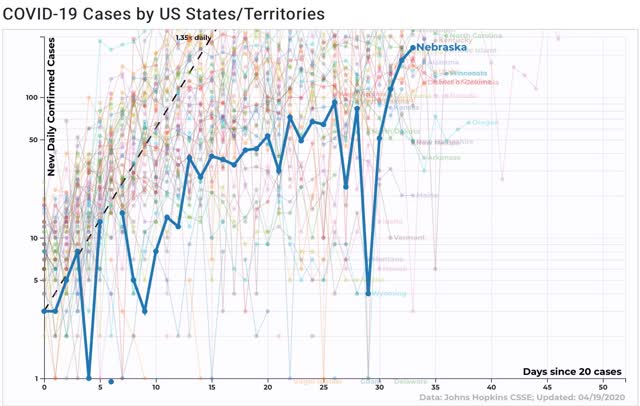
Nebraska:
  
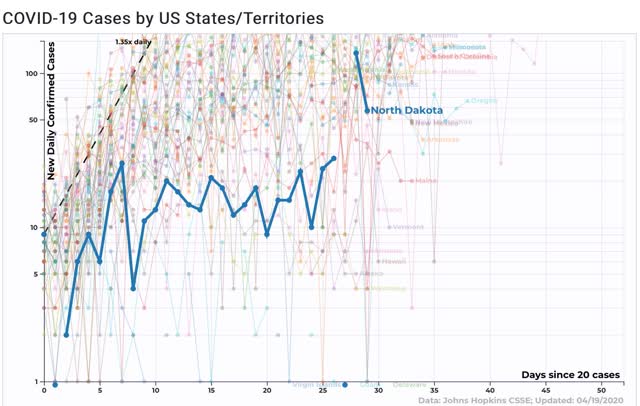
North Dakota 

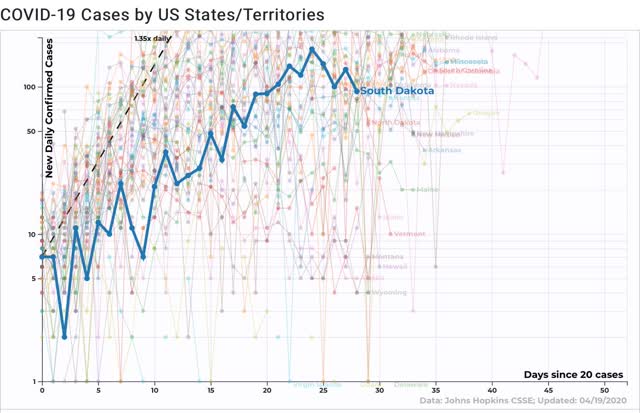
South Dakota:

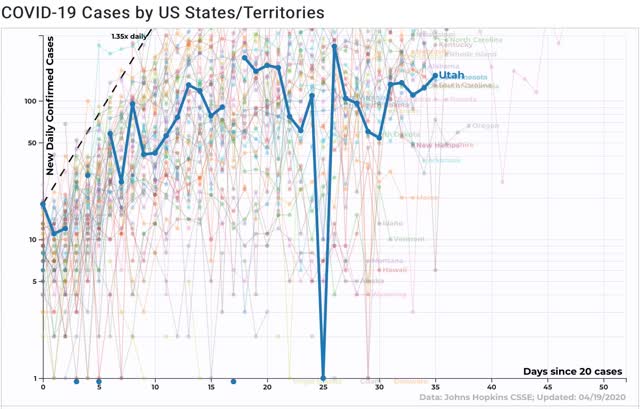
Utah:

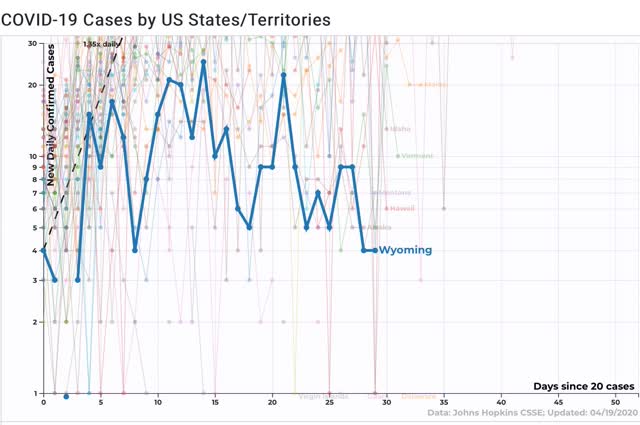
Wyoming:


Four of the seven continue to show a trend of increasing infections. Arkansas and Utah appear to have plateaued, and Wyoming has such a small number that it’s decline is in single digits and not significant.  The virus in the 4 States with increasing numbers isn’t under control at all — but all of these States have small populations and are very rural. Urban areas in several (Iowa and Utah) are in lockdowns. 

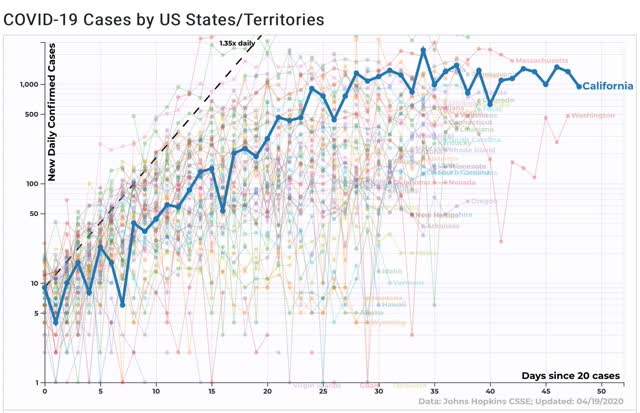
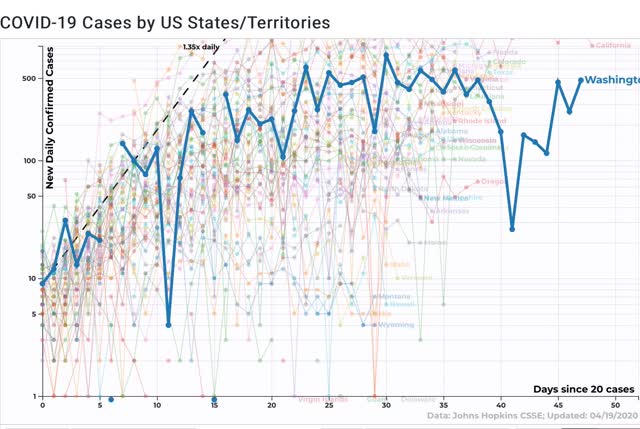
By contrast, here are 2 the States that got real - California and Washington State - real quick:

California:


Washington:


Both of these are pretty clearly past their peaks, although the recent rebound in Washington is concerning. 

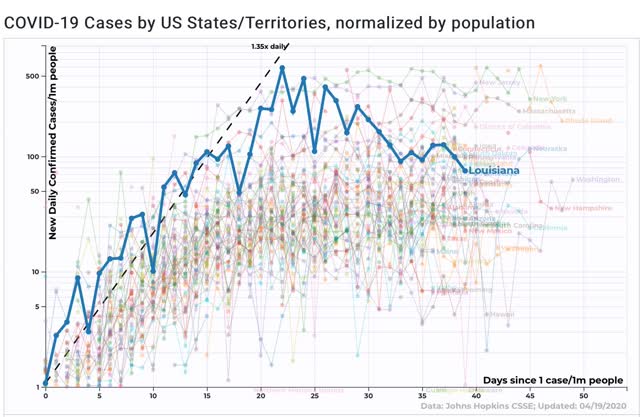
Louisiana, which had a severe outbreak after Marci Gras, and reacted decisively, is particularly heartening:


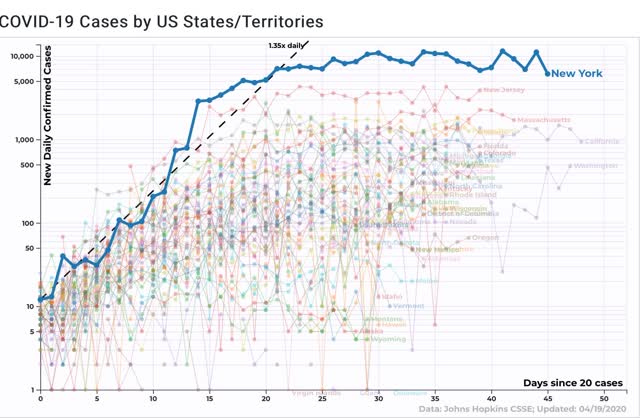
A similar pattern is shown for New York, which also appears to be past its peak.


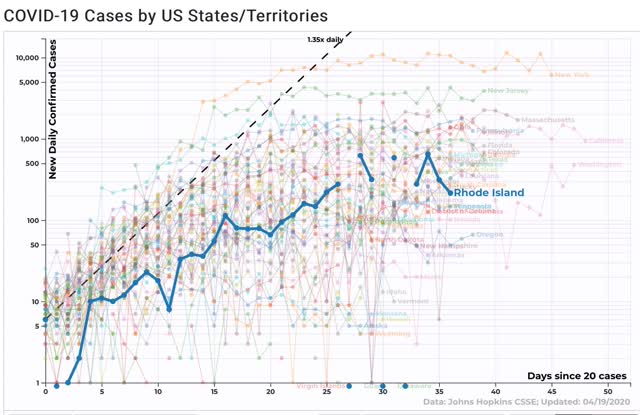
Finally, here is Rhode Island. It looks awful, but actually what has happened is that this State really ramped up testing. As a result, it found a lot more cases:


New York did the same thing. Increasing testing is going to show a lot more infections, which is probably an important reason why Trump has been dragging his feet so badly on this issue.

Coronavirus dashboard for April 20: a few positive developments


 - by New Deal democrat

Here is the update through yesterday (April 19) 

As usual, significant developments are in italics. Yesterday saw the biggest number of daily tests, and ratio of total vs. positive tests so far, both positive developments.  The number and rate of daily infections and deaths also declined, but that may be a function of lower weekend reporting.

Here are yesterday’s numbers.

Number and rate of increase of Reported Infections (from Johns Hopkins via arcgis.com)
  • Number: up +24,499 to 759,786 (vs. 35,354 prior peak on April 17) 

  • ***Rate of increase: day/day: 3% (vs. 4% for the past week, and 4% on April 18)

The number of new infections made a new peak last Friday. The numbers seem to go down on weekends, so take the low new infection number with a grain of salt. Still, the trend seems to be a slight decrease in the number of new cases.
Number of deaths and infections and rate of increase of testing (from COVID Tracking Project)
  • ***Number of deaths: Total 35,793, increase of +1,654 day/day (vs. 2,492 daily high on April 15)

  • Rate: increase of 5% day/day vs. average of 7% in past week
  • Number of tests: 167,330, up +25,289 day/day (new daily peak)
  • Ratio of positive tests to total: 6.2:1 (new daily peak)

US States and population in total lockdown, business lockdown, and partial restrictions - no changes
Below are the States that have not gone to lockdown orders:
  • Partial restrictions on business (bars, restaurants): 5 States (IA*, ND^, NE, UT*^, WY^) 9.7 million, 2.9%
  • School closure only: 2 States (AR^, SD*) 3.9 million, 1.2%
*some local areas under lockdowns
^restrictions on or quarantine of travelers from out of State
US States and population with “test, trace, and quarantine” programs
  • East Coast consortium: 7 States: CT, DE, MA, MD, NJ, NY, PA, RI (53.7 million)
  • West Coast consortium: 3 States: CA, OR, WA (31.3 million)
  • Midwest consortium: 7 States: IL, IN, KY, MI, MN, OH, WI (57.0 million)
  • Mid-Atlantic consortium*: 3 Jurisdictions: DC, MD, VA (15.2 million)
*informal cooperation
Total population covered by consortiums: 157.2 million)
Summary for April 19

Here’s how we stand: 
  • About 95% of the total US population remains under total lockdown.
  • In States with no lockdowns, Trumpist governors in Wyoming and North Dakota have spoken of easing restrictions further by May 1. In Florida, a few beaches were opened up and became crowded.
  • The trend in the number of daily new infections appears to be one of slight decline. Deaths appear to be plateauing. I am looking for a decline of roughly 15%/week in new infections if the peak has indeed been reached, so long as the lockdowns stay in place.
  • The number of daily tests has improved a little bit to about 160,000, and we just got a new daily high. We likely are continuing to miss a large percent of new infections. My personal suspicion is that the actual number of total infections in the US is about 5x the official number, or roughly 3.8 million at present.
  • The Trump Administration has taken no steps - and realistically will never take steps -towards a nationwide “test, trace, and quarantine” plan that will be needed to lift lockdowns, or to assist States to do so, and is using a haphazard, secret, and likely corrupt method of distributing vital medical equipment.
  • In the absence of federal action, 20 States with almost half the US population  are either coordinating in making purchases of the necessary equipment, and/or to develop their own “test, trace, and quarantine” plan, but specifics in how to accomplish that have not emerged.
  • Trump finally invoked the Defense Production Act to get a company to mass produce testing swabs, which have been a key bottleneck in increasing the number of tests, after a conference call with governors.
  • There have been small but very well publicized astroturf protests against lockdowns in States with Democratic or non-Trumpist Republican governors.

Sunday, April 19, 2020

Towards a modern “History of Republics”: a consideration of William Everdell’s “The End of Kings: A History of Republics and Republicans”


 - by New Deal democrat

In view of the horrific damage that the Trump Administration has done to the American Republic, during the past year I have done extensive reading of the histories of a number of the most successful or durable Republics over time. The reason has been to try to answer the question of whether there is an overarching narrative to the history of Republics: how they form and evolve over time, and whether they are ultimately doomed, as was Rome, to collapse into autocracy. As I briefly detail below, the answer to that last query, thankfully, appears to be a qualified and very hedged “no,” although maintaining one over the long term, as Benjamin Franklin quipped, is difficult. What has been missing is an overall “History of Republics.” 

Americans generally are probably ignorant of the fact that Republics did not die during the 1800 years between Caesar crossing the Rubicon and the Declaration of Independence.  As I’ve written previously, Roman Emperors maintained many of the forms, if not the substance, of Rome’s republican offices, e.g., tribunes and consuls. After the Western Empire fell, a welter of small northern Italian city-states reconstituted Republics based more or less on the legacy Roman model. Subsequently the Swiss Cantons and the Netherlands also developed into republics, as did Great Britain briefly during its Commonwealth. 

William R. Everdell’s “The End of Kings: A History of Republics and Republicans” is a decent introductory level text exploring this issue. Each chapter is devoted to leading figures in historical republics: the prophet Samuel, Solon of Athens, two Brutuses at the beginning and end of the Roman Republic, the mythical William Tell of the Swiss cantons and John Calvin of Geneva, Machiavelli and medieval Florence, John Milton and Cromwell’s English Commonwealth, Robespierre of the revolutionary French first republic, Leon Gambetta and the founding of a parliamentary third French Republic, the Weimar failure, and John Adams, Ben Franklin, Thaddeus Stevens and several Senators over time in the US.  

While there was no overarching dynamic, I did feel that at least I had not missed any important historical developments in my earlier reading. And the book does have an overall thesis: the enemy of Republics is inadequately checked Executive power.

To begin with, Everdell asks a basic question: what is a Republic? John Adams answered that it is defined as the Rule of Law rather than the rule of man; but Everdell prefers simply that it is government by no one individual; hence, “the end of kings.” 

I disagree here: is rule by a five man military junta a republic? Obviously not. Rather, the fundamental difference in a republic is that the law-giver(s) are himself (themselves) made subject by other office-holders to the laws that they enact or enforce both in theory and in fact. One man rule obviously fails this test; but so can other systems if the lawgivers are not realistically subject to having the laws enforced against them. 

I think Everdell is on the right track, however, in his wariness of strong Executive authority, and the corollary that a republic cannot long be an empire (because an empire requires a strong central Executive). He is plainly not a fan of the Madisonian presidential system; and *is* a fan of parliamentary representative democracies (realistically including “Constitutional” monarchies, where the monarch is simply the ceremonial Head of State, much as are figurehead Presidents in parliamentary systems). This is because in the former it is far too easy for the president to arrogate more and more autocratic power to his office, while it is much more difficult in the latter.

While the chapter-length biographies are interesting, where Everdell really shines is in his last chapter in which he draws conclusions. Surveying 3000 years of history, he writes that

To achieve this difficult goal [of preventing Executive autocracy], the republican leans on four essential political techniques ... [which] are, in alphabetical order: minimizing appointment, multiplying constituencies, rotation in office, and separation of powers.

(p. 298)

Briefly, the less law -making and -enforcement authority is done by those appointed by an Executive, the more loyalty will exist to the Constitutional system rather than towards the appointing office and the individual occupying it. Multiple electorates give multiple legitimacies (viz. State governors vs. the president during the coronavirus epidemic). Rotation in office prevents arrogation of power over time by one person; further, when today’s Executive knows, as did the magistrates in midieval Venice, that he will shortly revert to ordinary citizen subject to law enforcement, he is far less likely to want to enshrine overweening Executive authority. 

Finally, more importantly and specifically, as to separation of powers,

Since the ancient writers Polybios and Aristotle, much of republican thought has in fact been devoted to identifying those powers [that must be separated] and defining them. For the past two centuries the consensus has been that there are essentially three of them: law, money, and war.... For the republic to hold power, therefore, it must divide [these three powers] among several real hands. The irreducible minimum of magistrates in a republic must then be three, at least one for each power. 

(p.302)

I believe this last point is very well taken. An Executive who can control taxation, the law, and the military all at the same time is well on his way to becoming a tyrant if he chooses. The US Constitution, as written, gave Congress power over taxation and the decision to make war. The Presidency only had control over administration of the law, and even there was subject to the Courts.  

We see today that all of these have been eroded. War-making realistically has long been ceded to the Presidency. We have now seen Trump decide either to spend or to withhold money on his own in defiance of the will of a majority of Congress (aided by a fundamentally wrong Supreme Court decision mandating a 2/3’s majority of both Houses of Congress to overrule that decision). And we have Department of Justice guidance that criminal law is not to be enforced against a sitting President (which means, for example, that Trump’s likely obstruction of justice as indicated in the Mueller report must go un-prosecuted).

It is for the above reasons that Everdell prefers parliamentary democracies. (Alternatively, in our federal system, one solution might be a critical mass of State Governors and/or Attorneys General that could be empowered to bring enforcement actions, both civil and criminal, against an abusive President and his office.) 
   
In ancient times, Aristotle believed that republics always decayed into democratic mob rule and from there into tyrannies. Polybios erroneously, as it turned out, thought that the Roman Republic had achieved a counterbalance against that tendency. Machiavelli, before he wrote “The Prince,” wrote a multi-volume “Discourses on Livy,” in which he examined the structure of republics.

With more than 500 years of history since Machiavelli, it is worthwhile to update the query: Is there a long-cycle dynamic to the evolution of republics? 

For example, successful republics seem to form after an autocracy is thoroughly discredited by military defeat, or else on the periphery of civilizations: the republics of ancient Rome, as well  as midieval Venice, Genoa, and the Netherlands all formed distant from the most powerful States of their time, as did the US in far-away North America. Specifically, Venice was founded by Roman citizens fleeing the Goths and later the Lombard invaders to sandy islands in the Adriatic. The Netherlands was similarly founded by tribes fleeing invaders to the marshy delta of the Rhine.  

Further, because there is no monarchical family vacuuming up wealth, republics tend to be mercantile semi-aristocracies, and to be wealth-producing machines in their earlier periods.  Ultimately this success does attract the avaricious attention from the autocratic power centers of the age, and so increases the need for military power to protect both the State and its commerce. 

At a more structural level, another dynamic is that, unlike autocracies, which seek to consolidate power at the center, republics must continually maintain a balance of internal power. This is particularly crucial as to economic equity, because with the leading commercial families inevitably having much power, there is a continuing clamor by the lower classes for a   share of that power.  If that balance is fundamentally lost, as happened with the Roman Republic once the gigantically wealthy effectively dispossessed the rural farmers, violence becomes unavoidable either to sustain or redress that imbalance, leading to rule by the military victor(s).

How this long-cycle evolution is handled has much to do with how republics fare. For example, the Republic of Venice lasted nearly 1200 years, from roughly A.D. 600 to 1800, and along with Genoa and the Swiss cantons, only ceased to exist due to their military defeat and absorption by Napoleon. In the case of Switzerland, within 20 years the  confederation was again functioning. In the case of Venice and Genoa, within 70 years both were part of the Italian constitutional monarchy. 

A lasting contribution will be made by the political scientist/historian who successfully undertakes an updated, modern “History of Republics,” thoroughly examining the evolutions of midieval and modern republics and comparing that with the ancient examples examined by Aristotle, Polybios, and Machiavelli. 

Saturday, April 18, 2020

Abbreviated coronavirus dashboard for April 18


 - by New Deal democrat


Here is the update through yesterday (April 17) 

There are some extended comments I want to make about the pandemic, and some graphs comparing States, etc., that are best done separately, so this will be an abbreviated update.
Here are yesterday’s numbers.

Number and rate of increase of Reported Infections (from Johns Hopkins via arcgis.com)
  • Number: up +35,354 to 706,779 (vs. 35,219 prior peak on April 10)
  • ***Rate of increase: day/day: 5% (vs. 5% for the past week, and 5% on April 15)

The number of new infections made a new peak yesterday. The increase in the past four days puts us back at the plateau from one week ago.
Number of deaths and infections and rate of increase of testing (from COVID Tracking Project)
  • ***Number of deaths: Total 32,365, increase of +2,069 day/day (vs. 2,492 daily high on April 15)

  • Rate: increase of 7% day/day vs. average of 9% in past week
  • Number of tests: 156,429, down -1,880 day/day (vs. 163,769 peak on April 9)
  • Ratio of positive tests to total: 5.0:1 (vs. 5.8:1 peak on March 28)


We still aren’t testing nearly enough.

New infections have been increasing at a rate of 5%/daily for a week now, and are back at their peak levels daily from a week ago.

In no way is the US ready to “open up” at all.

Weekly Indicators for April 13 - 17 at Seeking Alpha


 - by New Deal democrat

My Weekly Indicators post is up at Seeking Alpha.

The final dominoes among the coincident indicators fell this past week. In the “real economy,” the impact of the coronavirus pandemic is fully priced in.

In the stock market . . . I’m scratching my head.

As usual, clicking over and reading should not only be informative for you, but tosses me a penny or two for my efforts in bringing you all this content.

Friday, April 17, 2020

What the Index of Leading Indicators tells us about the 2020 Presidential election


 - by New Deal democrat

One of the better econometric models that I made use of back in 2016 was that by Prof. Robert S. Erickson of Columbia University and Prof. Christopher Wlezien of the University of Texas at Austria, entitled “Forecasting the Presidential Vote with leading economic indicators and the polls”

The model takes two steps. First, average the head-to-head heats by the two major candidates during the first quarter of the election year. Second, apply the result of the Index of Leading Indicators at the end of the first quarter to that average.  

Put simply: if Incumbent Candidate A leads (trails) Challenger Candidate B at the end of the first quarter of the election year, and the Index of Leading Indicators forecasts that the economy will continue to improve (decline), then Candidate A will win (lose). If Incumbent Candidate A leads (trails) Challenger Candidate B at the end of the first quarter of the election year, and the Index of Leading Indicators forecasts a reversal of the economic trend will reverse from improvement to decline (decline to improvement), then the race will tighten, and the outcome might reverse from that predicted by first quarter polling.

Applying this econometric approach to the 2020 election is very unfriendly to Donald Trump, to say the least. In all of the recent head-to-head match-ups with Joe Biden, Trump trails.

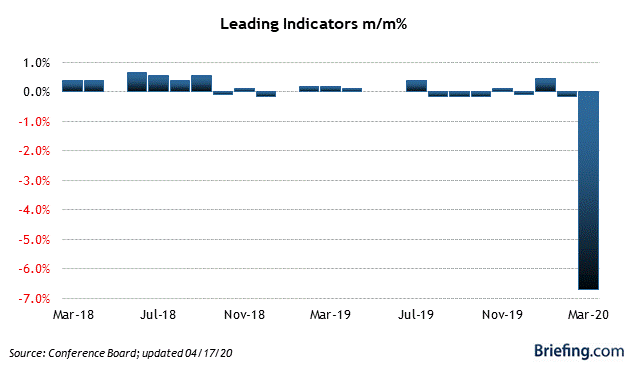
But worse is - well, here’s a look at the Index of Leading Indicators as it stands after March’s figure of -6.7% - the worst monthly decline ever recorded - was reported this morning:


Even before the March catastrophe, only 3 of the previous 10 months had been positive numbers. Essentially the index was treading water. As of now, it suggests that the next 4 to 8 months of the economy are going to be the worst since the Great Depression.

Voters are not going to blame Trump for the existence of the coronavirus, or the necessity for at least briefly shutting down the economy in order to halt the virus’s exponential growth. But they certainly can blame him for not acting fast enough, for his incoherence, and for his interference with States’ actions to ameliorate the situation. More succinctly, one or two months of awful news due to a natural catastrophe might be tolerated by voters. But if the awful news continues into the 3rd and maybe even 4th quarter — and the LEI suggests that it will do so for the next few months at least — voters are going to be extremely unforgiving.

At a feral level Trump knows this. That’s why he is left with a “Hail Mary” pass, hoping that if the economy is “opened up” in May the virus will miraculously abate, and that if it doesn’t, he can blame others.

Coronavirus dashboard for April 17: two opposing trends in States for the way forward


 - by New Deal democrat

Here is the update through yesterday (April 16). As usual, significant new items are in italics.

Seven Midwestern States just announced a new consortium for plans to gradually ease restrictions based on a “test, trace, and isolate” regimen. Massachusetts is hiring 1,000 tracers. Meanwhile at the other end of the spectrum, Trumpist governors in two States that never shut down announced that they want to “open up,” even though one of them just had its worst day yet. Meanwhile, tests of the USS Theodore Roosevelt crew added to the evidence that the true number of coronavirus infections is probably closer to the high end, perhaps 5x, of tested numbers.

In Washington, Trump announced a “three phase” plan to gradually open up the economy, which is said to be less stringent than CDC guidelines:

States must first meet a "gating" criterion that includes a "downward trajectory of documented cases within a 14-day period" or a "downward trajectory of positive tests as a percent of total tests within a 14-day period (flat or increasing volume of tests)," as well as hospital preparedness. 
Under the first phase of the three-phase plan, restaurants, movie theaters and large sporting venues would be appropriate to reopen under certain conditions, while schools, day care centers and bars would noto reopen.
The guidelines do not suggest any reopening dates.
Here are yesterday’s numbers.

Number and rate of increase of Reported Infections (from Johns Hopkins via arcgis.com)
  • Number: up +31,761 to 671,425 (vs. 35,219 peak on April 10)

  • ***Rate of increase: day/day: 5% (vs. 5% for the past week, and 5% on April 15)

The number of new infections has declined from a recorded peak last week. The increase in the past three days is concerning, but hopefully is just temporary noise.
Number of deaths and infections and rate of increase of testing (from COVID Tracking Project)
  • ***Number of deaths: Total 30,296, increase of +2,136 day/day (vs. 2,492 daily high on April 15)

  • Rate: increase of 8% day/day vs. average of 9% in past week
  • Number of tests: 158,309, down -2,826 day/day (vs. 163,769 peak on April 9)
  • Ratio of positive tests to total: 5.2:1 (vs. 5.8:1 peak on March 28)
  •  
US States and population in total lockdown, business lockdown, and partial restrictions - no changes in past 24 hours 
Below are the States that have not gone to lockdown orders:
  • Partial restrictions on business (bars, restaurants): 5 States (IA*, ND^, NE, UT*^, WY^) 9.7 million, 2.9%
  • School closure only: 2 States (AR^, SD*) 3.9 million, 1.2%
*some local areas under lockdowns
^restrictions on or quarantine of travelers from out of State
US States and population with “test, trace, and quarantine” programs
  • East Coast consortium: 7 States: CT, DE, MA, MD, NJ, NY, PA, RI (53.7 million)
  • West Coast consortium: 3 States: CA, OR, WA (31.3 million)
  • Midwest consortium: 7 States: IL, IN, KY, MI, MN, OH, WI (57.0 million)
  • Mid-Atlantic consortium*: 3 Jurisdictions: DC, MD, VA (15.2 million)
*informal cooperation
Total population covered by consortiums: 157.2 million)
Summary for April 16

Here’s how we stand (meaningful new developments in italics): 
  • About 95% of the total US population remains under total lockdown.
  • In States with no lockdowns, a meat-packing plant in South Dakota has emerged as the new national hotspot. Trumpist governors in Wyoming and North Dakota are speaking of easing restrictions further by May 1, even though the latter has just had its worst day for new infections yet.
  • The number of daily new infections appears to have plateaued in the past week, and is slightly lower. The trend in deaths is unclear. I am looking for a decline of roughly 15%/week in new infections if the peak has indeed been reached, so long as the lockdowns stay in place.
  • The number of daily tests has improved a little bit to about 160,000. We likely are continuing to miss a large percent of new infections. My personal suspicion is that the . Testing of the nearly 4,000 sailors on board the USS Theodore Roosevelt indicated that 60% of the 600+ infected were asymptomatic. This makes me think the actual number of total infections in the US is about 5x the official number, or roughly 3.5 million at present.
  • The Trump Administration has taken no steps - and realistically will never take steps -towards a nationwide “test, trace, and quarantine” plan that will be needed to lift lockdowns, or to assist States to do so, and is using a haphazard, secret, and likely corrupt method of distributing vital medical equipment. The “guidelines” it announced yesterday are not concrete, and are less stringent than the CDC’s.
  • In the absence of federal action, 20 States with almost half the US population  are either coordinating in making purchases of the necessary equipment, and/or to develop their own “test, trace, and quarantine” plan, but specifics in how to accomplish that have not emerged.
  • Some private companies are developing technologies or equipment to be used in a “test, trace, and quarantine” regimen. Abbott Labs has premiered a test which it says can be administered 1,000,000x/day. 

Thursday, April 16, 2020

Coronavirus dashboard for April 16: if new infections have passed peak, what pace of decline can we expect?


 - by New Deal democrat

Here is the update through yesterday (April 15). Significant new items are in italics

In the US, the only significant development yesterday was that deaths rose to yet another new daily high, while infections continued to be below last week’s peak.

Since I want to look ahead, now that lockdowns appear to have worked and the number of new daily infections appears to have peaked, what should the slope of declines look like? For that, I turned to three countries in Europe all of which have seen their peaks: Spain, Germany, and Italy. Here’s what each of them look like, in order:

Spain - in the 3 weeks since peak, cases have declined by about 50% total from 10,000 per day to 5,000 per day (or 17%/week):


Germany - in the 2 weeks since peak, cases have declined by about 60% total from 8,000 per day to 3,200 per day (or 30%/week):  


Italy - in the nearly 4 weeks since peak, cases have declined by about 55%, also from about 8,000 per day to 3,400 per day (or 14%/week) 

Of the three countries, Germany has been doing an excellent job of testing, tracing, and isolating, so I do not expect the US to follow that trajectory. On the other hand, in the 6 days since its apparent peak, on a three day rolling bases new cases in the US has declined about -19% from peak. So, conservatively we can hope for at least 15% declines weekly from peak, or about a 60% decline to roughly 13,000 cases per day by the first week of May. That will be my next forward-looking marker.

Now, let’s look at yesterday’s numbers.

Number and rate of increase of Reported Infections (from Johns Hopkins via arcgis.com)
  • Number: up +29,979 to 639,664 (vs. 35,219 peak on April 10)

  • ***Rate of increase: day/day: 5% (vs. 6% for the past week, and 5% on April 12)

The number of new infections has declined from a recorded peak last week. Hopefully the increase in the past two days is just temporary noise.
Number of deaths and infections and rate of increase of testing (from COVID Tracking Project)
  • ***Number of deaths: Total 28,160 increase of +2,492 day/day (new daily high)

  • Rate: increase of 10% day/day vs. average of 10% in past week
  • Number of tests: 161,135, up +14,521 day/day (vs. 163,769 peak on April 9)
  • Ratio of positive tests to total: 5.3:1 (vs. 5.8:1 peak on March 28)

US States and population in total lockdown, business lockdown, and partial restrictions - no changes in past 24 hours 
Below are the States that have not gone to lockdown orders:
  • Partial restrictions on business (bars, restaurants): 5 States (IA, ND^, NE, UT*^, WY^) 9.7 million, 2.9%
  • School closure only: 2 States (AR^, SD*) 3.9 million, 1.2%
*some local areas under lockdowns
^restrictions on or quarantine of travelers from out of State
US States with “test, trace, and quarantine” programs
  • East Coast consortium: 7 States: CT, DE, MA, MD, NJ, NY, PA, RI
  • West Coast consortium: 3 States: CA, OR, WA
  • Also under development: 1 State: UT
  • Midwest consortium*: 3 States: MI, MN, WI
*procurement of medical supplies only
Summary for April 15

Here’s how we stand (meaningful new developments in italics): 
  • About 95% of the total US population remains under total lockdown.
  • In States with no lockdowns, a meat-packing plant in South Dakota has emerged as the new national hotspot.
  • The number of daily new infections appears to have plateaued in the past week, and is slightly lower, while deaths made another new high. Per my introductory section above, I am looking for a decline of roughly 15%/week in new infections if the peak has indeed been reached, so long as the lockdowns stay in place.
  • The number of daily tests has improved a little bit from about 140-150,000. We likely are continuing to miss a large percent of new infections. My personal suspicion is that the actual number of total infections in the US is between 2-5x the official number.
  • The Trump Administration has taken no steps - and realistically will never take steps -towards a nationwide “test, trace, and quarantine” plan that will be needed to lift lockdowns, or to assist States to do so, and is using a haphazard, secret, and likely corrupt method of distributing vital medical equipment.
  • In the absence of federal action, 14 States are either coordinating in making purchases of the necessary equipment, and/or to develop their own “test, trace, and quarantine” plan, but specifics in how to accomplish that have not emerged.
  • Some private companies are developing technologies or equipment to be used in a “test, trace, and quarantine” regimen. Abbott Labs has premiered a test which it says can be administered 1,000,000x/day. 

March housing, latest weekly jobless claims slightly less apocalyptic than expected


 - by New Deal democrat

If I were President, the one industry in the economy that I would be actively trying to prop up is housing. As I have repeated constantly over the past 10+ years, housing is a long leading indicator. The permit that is issued today means a house that is built over the next 4 to 12 months, means contractors being employed, mortgages being issued, and furnishings, appliances, and landscaping continuing to be bought for a year or two afterward.

In other words, if I could keep the housing industry going through the coronavirus pandemic, it would lay a solid basis for the return of the consumer thereafter. The bad news is, needless to say, that there is no such organized effort, whether by government or business itself. The less bad news is that permits and starts did not completely fall apart in March, but of course only the second half of March was really impacted by the coronavirus shutdowns.

Let’s take a look.  

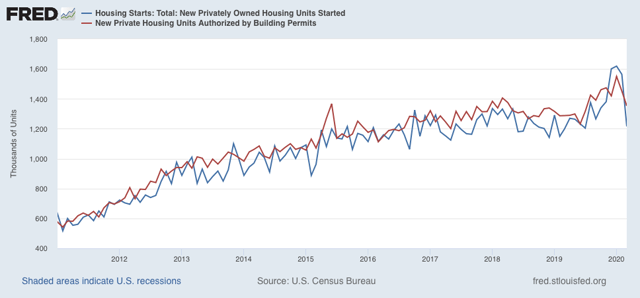
Actual housing starts declined 348,000 on an annualized basis to 1.216 million (blue), while permits (red) declined less: -99,000 to 1.353 million:


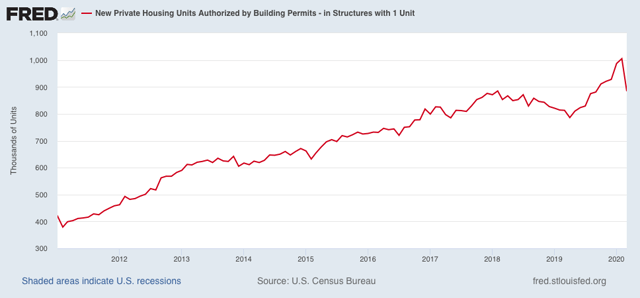
The less volatile single family permits declined -121,000 to 884,000 annualized:


The March declines above only took us back to the levels of last summer, so so far, so not so awful. 

If I were a developer, I would be finding a way to keep my model homes open, with hand sanitizer generously available, a rule of one household at a time in the sales office and model, a sanitizing agent to accompany prospective buyers and clean up after each tour, and an advertising campaign touting those things and advocating people get out of the house to tour my open models, noting record low mortgage rates as well. Maybe some enterprising developer will blaze the trail.

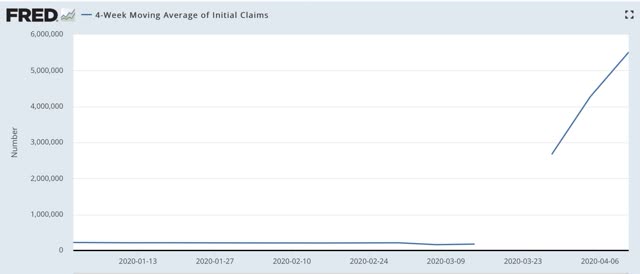
In the meantime, initial jobless claims declined to a less awful 5.245 million last week, bringing the total for the past 4 weeks to over 22 million! And that doesn’t include all the people who apparently have been able to get through to file in some States. Here’s the 4 week moving average:


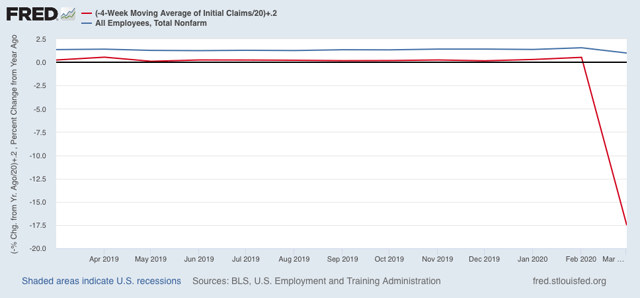
With one more week to plug into my model, it continues to look like 20 to 25 million jobs will be recorded as lost when the April jobs report comes out: