Wednesday, May 11, 2016

JOLTS encouraging, Labor Market Conditions Index less bad


 - by New Deal democrat

/this week we have two follow-up reports on the labor market: the Labor Market Conditions Index, and the JOLTS report.

Let's start with the LMCI.  As I have previously noted, the LMCI shows promise as a long leading indicator, as 40 years worth of data shows it turning negative usually a year or more before the onset of a recession:


This month's report was the 4th such negative report in a row, but the good news is that it was "less bad:"


This is another small addition to the evidence that 2017 might be a poor year.  It also suggests that monthly job gains, that have already decelerated from a 225,000 rate, will continue to do so.  In other words, export more reports of 1xx,000 to come.  But at the same time it is nowhere near as negative as it has been in the past at the onset of recessions.

Now let's turn to the JOLTS report.  While it is an extremely useful dissection of the labor market,  it has only existed for 15 years, and thus includes only one full expansion. 

For most of 2015 I was unimpressed with the report.  True, job openings (blue in the graph below) were soaring to new heights, but actual hires (red) stalled -- the same pattern as in 2005-06. late in the last cycle.  Three months ago openings decreased significantly - something which happened just before the 2007 recession started. Fortunately, that only lasted one month.  For the last 2 months improving openings and hires have been the case.  Here is the complete series:


The pattern from the last expansion was: first, hires peak.  Then, openings peak.

Here is a YoY look at the same data:


Openings had been rising faster than hires, which are have been barely positive.  Until two months ago, when hires soared to a new all-time high, as shown in the first graph above at far right.  Since then, the upward trend in hires has remained.

Some more good news was contained in the quits rate, which also continued in an uptrend, if not quite at their record of three months ago (red in the graph below):


This means that workers were confident enough in their prospects to voluntarily leave their jo bs.  Note that layoffs (blue) remained low.  Needless to say, the increase in voluntary quits is a significant positive.

Further, two months ago  Dean Baker made a point that there is "pent up damend" for quits, and therefore they should continue to all time record highs. Here's a link to a graph of the U6 underemployment rate (inverted) vs. Quits:


For every level of underemployment over the last 3 years or so, there have been more Quits than occurred during the last cycle -- supporting the  hypothesis of "pent up demand."

Taken together,  the LMCI continues to suggest a maturing but not expiring expansion, and this month's positive JOLTS report suggests that job growth has a ways to go.

Bonddad Tuesday Linkfest: Yen Isn't Helping BOJ and Other Points of Interest


Yen's Appreciation Is Bad News For BOJ


The top chart is the yen/Australian dollar.  The chart increased ~21% in the last year.   The middle chart is the yen/yuan, which increased ~18 last year.  the bottom chart is the yen/dollar, which is up 12.5% over the last year.


Charles Evans, president of the Chicago Fed, also said he would welcome a temporary overshoot in inflation to lift consumer price growth up to the Fed's longer-term target of 2 percent and raise overall inflation expectations from current low levels.

"While the fundamentals for U.S. growth continue to be good, uncertainty and risks remain. In my opinion, the continuation of 'wait and see' monetary policy response is appropriate to ensure that economic growth continues," he told a conference in London.


Intact Financial Corp. may post insured losses of as much as C$1.1 billion ($850 million) from the wildfires in Alberta, which could dent the Canadian economy harder than Hurricane Katrina hit the U.S.

Intact, Canada’s biggest property and casualty insurer, said the damage claims will lead to net losses of C$130 million to C$160 million, or as much as C$1.20 a share, according to a company statement Monday. Jaeme Gloyn, an analyst with National Bank of Canada Financial, estimated the C$1.1 billion figure based on the company’s per-share data. The Toronto-based insurer had net income of C$147 million in the first quarter.

“The devastation brought on by the wildfires is unprecedented,” Intact Chief Executive Officer Charles Brindamour said in the statement. “The scope of the damage and destruction that we have observed in recent days is a reminder of the important role we play in getting our customers back on track.”


Tuesday, May 10, 2016

Dollar Chart Is Bearish


The daily dollar chart is bearish.  

1.) The 50 and 200-day EMAs are moving lower.  
2.) The 50 day EMA is below the 200-day EMA.  The shorter EMA will pull the longer EMA lower.
3.) Prices sold off 6 times since December 2015.
4.) Prices have been in a "lower low, lower high" pattern since December 2015.

The weekly chart is also bearish:


Prices are right at long-term technical support around the 93 level.  There is plenty of technical real estate between 93 and the previous ~85.

     There is no current reason to think the dollar will meaningfully rally.  Instead, expect technical counter-rallies.  And Friday's employment report placed the Fed on the sidelines for at least the next meeting.


Bonddad Tuesday Linkfest; Trump's Really Stupid U.S. Debt Idea

Several days ago, Trump floated the idea that the U.S. should ask it's creditors to take a haircut on their respective U.S. debt holdings.  Below is a smattering of commentary on the idea.  I would add this point: a central idea in international finance is the idea that U.S. debt is riskless.  Analysts use U.S. interest rates as the risk-free rate of return.  Trump's idea would eliminate that assumption, which would throw a monkey wrench into international finance as we know it.

This is, quite literally, one of the dumbest ideas I've ever seen floated.  Period.


Truly, Donald Trump knows nothing. He is more ignorant about policy than you can possibly imagine...

Last week the presumptive Republican presidential nominee ... finally revealed his plan to make America great again. Basically, it involves running the country like a failing casino: he could, he asserted, “make a deal” with creditors that would reduce the debt burden if his outlandish promises of economic growth don’t work out.

The reaction from everyone who knows anything about finance or economics was a mix of amazed horror and horrified amazement. ...

So why is Mr. Trump even talking about this subject? Well, one possible answer is that lots of supposedly serious people have been hyping the alleged threat posed by federal debt for years. ...


His “very good brain” doesn’t seem to be firing on all cylinders here. Let’s unpack these comments because they’re both extremely wrong.  First, if interest rates rise by 2, 3, 4 points then what happens? Wait, no, I am being stupid now. Sorry. The right question is, WHY would interest rates rise by 2, 3 or 4%?  The only plausible case for rates rising that much is if the US economy is booming and the Fed is raising rates in an effort to slow the boom. So, Trump is constructing a totally false scenario in the first place. If rates are rising then America is great again and we certainly still have a country.

Perhaps he thinks we’re Greece where interest rates rose due to solvency fears. I don’t know if that’s what he’s inferring, but if he is then he doesn’t understand the solvency dynamics of the US government within the scope of the global financial system. I’ve explained that concept in excruciating detail many times over the years. See, Why the USA isn’t Going Bankrupt & Concerns About the National Debt.  And if he thinks today’s environment looks anything like the 1970’s then he’s still way off the mark as today’s environment resembles the 70’s in almost no way.  See, 3 Reasons Today’s Environment is not like the 1970’s.

But let’s go with this notion even though its causation is misleading. If interest rates rose by 4% what would the economic burden be?  Well, the average maturity on US government debt is roughly 5 years.¹ 5 year notes pay about 1.3% today, which is about what the US government pays on average for its debt. If rates rose by 4% then it’s likely that 5 year notes would offer a slight premium. Let’s just say 5% for fun. What happens to the budget deficit?  Interest payments would jump to about $950B per year which would bring the deficit to about 1.4T or 7.7% of GDP using today’s figures.²  That sounds unpleasant, but it’s not even close to the 10% deficit we experienced during the financial crisis and nowhere near the 30% figure we saw during WW2. We still have a country after these experiences if I have my history right.


This policy would be so disastrous that even its suggestion is dangerous. In the event of a recession, Trump would treat the full faith and credit of the United States to a capricious hair cut. As Josh Barro explained, this wouldn’t just represent a historic default, putting the U.S. in the position of a country like Greece or Argentina; it could also spark an international financial crisis, as “investors would cease to see Treasuries as a safe asset and demand higher interest rates in exchange for risk.”


US Treasury bonds have very low interest rates because investors are extremely confident they will be paid in full, even in poor economic conditions. Trump — by openly saying that he would keep partial payment on the table as an option — could spark a crisis in the Treasury markets if he became president. Investors would cease to see Treasurys as a safe asset, and they would demand higher interest rates in exchange for risk.

This, of course, is a terrible idea, and a good reason for Republicans to hesitate in coalescing around Trump. Do they really want manufactured economic crises to be part of the Republican brand?

Well, judging by their behavior during the 2013 debt-ceiling crisis, some of them do. This particular desperate measure floated by Trump is novel, but he is not the first Republican to advance the idea that usual concerns about prudence and risk can be thrown out the window because the country is already a smoldering garbage fire.

It has been common for years for some Republicans to talk about America's debts as unpayable. Starting from that incorrect premise, Trump is only adding the insight that if you're going to default anyway, you might as well borrow what you can while you still have access to the credit markets.http://www.businessinsider.com/donald-trump-treasury-haircut-idea-insane-2016-5


Monday, May 9, 2016

Oil's Weekly Technical Picture Is Improving


Above is a weekly chart of West Texas Intermediate Crude.  The following are important technical developments:

1.) Prices moved above the 10, 20 and 50 day EMA.  These averages will now provide technical support rather than resistance.
2.) While momentum is still negative, it is rising and about to cross over the very important "0" level. 3.) Volume is high.  Volume spiked when prices fell into the mid-20s.  This could represent a selling climax.  Additionally, volume continues to increase as prices climb.
4.) Prices moved through the downward sloping trend line that that connects the mid-2015 and 4Q15 price highs.
5.) Prices remain in an uptrend.


Bonddad Monday Linkfest


The news provides more evidence that the US macro trend is off to a sluggish start in the second quarter, but it’s premature to assume the worst via today’s data. The labor market’s expansion has been decelerating this year, but for the moment the downshift doesn’t exceed the low points of the last several years. In short, we’ve been here before and without sinking into a new recession. Will it be different this time? No one knows, but the worst you can say at the moment is that we’re knee-deep in another soft patch that may or may not lead to a new downturn.

On the plus side, private payrolls are still growing at a healthy annual rate, rising by nearly 2.2% in April vs. the year-earlier level. That’s a robust trend… if it holds. The problem is that the annual pace has been edging lower for much of the past year. But let’s recognize that the slowdown is unfolding in slow motion, which implies that a sharp slide is nowhere on the horizon. In other words, the bigger concern at the moment is less about the economy slipping into a new NBER-defined recession vs. weak growth that becomes even weaker over an extended period of time. That may turn out to be an irrelevant distinction, depending on your personal finances and career path. In any case, the game of looking for a clear and distinct start to a new recession may fade into the mists of a post-2008 realm of warm and fuzzy macro trends subsumed by slow growth and unsatisfying job opportunities.


The jobs number is naturally volatile from month to month. So it's best to look at the change over several months or even a year. On a year over year basis, private sector jobs rose 2.2%; over the past six months, they are up at a 2.1% rate, which is about what they have averaged since mid-2011. Nothing much has changed.

What has changed is the growth of the labor force, which has picked up of late. That explains why the unemployment rate has stopped declining: on the margin, more people are deciding they want to work. This is a positive development.


Although the headline number for job creation was below expectations, this was still a decent report. Some positives include more wage growth (see below), fewer part-time workers for economic reasons, fewer long-term unemployed, and a decline in U-6 (an alternative measure of underemployment).


However, though this slower pace could represent a downshift in the rate of job creation, it is far too soon to jump to that conclusion. These monthly numbers are jumpy and require averaging a few months’ gains to get at the underlying trend. In fact, the monthly trend over the past three months is precisely 200,000, as shown in my monthly smoother below. So, even while one can point to other slowing indicators, especially the 0.5% GDP growth in the first quarter of the year, do not assume the job market is softening.

The rest of the report provides indicators that bounce both ways. On the soft side, the slipping of the labor force participation rate was a real disappointment and a reversal of a recent upward trend in this closely watched metric of movements in and out of the labor force (see figure). After rising from a low of 62.4% last September to 63% in April, the LFPR ticked back down in May to 62.8%. That’s still significantly off its lows, and again, the monthly numbers are jumpy, but this was the number I liked least in today’s report, especially since the same 0.2 percentage point decline was seen among prime-age workers, meaning the drop can’t be pinned on aging retirees.

On the other hand, both average hourly wages and weekly earnings continue to beat (very low) inflation (weekly hours ticked up slightly last month), with both earnings measures up 2.5% over the past year, while inflation’s running around 1%. Importantly, from the Fed’s perspective, even while the job market is tightening, the extent of wage acceleration remains mild. Essentially, average wages from the establishment survey have climbed from around 2% growth in the first half of last year to around 2.5% this year. That’s what we’d expect in an improving job market and a pace that remains below the 3-3.5% Fed chair Yellen has suggested is “equilibrium” wage growth.


Saturday, May 7, 2016

Weekly Indicators for May 2 - 6 at XE.com


 - by New Deal democrat

My Weekly Indicators post is up at XE.com. There was little change this week, although an important negative is coming up on a one year anniversary of a negative pivot, and may be reversing course.

Friday, May 6, 2016

April jobs report: good on wages, but ongoing signs of late cycle deceleration


- by New Deal democrat

HEADLINES:
  • +160,000 jobs added
  • U3 unemployment rate unchanged at 5.0%
  • U6 underemployment rate down -0.1% from 9.8% to 9.7%
With the expansion firmly established, the focus has shifted to wages and the chronic heightened unemployment.  Here's the headlines on those:

Wages and participation rates
  • Not in Labor Force, but Want a Job Now:  up +81,000 from 5.712 million to 5.793 million
  • Part time for economic reasons: down -61,000 from 6.123 million to 5.962 million
  • Employment/population ratio ages 25-54: down -0.3% from 78.0% to 77.7% 
  • Average Weekly Earnings for Production and Nonsupervisory Personnel: up +$.05 from $21.40 to $21.45,  up +2.5%YoY. (Note: you may be reading different information about wages elsewhere. They are citing average wages for all private workers. I use wages for nonsupervisory personnel, to come closer to the situation for ordinary workers.)
February was revised downward by -12,000.  March was also revised downward by -7,000, for a net change of -19,000. 

The more leading numbers in the report tell us about where the economy is likely to be a few months from now. These were neutral to mixed.
  • the average manufacturing workweek was unchanged at 41.7 hours to 41.- hours.  This is one of the 10 components of the LEI.
  •  
  • construction jobs increased.by +1,000.  YoY construction jobs are up +261,000.  
  •  
  • manufacturing jobs increased by +4,000, and are now *down* -19,000 YoY
  • temporary jobs - a leading indicator for jobs overall increased by +9,300 (but is still down from December's high).

  • the number of people unemployed for 5 weeks or less - a better leading indicator than initial jobless claims - increased by 133,000 from 2,412,000 to 2.545,000.  The post-recession low was set 8 months ago at 2,095,000.

Other important coincident indicators help us paint a more complete picture of the present:
  • Overtime was unchanged at 3.3 hours.
  • Professional and business employment (generally higher-paying jobs) increased by +65,000 and are up +511,000 YoY.

  • the index of aggregate hours worked in the economy rose by 0.4 from  105.1 to 105.5. 
  •  the index of aggregate payrolls rose by 1.0 from 127.7 to 128.7.
Other news included:      
  • the alternate jobs number contained in the more volatile household survey decreased by -316,000 jobs.  This represents an increase  of 2,495,000  jobs YoY vs. 2,692,000 in the establishment survey.   
  •  
  • Government jobs fell by -11,000.   
  • the overall employment  to  population ratio for all ages 16 and above fell  by  -0.2  from  59.9   to 59.7  m/m but is up +0.4% YoY.  
  • The  labor force participation rate fell  -0.2%  from 63.0%  to  62.8%  and is now up +.0.1% YoY (remember, this incl udes droves of retiring Boomers).  
 SUMMARY

This looks like a classic late-cycle expansion report to me.  The more coincident measures, like aggregate hours and wages, improved significantly, and were the best parts of the report, which is good for labor.  Many of the leading indicators in the report, however, declined, including revisions to prior months, the short term unemployed, the YoY change in employment, and the failure of temporary jobs to make a new high (although they were positive this month).

While the U6 underemployment rate declined slightly, progress in involuntary part time employment and those out of the work force who want a job now has stalled.  The decline in the employment population ratio and the labor force participation rate will probably get lots of notice, but all these really did is take back some of the strong numbers in the last few reports, so I am less concerned about those -- although from a long-term point of view, it remains a big negative that so far into this expansion these participation numbers remain so depressed compared with 10 years ago.

So -- some definite bright spots, no cause for imminent concern, but showing ongoing signs of late cycle deceleration

From Bonddad:

The primary reason for the drop was a decline in retail and construction employment.  Retail lost 3,000 employees while construction only added 1,000 jobs.  In the previous report, these numbers were 39,000 and 41,000, respectively.

This highlights the potential topping out of retail sales and new home construction for this cycle.  The following chart clarifies:


The above chart shows retail sales and new home starts for the last year, both converted to a scale of 100.  Retail sales (the red line) have moved sideways since July 2015.  New housing starts (the blue line) moved sideways for the last year.

The latest GDP report confirmed the retail slowdown but not the housing numbers.  PCEs are slowing; they increased 3.6% in 2Q15 but only 1.9% in the latest report.  However, residential investment increased a very strong 14.8%.  Here's a table of the data:


Bonddad Friday Linkfest


Almost $10tn of negative yielding government bonds are costing investors about $24bn annually, according to calculations by Fitch, posing challenges to long-term investors that rely on sovereign debt as a bedrock of their portfolios.

The rating agency warned that the previously unthinkable scenario of negative-yield bonds is having a “broad impact” on investors such as insurers, banks, pension funds and money market funds. Analysts say insurance companies and pension schemes in particular are struggling to get the returns they need to plug widening deficits.

Citigroup this year estimated that UK and US companies have pension deficits of $520bn, and put the developed world’s public sector pension underfunding at $78tn. Those deficits have been aggravated by the drooping yields of bonds, the traditional mainstay of their investment holdings.


Why Has the Labor Force Participation Rate Increased? (Macroblog)


During the last year, the negative effect on participation attributable to an aging population (0.22 percentage points) has been offset by a 0.23 percentage point decline in the share of people who want a job but are not counted as unemployed (including people who are marginally attached). This decline is an encouraging sign, and consistent with a tightening labor market.


The Dividend Aristocrats Index is comprised of 50 stocks that have paid dividends for 25+ consecutive years.

In addition to requiring 25+ years of consecutive dividend increases, Dividend Aristocrats must also:

Be members of the S&P 500 Index
Meet certain size and liquidity requirements.
What's the big deal about being a Dividend Aristocrat?

The Dividend Aristocrats Index has outperformed the market by a wide margin over the last decade.


Thursday, May 5, 2016

Four measures of real wage improvements: good news and bad news

 - by New Deal democrat

In the last several years, I have written a number of posts documenting the stagnation in average and median wages, for example here and here.  Several of the series were just updated for the first quarter, so now is a good time to take another look.

We have a variety of economic data series to track both average and median wages:
  • The most  commonly known measure is that of average hourly pay for nonsupervisory workers, which is part of the monthly jobs report.
  • The Bureau of Labor Statistics, which conducts the household employment survey, also reports "usual weekly earnings" for full time workers each quarter. 
  • The BLS also measures the Employment Cost Index quarterly.  
  • The BLS also measures "business sector real compensation per hour" quarterly. 
So I have good news and bad (or at least, not quite so good) news.

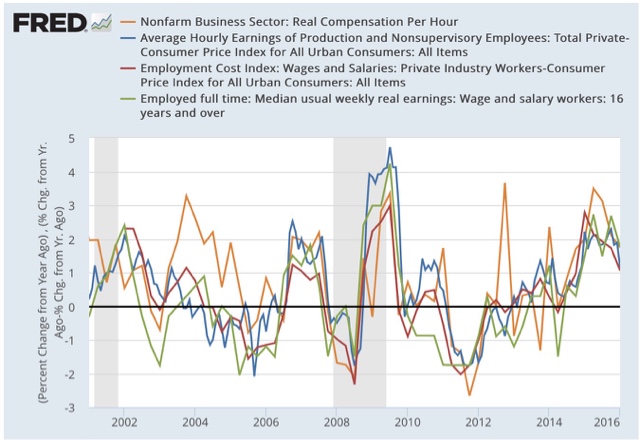
First, the good news:  the below graph tracks monthly average (mean, not median) hourly wages (blue), median wages from the employment cost index (red), real compensation per hour (brown), and median usual weekly earnings (green). All are adjusted for inflation.  Since the quarterly index of median wages only started in Q1 2001, I have normed the indexes to 100 at that time:


And here is a longer term view.  The ECI only started in 2001, but the other 3 go back in time at least into the 1960s:


With the exception of average hourly earnings (blue line), the other three are at all time record highs.  I don't want to oversell this, because it has been a very slow process, but it is still certainly positive and worth two cheers anyway.

Now, the bad news.  Here is the same information YoY:


All 4 series made YoY% highs for this expansion in the first half of 2015, and have showed decelerating growth since then.  This shows us how dependent real wage growth has been on the price of gas really ever since the start of the Millennium.  Gas prices have probably bottomed, and YoY wage growth has probably peaked for this cycle.  And with just under 10% underemployment, we have yet to reach full labor utilization.

Bonddad Thursday Linkfest


I think there are 5 reasons: slower growth of capital per worker, slower TFP, capital misallocation, the absence of full employment, and dysfunctional government (labor quality has been pretty constant, so it isn’t much implicated in the slowdown).


Employment growth at US companies slowed in April to the weakest gain in three years, according to this morning’s update from ADP. The private sector added only 156,000 positions to payrolls last month in seasonally adjusted terms—well below expectations for a gain of nearly 200,000. Today’s data raises new questions about expectations for a second-quarter rebound in economic activity following the weak Q1 GDP report. The numbers du jour also revive the focus on a question I asked last week: Will Job Growth Kill The Bear-Market Signal For Stocks?


Markets continue to recover from the growth scare that set in beginning around the end of last year. Oil prices were plunging, creditors feared a wave of defaults, commodity prices were plunging, China was thought to be on the verge of a huge slowdown, and central banks appeared powerless to avoid another recession. What a difference a few months make. "Avoiding a recession is all it takes" has been a recurring theme of this blog for more than three years, and it's still relevant. Here are some more charts which suggest that instead of tipping over into a recession, the economy is more likely picking up a bit. Growth is still slow, but slow growth is a lot better than a recession, especially when cash yields almost nothing.


Wednesday, May 4, 2016

The Dollar is Right At Important Technical Support


The above 5-year chart of the dollar shows its value is right at key technical support levels.  

Expect continue manufacturing improvement if prices continue in this direction.


Decent news on houses and cars


 - by New Deal democrat

The two most leading parts of the consumer economy are houses and cars.  Both were going strong last year before wobbling in the last few months.  In the last week, however, we've received some positive news on both.

First, the existing negative stats about housing: new home sales, which peaked over a year ago, and permits, which peaked last June:


The good news we got last week was that real private residential investment rose as a share of GDP to a new post recession high (blue in the graph below).  This typically peaks over a year before the next recession. Single family permits (red) also remain positive:


Yesterday April motor vehicle sales returned to 17 million plus annualized (h/t Bill McBride):


Car sales tend to plateau during expansions and decline at least 6 months before a recession. Had car sales had another month under 17 million, that would have been a bad sign.  April returned us to the plateau range, so March might have been just a one-off exception.

I don't want to oversell either of these data points.  But they are positives that are consistent with the economy continuing to grow into next year.

From Bonddad:

I'd like to add the following point:

If there is any reason to be hopeful about the future, it's the continued strong housing numbers contained in GDP reports.  Economist Ed Leamer famously noted that housing is the business cycle.  Frankly, he's pretty much spot on with that statement.  A new home requires labor, raw materials, a large outlay for durable goods, and financing.  That means there are strong ripple effects from the new homes market.

Something to think about: despite low inventory, housing companies continue to build at a good but not exceptional pace, which is contributing to higher new home prices.  I had an email exchange with an analyst about this and asked if the homebuilding companies were deliberately keeping inventory low to get higher prices.  While he didn't have any proof, he did suspect that to be the case.  This is a hunch on my part; I have no proof.  It makes sense, especially when you consider the shellacking the home builders took as a result of the Great Recession.


Bonddad Wednesday Linkfest

I was at a conference in New York City on Monday and Tuesday; so I was unable to post.


The global economy is continuing to grow, though at a slightly lower pace than earlier expected, with forecasts having been revised down a little further recently. While several advanced economies have recorded improved conditions over the past year, conditions have become more difficult for a number of emerging market economies. China's growth rate moderated further in the first part of the year, though recent actions by Chinese policymakers are supporting the near-term outlook.

Commodity prices have firmed noticeably from recent lows, but this follows very substantial declines over the past couple of years. Australia's terms of trade remain much lower than they had been in recent years.

Sentiment in financial markets has improved, after a period of heightened volatility early in the year. However, uncertainty about the global economic outlook and policy settings among the major jurisdictions continues. Funding costs for high-quality borrowers remain very low and, globally, monetary policy remains remarkably accommodative.

In Australia, the available information suggests that the economy is continuing to rebalance following the mining investment boom. GDP growth picked up over 2015, particularly in the second half of the year, and the labour market improved. Indications are that growth is continuing in 2016, though probably at a more moderate pace. Labour market indicators have been more mixed of late.

Inflation has been quite low for some time and recent data were unexpectedly low. While the quarterly data contain some temporary factors, these results, together with ongoing very subdued growth in labour costs and very low cost pressures elsewhere in the world, point to a lower outlook for inflation than previously forecast.

Monetary policy has been accommodative for quite some time. Low interest rates have been supporting demand and the lower exchange rate overall has helped the traded sector. Credit growth to households continues at a moderate pace, while that to businesses has picked up over the past year or so. These factors are all assisting the economy to make the necessary economic adjustments, though an appreciating exchange rate could complicate this.


Monday, May 2, 2016

April ISM manufacturing new orders strong, inventory liquidation continues


 - by New Deal democrat

I have been tracking and averaging the new orders components of the regional Fed indexes to see if they anticipate the dirrection of the monthly ISM new orders, which in turn is a leading indicator for business sales and industrial production.

This morning' April ISM manufacturing report - the second strong monthly report in a row - is potent evidence of a coming change in trend for manufacturing and industry. (up at XE.com)

Sunday, May 1, 2016

US Equity, US Bond Market and International Week in Review

My weeking columns are up at XE.com

US Equity Week in Review

US Bond Market Week in Review

International Week in Review

Another thought for Sunday: coming soon to North Carolina sports arenas

If it's important enough for voting, it is certainly important enough to protect privacy:


A thought for Sunday: gerrymanders are like levees


 - by New Deal democrat

A gerrymander acts like a levee.  A river in flood stage can be contained within a channel, so long as the water level is less than the height of the levee.  Similarly, by packing democrats into relatively few districts, and spreading the remaining, smaller GOP majorities over many, the GOP was able to withstand a 52%-48% numerical voting loss for Congressional seats in 2012 and retain a comfortable majority.

But if the water level from a river in flood exceeds - even slightly - the height of the levee, this is what happens:


Similarly, by taking what would otherwise be 60/40 or 65/35 GOP districts and turning them into a greater number of, say, 55/45 districts, then, should the democratic vote this November be 55.1%, you get the electoral version of the above picture.

Saturday, April 30, 2016

Weekly Indicators for April 25 - 29 at XE.com


 - by New Deal democrat

My Weekly Indicators piece is up at XE.com.

There are continuing signs of a bottoming of the industrial recession.  But I am concerned about poor consumer spending.  I am increasingly coming to the conclusion that consumers' gas savings have been vacuumed up by increasing rents and house prices.