Wednesday, October 13, 2010

A closer look at employment: State and Local Government

- by New Deal democrat

Yesterday we looked at construction employment, and saw grounds for a little optimism, in that the 5 year relentless decline looks like it may finally bottom out by next spring. The other sector that is hemorrhaging jobs is that of state and local government. Here the news is decidedly less positive.

The BLS divides both state and local government employment into education and non-education. Let's look at those in turn.

Turning first to state government, while states have protected their education establishment:

and indeed the YoY figures for state education employment show expansionary growth:

The story is decidedly not the same when it comes to non-educational employment:

As the YoY graph shows, the rate of layoffs in the last year has been increasing, not decreasing:


Turning to local government, the situation is even worse. Here is educational employment. Notice the cliff-dive last month:

On a YoY basis, last month gave us the worst annual rate of decline yet:

The same depressing story is told by non-education employment:

And again, the YoY rate of job losses has increased rather than decreased:


Because state and local government employment levels respond to tax receipts - which in the case of income and property taxes, are based on last year's income/value - they tend to lag other employment trends by about a year. That is why in the last several recessions, they were among the last sectors to turn down, and the last to turn up after the recession had ended.

For example, here is the graph of gains and losses in government employment on a monthly basis during the 1970s:


and here is the chart of the same data, showing that even after the economy began to recover from the deep recessions of 1973-74 and 1981-82, employees in government continued to be laid off:


Here is the same graph as to the 2001-03 recession and "jobless recovery":

and here is the chart of the same data, showing again that government employees continued to be laid off even into 2004, even after employment as a whole turned up in late 2003:


Additionally, the summer months of June through September, when budgets are being prepared, have in the past been associated with the worst layoffs. So it is possible that last month will be the worst single month of this decline. Nevertheless, this means that we should expect state and local layoffs to continue albeit not at the level of last month, and not necessarily every month, probably at least until next summer.

Bottom line: there is no prospect of state and local government job losses hitting bottom in the near future.

Yesterday's Market


Prices gapped lower at the open (a), dropped (b) and then rebounded (c) to a trading range just shy of the previous days close. Prices traded in a range (d) until the release of the Fed's minutes, when prices rallied (e), then consolidated in a triangle pattern (f) followed by a final rally (g).


Aside from round numbers and level (a), prices have little upside resistance at this point.


Treasury prices held near support for the first part of trading, but then moved through support (a) and fell for the rest of the day. Along the way prices had two counter-trend rallies that ended near EMAs (b and c).


Commodity prices opened lower (a), but formed a double bottom (b) and rallied to an a trading range just above the previous days close. Prices consolidated in a triangle bounded by (c) and (d), before moving slightly higher, using level (d) as trading support.


The dollar gapped higher at the open (b) but ran into resistance at previous levels (c). Prices fell to previous support (point (d) on line (a)), rallied to a Fibonacci level and then sold off on the Fed minutes.


The dollar is in a clear downtrend at this point. However, if it was going to have a counter-trend rally look for the 10 day EMA (A) to provide initial resistance.

Tuesday, October 12, 2010

Corn Prices Surge

From the Financial Times:

The US Department of Agriculture on Friday cut its outlook for corn yields in the US, the world’s main exporter of the grain, by the most in decades in a “historic report”, according to Rich Feltes of brokers RJ O’Brien in Chicago. The government said the ratio of leftover stocks to demand will fall to a 15-year low in coming months.

.....

Corn ended 5.2 per cent higher, bringing its two-day gain to 11.5 per cent. Such has been the sharpness of the move that policymakers are contemplating a repeat of the global food crisis of 2007-2008. Analysts have also started discussing the level at which prices could begin to shave consumption to bring it in line with supply.

“The market is going to try to ration demand wherever possible,” said Lewis Hagedorn, agricultural commodities analyst at JPMorgan.

Corn rises, along with similar gains in other commodities, suggested a battle for land among crops as farmers make planting plans. Chicago wheat futures initially gained 2.8 per cent on Monday before declining, while soyabeans rose 1.5 per cent and New York cotton futures hit a 15-year high. “These other crops need to compete with corn for acreage,” Mr Feltes said.


For more basic information on the crop, go here.

A few points, in no order of importance:

-- There was a story on the local news last night about this increasing meat prices because corn is a staple of cattle feed.

-- Corn is a staple of the Mexican diet (corn tortillas) -- a country which is already experiencing tremendous internal turmoil.

-- At some point this will start to have an impact on ethanol based fuel supply. I don't know what those levels are, but they could lead to raising fuel prices in the winter when fuel prices typically fall, adding further pressures to consumer spending during the holiday shopping season.

-- The lower dollar is probably adding to the market turmoil, as corn is priced in dollars.

What Exactly is Currency Manipulation?

From Bloomberg:

Exchange rates dominated the IMF’s annual meeting as Treasury Secretary Timothy F. Geithner, People’s Bank of China Governor Zhou Xiaochuan and their counterparts split over whose policies are the biggest threat to the world economy on concern countries are relying on cheap currencies to aid growth. China was accused of undervaluing the yuan, while low U.S. interest rates were blamed by emerging markets for flooding them with capital. Brazil took aim at both the U.S. and China.

Today we have news that Thailand is increasing taxes to halt "hot" inflows:

Thailand is introducing a 15 per cent withholding tax on interest payments and capital gains on bonds held by foreign investors to curb capital inflows which are driving up the value of its currency.

.....

The move comes amid an increasingly bitter international debate over currency policy. Other countries, most notably Brazil, South Korea and Indonesia, have taken lesser measures to control inflows. But Thailand’s move sends a clear signal that the country’s monetary authorities are willing to take unpopular and controversial measures to curb so-called “hot money” inflows.


First, here is the basic skinny on currency trading; for more advanced ideas, start with Kathy Lien's blog and books and go from there.

Traders who want to buy a currency are looking for the following:

1.) A growing GDP because this indicates outside money wants to invest in the country, thereby increasing the demand for the currency

2.) Rising interest rates, because this indicates that traders who purchase a currency will be able to park at least some of their holdings in an account drawing decent interest.

The converse is true for shorting.

It used to be that countries would simply physically intervene in the currency markets; that is, they would go into the market and either buy or sell their currency or competing currencies. Now, the arguments between governments are centering on interest rate policy, which to my knowledge has never formed the basis of a country's argument about currency valuation. Most countries would find that kind of lecturing -- especially coming out of a severe recession -- unwarranted.

At the same time, China obviously views its accumulation of foreign reserves as an internal matter as well. The question is logically, is there a meaningful difference between the two that allows one country to pry into internal matters while the other country does not have a logical leg to stand on?

A closer look at Employment: Construction

- by New Deal democrat

One of the points I've made several times recently is that the expiration of several stimulus programs - the $8000 home buyer's credit, and aid to the states - served to "reset the clock" for jobs in those areas, as layoffs that would have happened one year ago, are instead happening now. Last Friday's payrolls report confirmed that the great majority of renewed job losses are happening in these two areas.

Today let's look at jobs in residential and nonresidential construction. Both of these sectors are very seasonal. Here's residential construction, nonseasonally adjusted:


and here is nonresidential construction, non seasonally adjusted:


The BLS does seasonally adjust both series, however. Let's start with residential construction. Here is the seasonally adjusted graph:


Notice that the number of job losses seems to have slowed dramatically. To better visualize this, it is best to look at the trends in year over year growth or losses.

In the case of residential construction, the year over year maximum decline in jobs took place in April 2009 (coinciding with the all time lows in both housing permits and starts), totaling -196,200. Presently, however, year over year losses have abated greatly and only total -37,200 as of this month. Here's the graph:


This statistic continues to trend towards the better, even though it hasn't turned positive yet. And it is encouraging that the post-housing credit expiration decline in new house sales hasn't led to that much of renewed decline in jobs in this area.

The situation is even less pessimistic in the nonresidential construction sector. The absolute bottom in these jobs took place earlier this year, and jobs have stabilized since:


Here the year over year maximum job loss took place in November 2009, totaling -113,400. As of last Friday's report for September 2010, year over year losses have abated to a mere -17,200. Here's the YoY graph for nonresidential employment:


A few weeks ago I noted that it might be time to start watching for the bottom in nonresidential construction. The fact that we are trending close to zero net job loss year over year is another encouraging sign.

In summary, while construction job losses may not have hit bottom in their absolute scale, the trend is encouraging, and suggests a turning point where year over year there is actual job growth in both residential and nonresidential some time next spring, i.e., in about the March to May window. After 5 years of relentless losses, that will be a welcome relief.

Yesterday's Market


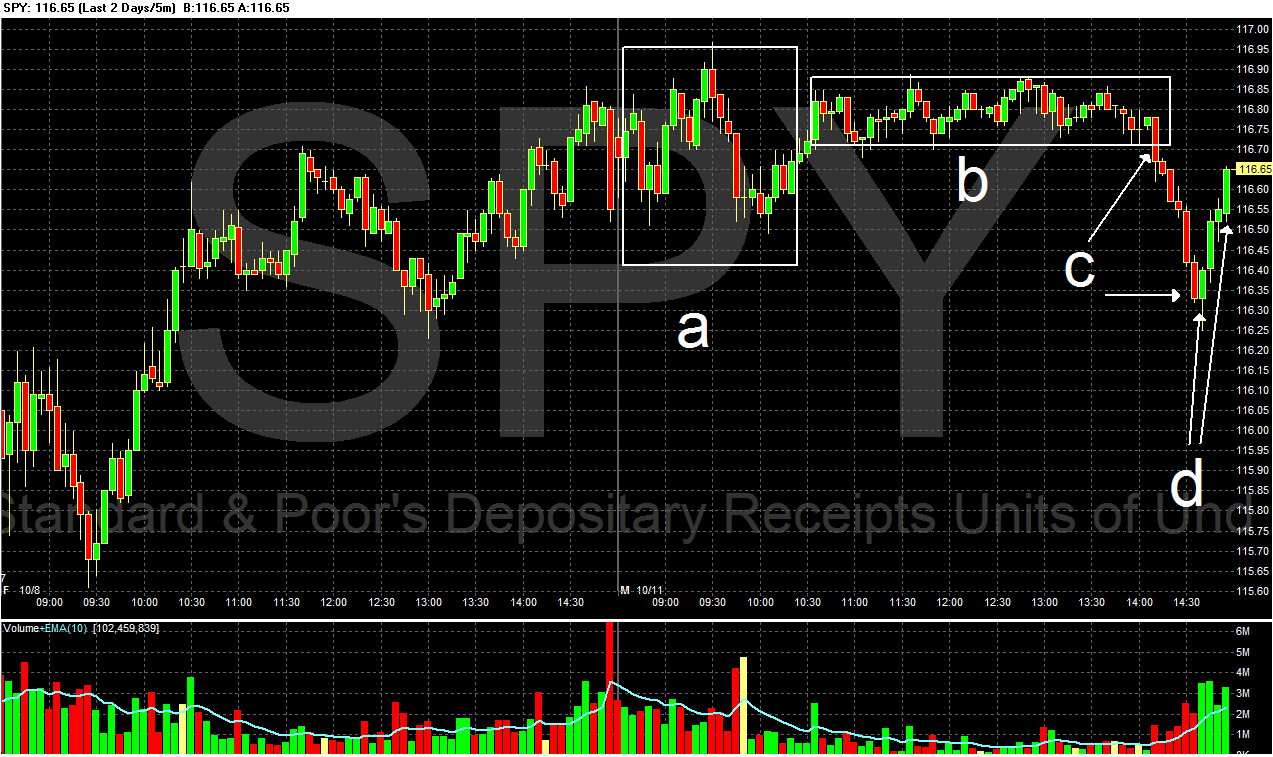
Stock prices had four periods of movement yesterday. They opened with some fairly wide vacillations (a), but then settled down in a very tight trading range for most of the day (b). There was a sharp sell-off before before the close (c) which was followed by a quick rebound (d).


The Treasury market was very dull. Prices have a slight uptrend between lines a and b, but closed up .1%.


the big news yesterday was the dollar's "rise" (b) after a long fall (a). I've drawn the Fibonacci retracement levels in the event the dollar begins a counter-trend rally.


Commodity prices were generally very subdued yesterday as well. they opened with a quick spike (a) but were also in a tight range for most of the trading session (b).


Corn gapped higher (A), largely because of the USDA's downgrade of this years corn crop. Prices are now above key resistance and the MACD has printed a buy signal (B). Also note the EMAs are still very bullish (C) -- all moving higher and the shorter above the longer.


Gold is still very much in an uptrend (A). The EMAs are bullish (B) and the MACD (C) indicates more is probably on the say.

Monday, October 11, 2010

Weak Growth Ahead

Last week, I wrote a series titled Where Will Growth Come From, which concluded:

So, in short, there is growth, but it is extremely weak.


Professor Hamilton at EconBrowser looks at some other indicators and draws the same conclusion.

Houston, Texas: A Study in the Importance Of Infrastructure


For reasons unknown, infrastructure spending is a hotly contested topic. Why this is even being debated is literally beyond me; it seems as though people have taken the benefits for granted or not thought about all the benefits of infrastructure spending. So to highlight why it is so important, I'm going to use my hometown of Houston, Texas. First, here is a map:


View Larger Map

This map is linked directly from Google, so I'm not able to draw on it. However, first notice the city is literally a giant bulls eye. Downtown is pretty much right at the center. Toward the southwest along highway 59 is Sugarland, toward the west along I-10 is Kary, in the Northwest along Highway 290 is Jersey Village and at the very top right along I-45 is the Woodlands.

All of these cities are suburbs of Houston. And all have grown strongly over the last 20 years. And all are located along a major highway.

Now consider the cost of building the major highways in comparison to the benefits of four separate communities growing at strong rates, all feeding into a major city. Think of the financial benefits over a period of decades -- as in, once the highway is built the benefits start to accrue as the communities build and the benefits increase at higher rates as the communities become larger. For example, 30 years ago, Sugarland was literally barely there. Now -- 30 years later -- it's a thriving community with a population of 81,725 in 2009 that has had a 21.9% increase in its population since 2000. In other words, the highway is still paying a dividend in terms of economic growth. And the same can be said of all four communities mentioned above along with all the other outlier communities in Houston along major highways.

Now consider that the 10-year is currently trading at a yield of 2.62%. What do you think the internal rate of return will be on well-planned projects. Really high. And the benefits now are extraordinary. Consider that construction employment has dropped precipitously during the latest downturn:


The above chart shows a drop of 2,000,000 jobs. Putting those people to work would have the immediate effect of putting people to work. And no, they wouldn't be digging holes only to fill them up later. They would be constructing and improving the nations sagging infrastructure. And 30 years later along highways we'd see townships, growing and people prospering. And we could do it a 2.62% interest cost. What a great deal.

Here is perhaps the saddest part of this situation: when you analyze the investment from a pure business standpoint, it makes tremendous sense; that is, when you look at the current cost of funds over the long-term benefits (think decades) this is literally a no brainer.

About the Mortgage Mess

From RTTN News:

Bank of America Corp. (BAC) on Friday suspended foreclosure sales in all 50 U.S. states, as it extends a review of foreclosure documents.

Bank of America, the largest U.S. mortgage servicer, had last week suspended all foreclosure proceedings in the 23 states where foreclosure must be approved by a judge. J.P. Morgan Chase & Co. (JPM) and GMAC Home Mortgage Inc., a unit of Ally Financial Inc., had announced similar plans earlier.

The decisions come amid reports of servicers ???dubbed "robo-signers"??? who signed thousands of foreclosure documents on a daily basis without properly reviewing the information in the documents. Some of the employees of the lenders are alleged to have rushed through the mortgage documents without properly verifying their information. The verification includes the accuracy of the loan information, including who owns the mortgage.

Bank of America, the largest U.S. bank, has not yet come up with any exact figure stating the number of suspended foreclosures. GMAC has also refrained from giving any figure. However, J.P. Morgan has said the move could affect 56,000 home loans that are currently in some stage of the foreclosure process.

Bank of America became the largest U.S. mortgage servicer after buying Countrywide Financial Corp. in 2008 at the peak of the financial crisis.

Now, let me put my corporate counsel hat on (my day job) and explain the reasoning for the process that was used. At some point, the head of the loan servicing department called counsel and said, "we've got a ton of foreclosure documents that we need to sign. The problem is we don't have enough people to go through all of them. What can we do?" That's when this "robo-signing" idea same about. Someone basically said, "place all of the foreclosure documents in one file and we'll get a mass signing program in place to move the process forward."

In theory (which means on a low school exam) this idea made sense.

Here's the basic problem with what's going on: banks who serviced the loans had loan officers essentially mass file foreclosure documents. The problem is the signatures were on affidavits, which are:

written declaration[s] made under oath; a written statement sworn to be true before someone legally authorized to administer an oath

The purpose of an affidavit is it forces the signor to "go on the record." If the signor of the affidavit is not telling the truth he (or she) can now be charged with perjury. And that's where the problem for this situation comes in: after going through these records and talking to the people who signed the affidavits on now closed cases it became obvious that they had no idea of what was going on with the relevant cast files. That's a huge problem from which there is no easy exit; frankly, I have no idea how to handle it.

Now, the real question becomes how to handle the foreclosure situation from a legal perspective because the system is not really able to deal with the current amount of cases. Personally, I think the real answer is to create a separate foreclosure court for the heavily effected areas (California, Arizona, Nevada and Florida come to mind), dedicated solely to foreclosures. Give the court a limited mandate and existence (say 5 years) and set them to work.

Yesterday's Market


Last week, equities sold off on Monday(a), but gapped higher into a strong rally on Tuesday (b). prices consolidated gains for about two days (c) before moving into an upward sloping channel for the remainder of the week (d).


Treasuries were in a narrow range for Monday and Tuesday (a), but gapped higher on Wednesday for another tight, two-day trading range (c). Prices then gapped higher on Friday (d)before a sell-off that lasted until the end of the day (e).


The dollar moved lower for most of the week with four gaps lower (a, b, c, and d).


Commodities gapped higher on Tuesday (a), and then formed a rounding top for Tuesday through Thursday (b). Prices then gapped higher on Friday (c) and moved higher for the remainder of the day (d).

What does all of this tell us?

1.) Stocks are rising in anticipation of a new quantitative easing program from the Fed, with the expectation of more economic growth.

2.) Bonds are also rising in anticipation of the QE program, as it indicates the Fed will be purchasing treasuries and not raising rates anytime soon.

3.) The dollar is falling, largely because of the QE program, as this indicates rates will not be increasing soon and there will be an increase in the raw number of dollars in the overall financial system.

4.) Commodities rallied from a decreasing dollar and a report from the USDA that lowered the overall crop level for the coming harvest.


On the daily chart, the SPYs are now above key resistance (a) and have moved above minor resistance (b) and are also above key Fibonacci levels.


While the IEFs have broken the primary uptrend (a), they continue higher with the secondary uptrend (b).


The commodity market broke through key resistance on Friday (a).


The dollar continues to make new lows (a) after breaking through the neckline of the multi-year head and shoulders formation.

Saturday, October 9, 2010

Week(-end)ly Indicators: Jobs Jobs Jobs edition

- by New Deal democrat

[Note: Sometimes the real world curtails my ability to participate here. This last week was such a week. Anyway, I have time now, so here, tardily, are the weekly indicators]

The only important monthly statistic released this week was saved for last. September was the first month all this year that, excluding the census, jobs were lost. -18,000 to be exact. As I pointed out in a brief comment yesterday, there is a real divergeance between the BLS's Establishment survey, which is the source of that number, and the Household survey, in which the Census Bureau showed +141,000 jobs being created. There is about a 1,000,000 job difference so far this year in the two surveys!

A few notes, contra most commentary. The benchmark reduction of -330,000 jobs covered the period of March 2009 to March 2010. If it is like last year's revision, the lion's share of that reduction will be in the first part of that period, i.e., at the end of the recession and immediately afterward in 2009. It may not impact 2010 more than trivially. We shall see.

Secondly, the internals of the BLS report actually showed continued widespread slow gains in jobs, with two important exceptions: local government jobs, and construction. These are precisely the two areas where stimulus was withdrawn or not renewed earlier this year. As a result, new home sales tanked, and state and local governments have been forced to lay off thousands of workers. Layoffs that otherwise would have happened in 2009 are happening now -- in the case of state and local employees (-76,000), these layoffs can be blamed squarely on Congressional idiocy.

Manufacturing hours worked declined .1 hour. This will subtract from the LEI, but September's LEI should still be positive. Otherwise, the manufacturing data showed a continued slowdown, but still growth.

Let's turn now to the high frequency weekly data. These continue to generally be positive, but were more mixed this week.

The Mortgage Bankers' Association reported that its Refinance Index decreased 2.5% from the previous week, and has now declined for 5 straight weeks, despite record low rates. The seasonally adjusted Purchase Index, however, increased a whopping 9.3% from one week before. This is quite a bounce, but don't celebrate yet, as it was probably due to "a desire by borrowers to get applications in before new FHA requirements took effect October 4th, which included somewhat higher credit score and down payment requirements.” Still, it's nice to see purchase activity has a pulse.

The ICSC reported same store sales for the week ending October 3 fell -0.8% week over week, but were up 2.4% YoY, a weak performance compared with recent gains. Shoppertrak reported that for the week ending October 2, YoY sales rose a pathetic 0.2%, and 2.3% over the previous week. On a monthly basis, the ICSC said that September same store sales rose 2.6% YoY, but this rate of growth is below the 3% YoY growth rate during the summer. Since retail sales started to grow meaningfully in the latter part of last year, in part this simply shows more challenging YoY comparisons. Nevertheless, retail sales appear to be reflecting the anticipated economic slowdown in growth.

Gas prices rose 4 cents to $2.73 a gallon, and at usage at 8.989 million gallons was slightly below last year at this time. Gasoline stocks continue to be 10% above their normal range for this time of year. This also reflects a slowdown, and the fact that Oil rose close to $85 a barrel this past week is a bad omen, as the price of Oil continues to act as a choke collar on growth.

The BLS reported 445,000 new jobless claims. The four week average declined again to 456,000, close to its lowest reading all year. The decline in new jobless claims is an important bright spot in the LEI.

Railfax once again showed rail traffic improving last week, and improving at a rate similar to one year ago. Economically sensitive waste and scrap metal improved, but still is running no better than last year's levels. Auto loads increased compared with last year.

The American Staffing Association reported that for the week ending September 26, temporary and contract employment increased to 100.0, once again making a two year high. Temp staffing is near 2006 levels, but not a 2007's yet. If this trend continues, in a few month we should see more permanent hiring.

M1 rose 1.5% last week, and also increased about 1.5% month over month, and up about 6.5% YoY, so “real M1” is up 5.3%. M2 increased again 0.3% last week, +0.7% month over month, and up 3.3% YoY, so “real M2” is up 2.1%. The important news here is that "real" M2 is now close to breaking out of the "red zone" of +2.5%, which would give us the "all clear" as to any "double dip."

Weekly BAA commercial bond rates declined last week, down .08% to 5.58%. Rates falling while stock prices rose remains a good sign.

Five days into October, the Daily Treasury Statement is up $41.7 B vs. $38.3 B a year ago, a gain of ~6%. For the last 20 days, receipts are up $128.4 B vs. $122,5 B a year ago, a gain of about 4.9%.

The weekly indicators were mixed this week. Improving jobless claims, rail loads, money supply, and temp staffing were offset by Oil prices, and weak retail. Slowdown, but no double-dip, remains the story.

Friday, October 8, 2010

Back on Monday

It's Friday, so we're gone until Monday. Enjoy the weekend; we'll see you on Monday

What is the Structure of Unemployment?

The "structural vs. low demand" debate has been going on for awhile.

But the national figure hides a sharp divergence between rust-belt manufacturing states in the north and east, where unemployment is high but new job losses have fallen, and Sunbelt states in the south and west, where the labour market remains in flux.

.....

This pattern provides a clue to a vital policy debate: does high unemployment just reflect weak demand, in which case the Federal Reserve might be able to do something about it by launching a new round of asset purchases? Or is it a structural problem, showing that workers are in the wrong place or have the wrong skills, in which case monetary policy can do little?

.....

Eric Rosengren, the president of the Boston Fed, noted that across the country job losses have been spread across a range of different industries.

“If all the loss was in construction then that’s a structural change, but that’s not the pattern we’ve seen,” he said in an interview with the Financial Times. Mr Rosengren’s colleague, Narayana Kocherlakota, Minneapolis Fed president, has made the reverse argument in speeches.

“Firms have jobs but can’t find appropriate workers. The workers want to work but can’t find appropriate jobs,” he said.

Mr Kocherlakota pointed out that the number of job openings has recovered but unemployment has not fallen in proportion. That implied something was preventing people from taking the available jobs. Mr Kocherlakota estimated that up to 2.5 percentage points of today’s unemployment was the result of the mismatch between jobs and workers.

In the rust-belt states much of the surge in unemployment was caused by the woes of the car industry. That rush of job losses has ended but it almost certainly left behind some workers whose location and skills meant they would struggle to find jobs, even if there were strong demand for labour. That was probably true before the recession as well, however: Michigan had a 7 per cent unemployment rate during the boom of 2006-07.

An argument for geographic mismatch is North and South Dakota. There unemployment is below 5 per cent, yet the states are not so distant from Michigan, at 13 per cent. As Lawrence Mishel of the Economic Policy Institute pointed out, however, these states are small and their workforce would have to expand vastly to absorb the unemployed from a state such as Michigan


Here is a link to the Boston Fed's study.

Here is a link to the Minneapolis Fed's study.

Where Will Growth Come From? Conclusion

All this week I've been looking at different economic sectors to see where growth will come from. The problem the economy now faces is no one area is strong enough to drive growth.

Looking at PCEs, there is little reason to think we'll see quarter to quarter growth over the approximately 2% we've seen for the first four quarters this year. Between a high savings rate, high unemployment and paying down debt, it appears consumers are already at their maximum rate of PCE spending. The good news here is PCEs account for 70% of growth, so the largest part of the economy will expand; just not at a robust pace.

Invesetment is also a dud. Any real estate investment is pretty much out for the foreseeable future, leaving equipment and software spending. And while the growth in this area has been robust, it only accounts for 7.5% of GDP. The good news here is businesses are sitting on a ton of cash and have demonstrated they do not want to hire employees, meaning this area of investment spending should continue to benefit.

Manufacturing is clearly slowing. While the overall national numbers are still showing growth, they are just barely positive. The good news here is a cheap dollar should help exports, which -- along with the strong growth in emerging economies -- should prevent this sector from falling into the abyss. But the slowdown across the entire Eastern seaboard indicates this sector is taking a hit from decreased demand somewhere.

Services are growing, but weakly. The regional Beige Book surveys described increases as "moderate" or unchanged. It appears that people are using services only when necessary, and then are haggling over cost.

So, in short, there is growth, but it is extremely weak.

Employment Report: More of the Same

I could swear this months report is a carbon copy of the basic situation from last month's report. Basically, modest private sector hiring is offset by big losses in the government sector.

Let's look at the details, starting with the household survey.

The civilian, non-institutional population (everybody over 16 who isn't in jail or in the military) increased 223,000. This numbers is the denominator in a a lot of calculations. The civilian labor force (all employed and unemployed persons) increased 48,000. As such, the participation rate -- the percentage of people who are "participating" in the work force was unchanged at 64.7%.

The number of employed people increased 141,000 while the number of unemployed decreased 93,000.

Turning to the establishment survey, we get the following:

Total, non-farm employment decreased 95,000, but that is the result of a loss of 159,000 in the government employment area. Goods producing industries lost 22,000, largely as a result of a 21,000 drop in construction employment and a 6000 drop in non-durable goods employment. service sector employment increased 86,000, which was largely caused by an increase of 32,000 in health care and social services and a 38,000 increase in leisure and hospitality employment.

Government employment dropped by 159,000, which was evenly split between federal (76,000) and local (76,000).

Average weekly hours remained constant, average hourly earnings increased .01 (a penny) and average weekly earnings increased from 639.52 to 639.85. The index of aggregate weekly hours increased from 99.5 to 99.6.

As I said up top, this sure looks like the last employment report.

On a scale of 1-10, this is a 3.5 at best. There is some hiring, but nowhere near enough.
==========

NDD here: Two things about the September report jumped out at me. (1) is the continuing local government job losses. As I have noted before, the refusal to extend budget help to the states means that layoffs that would have happened a year ago, are happening now instead. In contrast, virtually all other areas showed job gains. (2) is the continuing divergeance between the Establishment and Household surveys. The former showed -95,000 while the latter showed +141,000. The Establishment survey is showing less than 650,000 jobs added to the economy all year, while the Household survey shows almost +2,000,000! This is a huge divergeance.

Yesterday's Market


First, aside from the strong rally on Tuesday morning, the price action for the last two and a half days has been extremely limited. Traders are obviously waiting for today's employment report.


Yesterday, prices opened higher (a), but quickly fell and consolidated in a downward sloping pennant pattern (b). after selling off and bottoming, prices rose and consolidated in two downward sloping pennant patterns (c and d). However, the overall range of the price action was about a point (15.30 - 16.55). This is a very tight range.

The good news for the equity markets is all the averages have broken through key resistance levels:


The bad news is the markets don't feel strong.


Lumber has formed a strong base (A) and has broken through resistance (B). But there is no strong upward momentum in the chart; instead, prices are meandering at the next highest level.


Copper is still in a strong uptrend (A), which has continued higher after several consolidation areas (B and C). In addition, the EMA picture is strong with all the EMA moving higher and the shorter EMAs above the longer.

Thursday, October 7, 2010

Automation Over Hiring

From the LA Times:

"Labor is so expensive," said Young, whose great-grandfather started farming row crops in Kern County in 1910. "There's their wages, truck, insurance, workers' comp and the safety regulations. We went to a high-value crop that needed less labor input."

Young estimates that at seasonal peaks, he now employs 70% fewer workers.

That sentiment isn't unique to farming. Forced to cut costs during the recession, employers across the country are looking at ways to avoid hiring. They've accelerated use of computers and technology, replacing administrative assistants with software, cashiers with self-service kiosks and laborers with machines.

These structural changes mean some jobs that disappeared during the recession may never come back. Productivity gains are good for company profits and help the economy grow over the long run. But in the short term, the shift is exacerbating America's jobless recovery.

"Recessions tend to act as ratchets; they'll often speed the pace of fundamental changes that were going on in the economy anyway," said Erica Groshen, vice president and director of regional affairs at the Federal Reserve Bank of New York.

Ditching workers is an appealing prospect to many California farmers. Few states have minimum wages higher than California's $8 an hour. The heightened focus on workers' immigration status has increased farmers' administrative burden.

With the help of machines, though, growers can continue to boost output while reducing headcount. Farm labor in California has fallen 11% over the last decade, yet cultivation of heavily automated crops soared over the same period: almond production has more than doubled, to 1.6 billion pounds.

"If cheap technology is available, you substitute technology for people," said Allen Sinai, chief global economist at Decision Economics in Boston.

Automation has been a steady progression since the Industrial Revolution. Still, laying off workers is never easy. Recessions give companies a motive to move more swiftly than they otherwise might have to cut staff, outsource work to cheaper locations and implement labor-saving technology, Sinai said. When sales pick up, companies can help profits rise quickly by keeping a lid on hiring.

That's part of the reason that earnings at some large companies have soared over the last year while job creation has lagged behind. In August, U.S. private sector employers added 67,000 jobs, far fewer than the 100,000 needed to keep pace with population growth.

Capital intensity — how much a firm relies on software, tools and machinery — contributed 1.6% to productivity gains from 2007 to 2008 after growing just 1% from 2000 to 2007, according to the Bureau of Labor Statistics.


This is something I've touched on before (see here and here).

Geithner Joins the Currency Discussion

From Bloomberg:

Treasury Secretary Timothy F. Geithner called for cooperation to rebalance currency markets and warned of a “damaging dynamic” of competitive weakening that could limit global growth.

“More and more countries face stronger pressure to lean against the market forces pushing up the value of their currencies,” Geithner said in a speech yesterday in Washington. Currencies are “inherently a multilateral issue” that is “much easier to solve if countries come together.”

Global exchange-rate policies are a source of contention ahead of this week’s meeting in Washington of the International Monetary Fund, World Bank and Group of 20 officials. Brazil’s Finance Minister Guido Mantega last week warned of a “currency war” as governments in Asia and Latin America seek to spur exports and economic growth.

This is the latest development in a multi-pronged story. I believe it started with the Brazilian statement regarding a currency war, although the US House's action on raising tariffs on Chinese imports may have also started the wave. Now we have the US Treasury Secretary entering the fray.

I think it's great that this issue is now out in the open.


Where Will Growth Come From? Part IV; Services

The primary source of information on the service sector comes from the Institute for Supply Management's ISM index. Here is the latest report:

"The NMI (Non-Manufacturing Index) registered 53.2 percent in September, 1.7 percentage points higher than the 51.5 percent registered in August, indicating continued growth in the non-manufacturing sector at a faster rate. The Non-Manufacturing Business Activity Index decreased 1.6 percentage points to 52.8 percent, reflecting growth for the 10th consecutive month, but at a slower rate than in August. The New Orders Index increased 2.5 percentage points to 54.9 percent, and the Employment Index increased 2 percentage points to 50.2 percent, indicating growth in employment for the third time in the last five months. The Prices Index decreased 0.2 percentage point to 60.1 percent, indicating that prices increased in September at a slightly slower rate. According to the NMI, 11 non-manufacturing industries reported growth in September. Respondents' comments continue to be mixed about business conditions, with a slight majority reflecting optimism."
The anecdotal information contained in the report is showing a slower situation:


  • "General state of the business has not changed in the last three months. The market is still soft for new sales due to financing requirements." (Construction)
  • "Business seems to be flat from last month." (Finance & Insurance)
  • "Signs that the economy may be improving, but our sector is still flat or declining." (Professional, Scientific & Technical Services)
  • "Business activity is generally stable — slightly better than last year." (Accommodation & Food Services)
  • "Third quarter is looking profitable with improving confidence and expectations in the economy. Capital expenditures are being approved." (Wholesale Trade)

I've always assumed they include various anecdotal statements because they are representative of the industry or a group of statements. The above statements use the word "stable/flat" is pretty prominent. In other words, things are OK, but not great. No one is saying, "people are literally kicking the door down to buy something."

Let's take a look at some of the data:


Like the ISM manufacturing index, the non-manufacturing index bottomed at the end of 2008 and rose until 2010. Over the last few months we've seen it slip, but it is still showing readings above 50 indicating expansion.


The new orders index is still above 50, but it is also in a clear downtrend.

We can also glean some information from the Federal Reserve's Beige Book:

Activity was largely stable or up slightly for professional and other nonfinancial services. Providers of information technology (IT) services such as computer software saw substantial revenue and sales gains in the Boston and Kansas City Districts, with increased demand for IT labor reported in Chicago as well. Demand for professional services such as accounting held largely steady, with Minneapolis and Dallas noting increases for selected types of consulting and legal services. Conditions were mixed for providers of real estate services, as heightened appraisal activity for refinancing purposes was offset by depressed home sales and consequent limited needs for agents and brokers. Demand for temporary staffing services remained on an upward trend, with increases noted by Boston, Philadelphia, Richmond, and Minneapolis, although Chicago pointed to a slight softening during the reporting period. Reports from the health-care sector were mixed: Boston, Cleveland, and Chicago reported ongoing increases in demand for health-care workers, while Philadelphia indicated a flattening in demand for health-care services and San Francisco noted a decline in the frequency of elective procedures and routine tests. Demand for shipping and transportation services generally expanded, although according to Cleveland the pace of growth slowed and contacts there expect little change from existing volumes in the near term.


Let's take a look at some of the Fed regions:

Boston: Software and information technology contacts in the First District report that business conditions continued to improve. Year-over-year revenue increases ranged from mid-single digits to 15 percent in the most recent quarter. Half of contacted firms increased their headcounts and another was "on the cusp of hiring."

Philly: Service-sector firms generally reported minimal gains or flat rates of activity since the previous Beige Book. A large business services firm reported that client companies were not contracting for as much business as they had indicated earlier in the year. Several health-care organizations noted recent flattening in activity that is interrupting a long growth trend. In contrast, some temporary employment agencies noted that demand had picked up recently. Looking ahead, most of the services firms contacted for this report expect growth to be slow for the rest of the year. Some have reduced their forecasts; as one contact said, "It looks like we were a little too optimistic earlier this year."

Richmond: Services-providing firms also gave mixed reports. Contacts at healthcare organizations noted that demand was typical for the summer, while airport officials and electrical contractors saw a small increase in demand for their services. A telecommunications contact reported accelerating revenues, while several administrative-support firms cited flat or slowing revenue growth. Local officials in Norfolk, Virginia noted that a recently announced shut-down of major military facilities would affect a large number of civilian contractors. Community leaders indicated that they will be vying for other military projects. Price growth slowed slightly at services firms in recent weeks, according to survey respondents.

St. Louis: The District's services sector also has continued to improve since our previous report. Firms in the transportation, business support, telecommunications, and government services industries expanded existing operations and hired new employees. Additionally, firms in the restaurant industry opened several new facilities. In contrast, contacts in the business support services and janitorial services industries reported plans to decrease operations and lay off workers.

Minneapolis: Activity in the professional business services sector increased since the last report. Contacts from the legal sector reported that billings during July were up from a year ago, especially for firms that deal with bankruptcies. A call center is expanding in South Dakota. Appraisers and other professional services firms that support home refinancing reported strong activity over the past month.

Kansas City: Growth in transportation services moderated slightly from previous surveys but remained solid, and a major supplier of diesel fuel reported continued solid sales. Most high-tech services firms reported strong growth in sales, although a few contacts noted softened demand. Business firms' expectations for future sales eased somewhat from the previous period but remained positive.

Dallas: Most staffing firms report that demand continues to grow at a solid pace, and is particularly strong for light industrial, sales, administrative, professional and technical workers. Placement activity continues to be mostly for contract work as employers are still hesitant to hire permanent staff. Near-term outlooks are optimistic, but respondents are cautious about the longer term. Accounting firms note that while demand for tax-related services has slowed seasonally and that for real estate and construction-related work remains nonexistent, there has been a pickup in transactional and consulting activity. Demand for legal services was largely unchanged during the reporting period, with the exception of an uptick in corporate demand for mergers and acquisitions-related activity.

Demand for transportation services remains positive. Railroad respondents noted a broad-based increase in cargo volumes, with shipments of grain products recording the largest increase. Shipping firms said small parcel cargo volumes rose, while large freight shipments declined during the reporting period. Intermodal transportation firms reported a modest increase in shipments. Airline traffic was flat to slightly down since the last report, but is stronger than a year ago. The outlook is for continued stability in air travel demand.

San Francisco: Demand for services improved modestly on balance but remained lackluster overall. Demand for professional, media, and entertainment services was mixed across sectors but appeared to be largely stable at low levels on net. Providers of energy services reported stronger demand for industrial use, with the exception of wood products. Contacts from around the District noted increased business travel and tourism activity, as reflected in higher visitor volumes, hotel occupancy rates, and airline passenger miles, although visitor spending remained weak. Providers of health-care services reported that demand slipped somewhat, which they attributed in part to rising postponements or cancellations of elective procedures and routine tests by individuals who lack health insurance.

Overall, the general tone is one of growth, but muted. Growth is between "lackluster" and growing, but the emphasis seems to be on caution. People are seeking services, but at a reduced pace.

Yesterday's Market


Stocks are now above the 61.8% Fibonacci retracement level. There is very little overhead resistance aside from round numbers at this point (I'll touch on the recent action below).


At the same time, the 7-10 year part of the curve is also rallying. While it has broken the primary uptrend (a) it has now formed a second uptrend (b).


The TLTs -- the long-end of the Treasury curve -- are also rising. They are also above key support levels (b).

S0 -- at the macro-level, both stocks and bonds are rising. The move into stocks indicates there is an increased risk appetite on the part of investors. In addition, the lower yields on Treasuries is driving investors to seek higher dividends and more capital appreciate in stocks.

The rise in bonds indicates two things. First, investors don't see the Fed lowering rates anytime soon. In addition, inflation is also not a concern; if it was, people would be moving out of Treasuries.


The dollar's chart also tells us that traders don't thing the Fed will be raising rates anytime soon. After forming the head and shoulders formation, prices broke through the neckline and have moved lower at a strong pace.


As a result of the lowering dollar, we've seen an increase in commodities, which are clearly in a rally (a) and are just below key resistance (b). Part of the rise in commodities is the result of the lower dollar:


But part of it is also the rise of demand from growing industrial economies.

Overall, the markets are fairly bullish for the economy: the rise in equities indicates an increase in risk appetite; the rise in Treasuries indicates that traders think rates will stay low for the foreseeable futures; the lower dollar bolsters the interest rate argument and helps exports and commodities are rising because of increased demand.

Wednesday, October 6, 2010

Industrial Metals Rising

From to FT:

The price of tin has jumped to a new high, making the metal, widely used in electronic goods, the first base metal to surpass the peak it hit during the boom years before the global financial crisis.

The record comes as resurgent demand, particularly from Asia, is being met by sluggish supply in all the industrial metals, driving prices higher.

.....

Copper, the red metal used in electrical wiring and piping, rose above $8,200 a tonne for the first time in two years, and there is widespread expectation in the industry that it will post an all-time high above $9,000 within months.

Even aluminium, the laggard of the group whose supply is plentiful, has risen 25 per cent since June and is trading near a two-year high.

This bodes well for manufacturing in the future, as it indicates demand is increasing.


IMF Chief Warns of Currency War

From the FT:

Governments are risking a currency war if they try to use exchange rates to solve domestic problems, the head of the International Monetary Fund has warned.

The comments by Dominique Strauss-Kahn came before the yen fell as a result of the Bank of Japan shifting towards quantitative monetary easing, cutting its key interest rate and proposing a new fund to buy government bonds and other assets.

“There is clearly the idea beginning to circulate that currencies can be used as a policy weapon,” Mr Strauss-Kahn told the Financial Times on Monday.

“Translated into action, such an idea would represent a very serious risk to the global recovery . . . Any such approach would have a negative and very damaging longer-run impact.”