Thursday, December 3, 2009

Initial Jobless Claims: 457,000 + UPDATE: Service sector contracts

- by New Deal democrat

The BLS reported that for the week ending Nov. 28, seasonally adjusted initial jobless claims were 457,000. Last week's number was revised down 4,000 to 462,000. The 4-week moving average was 481,250, a decrease of 14,250 from the previous week's revised average of 495,500. The 4 week seasonally adjusted moving average is now about 23% lower than the peak of 658,750 on April 3 of this year. Although the seasonal adjustment might now be overstating the decline, the trend certainly continues downward.

Unadjusted, there were 460,989 new claims, a decrease of 78,263 from the week before, and well below the 535,730 unadjusted initial claims in the same week last year. In unadjusted terms, this was the best new claims number, relative to normal seasonal adjustment, in well over a year.

Because the BLS normally surveys business payrolls in the week ending the 12th of the month, this won't show up until the December jobs number is reported a month from now (i.e., not tomorrow). According to my previous research, with almost two months' of jobless claims more than 16% off the high, and over one month more than 20% off the high, this morning's jobless claims number would indicate that jobs are actually being added to the economy this month.

--------

If the jobless claims data was great, the ISM services index was equally bad:
“The NMI (Non-Manufacturing Index) registered 48.7 percent in November, 1.9 percentage points lower than the 50.6 percent registered in October, indicating contraction in the non-manufacturing sector after two consecutive months of expansion. The Non-Manufacturing Business Activity Index decreased 5.6 percentage points to 49.6 percent, reflecting contraction after three consecutive months of growth. The New Orders Index decreased 0.5 percentage point to 55.1 percent, and the Employment Index increased 0.5 percentage point to 41.6 percent. The Prices Index increased 4.8 percentage points to 57.8 percent in November, indicating an increase in prices paid from October. According to the NMI, six non-manufacturing industries reported growth in November. Respondents’ comments remain cautious about business conditions and reflect concern over the length of time for economic recovery.”
....
WHAT RESPONDENTS ARE SAYING …
“Capital markets remain very tight; lenders are not releasing funds for development projects, limiting expansion.” (Accommodation & Food Services)
“Fourth quarter still looking grim, but potential upturn for Q1 2010.” (Professional, Scientific & Technical Services)
“No one trusts that the recovery is real. Seems everything and everyone is in a holding pattern.” (Public Administration)
“Business is still flat.” (Wholesale Trade)
“U.S. business remains better than 2007 levels, although it’s been through personnel and cost reductions that we are now profitable. Business continues to be about 8 percent below 2008 levels.” (Real Estate, Rental & Leasing)


[note: my emphasis]

This is a poor report. The employment component in particular, while slightly better than last month, makes for the worst 3 month average since the teeth of the recession earlier this year. So far, consumer spending hasn't picked up enough to stop the onslaught of business layoffs in this part of economy, most likely among smaller firms.

Hey, Is That A Gauntlet Over There?

While I don't consider myself a "doom and gloomer" -- more a realist, I'd hope -- I tried on the shoe my co-blogger NDD offered up and while it didn't fit exactly, it came close enough.

So first, to try to demonstrate that I'm not Chicken Little, here are some excerpts that I think portray a balanced point of view (in response to NDD's challenge):

Dec 1

Industrial Production appears to have carved out at least (let's hope) a temporary bottom, and is one metric we can look at as a positive, notwithstanding that it's taken a whole lot of government largesse to get us there.

November 24

This [referring to FOMC minutes excerpt], to me, encapsulates exactly where we are right now -- still on life support without a clue as to how the patient might fare if it were withdrawn. In all, I think the FOMC minutes were another "things are less bad" report, but there are still very real concerns about the fragility of whatever recovery we may experience and the ease with which it might jump the tracks.

November 24

Though not necessarily cause for concern, the decline [in the CFNAI 3-mo MA] is certainly worth keeping an eye on. As one data point does not a trend make, I'll simply suggest this could be a yellow flag.

November 9

There were, in my opinion, only two needles to be found in Friday’s NFP haystack:

1) The previous two months’ revisions were positive to the tune of about 91k
2) There was a 34k add in temp help (often a leading indicator for the labor market)

November 2

To be crystal clear on where I stand:

1) My primary concern is -- and always has been -- about the "handoff" or sustainability of growth. I think we can all agree that the government can't -- and shouldn't -- prop up the economy indefinitely. I get all the Keynesian stuff, but the government "bridge," such as it is, has to let you off on the other side at some point. My visibility as to where that might be is still extremely hazy.
2) I was for the stimulus package. In fact, I was for a bigger stimulus package. And while I'm not bemoaning -- only pointing out -- that last week's 3.5 print was largely government subsidized, I always seem to be left wondering, "Where do we go from here?" What is going to be the driver, the growth catalyst, to get GDP back up the sustainable trend (~3.0 or so) we require to get to fuller employment and see some wage growth? This is something that could have been -- should have been -- under discussion six months ago and is, as best I can see, still not.
3) My concern about sustainability is focused on the consumer.

Sept. 19

I’d be a fool not to acknowledge that most of the recent economic releases have been better than expected, particularly as relates to the [sic] most of the headline numbers. However, I’m still not sold on the sustainability, and in some cases I don’t necessarily like what I see lurking beneath the surface. I continue to believe that when it comes time for the government to hand-off the spending baton to the American consumer, the transition might not go as smoothly as everyone seems to think it will.

And on C4C:
The question needs to be asked: How many more vehicles/driver are we going to put on the road? How many cars/driver do we really need? Further, I will respectfully disagree with Bonddad and state for the record that there’s little doubt in my mind that Cash for Clunkers pulled forward some (perhaps unquantifiable) amount of future sales. The run rate didn’t go from ~9MM annually to ~13MM annually on its own. Unfortunately, it appears we’re headed back down toward ~9MM again, so it’s hard to believe the Clunker program didn’t cannibalize some Q4 sales. Keep in mind, too, that scrappage is about 12MM vehicles/year so we are, in fact, taking cars off the road, which would be consistent with the trend of the chart above beginning to turn down.
I think my Sept. 19 comment -- 2 1/2 months later -- is beginning to play out, and as NDD mentioned, Paul Krugman invoked the specter of a double-dip on his blog just yesterday.

To me, it really all boils down -- as I've said countless times -- to the consumer and jobs, jobs, jobs. To that end, I intend to have some employment-related posts (with what I hope will be some nifty chart work) up fairly soon. (Let's just say I don't think we need to debate whether or not this will be a jobless recovery -- it already is.)

Thursday Oil Market Round-Up


Click for a larger image

A.) Prices are still in a downward sloping pennant/flag formation.

B.) Momentum is decreasing, but

C.) We haven't seena huge move out of the oil market from a volume perspective.


Notice how the EMAs are bunched together with no clear signal in either direction? That means we're waiting -- which is probably one of the hardest things to do from a trading perspective -- wait for something to happen (or until the chart changes). Also note that prices are hovering around the 200 day EMA. In other words, we don't know if we're in a bull or bear market right now.

Wednesday, December 2, 2009

Today's Market


On the two charts above (as always, click for a larger image) notice that both are running into a lot of upside resistance. Also note that both are printing a series of very weak candles -- very small bodies with very long shadows. Note that volume is also down. These charts are telling us prices can't get above a certain level, indicating the upward momentum has dropped.


The IWCs -- the microcaps -- have already fallen from highs and are consolidating above the 200 day EMA. This tells us that risk capital is pulling back from the market.

Regarding the Markets and Moving Averages

In last night's market wrap, I noted the markets weren't that attractive from a trading standpoint. Let me illustrate that prospect with the following charts. First, basic materials and financials were some of the strongest performers. However, consider these charts:


The XLBs have been in a trading range for the last few months. And the financials


Have been there longer. In addition, we've seen a weakening momentum in the SPYs and a concentration of upward action in larger shares. As a result market breadth has narrowed. Consider these charts:


New York market breadth as moved sideways and


NASDAQ market breadth is dropped.

Simply put, it's not the greatest market to make a trade in.

Now -- unfortunately I deleted a very insightful comment that mentioned that moving averages are the best indicator for a sideways market. And -- since markets usually more more sideways than up or down, moving averages weren't the best indicator. This is a good observation. However it depends on what you are looking for.

Trading sideways markets is (in my opinion) a waste of time. Markets move sideways because there is no momentum one way or the other. With no momentum, even the most well thought out plans can get laid to waste. Momentum really helps the odds.

Regarding EMAs etc. it's important to look at all the EMAs. The shorter will whip around a bit more and therefore must be looked at in conjunction with the larger trend -- the longer EMAs.

More on Real Retail Sales and Jobs

- by New Deal democrat

This week, naturally, is dominated by the issue of jobs, jobs, jobs. Somebody on CNBC actually made some sense a short time ago by noting that Congress and the Obama Adminsitration probably wish it had paid more attention to this issue, and less on healthcare this year. Surely there was a sense of "Mission Accomplished" conveyed by the Administration once they passed the stimulus legislation in February, dusted off their hands and moved on to the next item on their "to-do" list.

Anyway, I have been harping for a few months now on how Real Retail Sales is the "Holy Grail" forecasting future jobs growth, and produced a variety of graphs showing how one led the other, typically by about 5 months. Today I want to look at a few variations on that theme.

First of all, the same leading nature of Real Retail Sales is apparent on graphs showing year-over-year change, for example this graph showing the last ten years:

A similar relationship as that found as to the absolute numbers exists: about half the time there is a two month difference of less between the number of months between a trough in Retail vs. jobs, and the number of months when each series crosses from negative to positive. In other words, if YoY% of Retail decline troughs 6 months before YoY% of jobs decline, there is a 50/50 chance that Retail will become positive 4-8 months before jobs on a Y-o-Y basis.

Secondly, while before 1982 there was no relationship between the YoY% of retail decline/growth vs. absolute monthly number of jobs lost/gained, in the recessions/recovery since then, there has been a relationship, and never moreso than in the last year:


I have noted previously how in this "Great Recession" services jobs have been particularly hard hit. While the above graph just shows correlation, not causation, it is fair to say that in the last year, employers have behaved exactly as if they are making decisions based on YoY retail spending, with the breakeven point of 0 jobs at +0.7% YoY retail growth.

This point is amplified by the below graph of the ISM non-manufacturing employment index (which is only about 15 years old)(the line), and BLS monthly jobs data (the bars). Especially when we average the ISM data over three months (not shown on the graph), the correlation seems exceptionally close, with the crossover point actually being about 48 or 49 rather than 50.


The above two graphs of ISM non-manufacturing employment, and YoY% change in real retail sales, are the two that have continued most closedly to correlate (on a coincident, not leading basis) with jobs data in the last year.

So where am I leading? First, the employment number in tomorrow's ISM non-manufacturing index is very important. While it only precedes the BLS payrolls number by one day, it is important confirming information from a private source.

Secondly, with November's good auto sales data, and so-so same store sales data, it looks likely that November Real Retail Sales will hold steady or show slight improvement. Unless we think that December's sales are going to tank, then YoY Real Retail Sales in December are going to be slightly positive, on the order of +0.5% to +1.5%. If the relationship between YoY retail sales and monthly jobs data continues to hold (obviously not a guarantee), then:

(1) there is a good chance that YoY payrolls, which troughed 8 months after Real Retail sales, will cross zero at some point between June and October of next year, meaning that the trough in "actual" jobs (as opposed to YoY%) will be some number of months before then; and

(2) any number above +0.7% (which could happen as soon as December's data), per the second graph above, would more likely than not correlate with job growth rather than losses (+/- monthly noise in the payrolls data).

Another Doomsday myth Debunked: "Cash for Clunkers only borrowed future demand"

- by New Deal democrat

There are major structural problems with the US economy -- chief among them, a yawning trade deficit that orthodox economics has no answer for; a lopsided accumulation of income, assets, and wealth at the very top; and a hollowed out former middle class. The road to reforming these imbalances would be painful even if political and economic geniuses with their hearts in the right places were at the helm.

I have said over and over before that the Progressive case is not Armageddon, it is Inequality, a pernicious, pervasive and incessant inequality of opportunity and reward that puts paid to the former American myth.

Doomers don't get it. Everything must be fed into the Doomsday machine. Every statistic, shorn of everything going up, is going down, therefore things are bad bad bad, and must necessarily lead to Great Depression II. Of course, we could still have GD2, and Prof. Krugman yesterday warns of the rising risk of a double-dip, appropriately so in my opinion.

But it ain't necessarily so. Ben Bernanke et al., have also read the books on the Great Depression -- in fact in the Fed Chairman's case, he's written one. So both the Keynesian and Monetarist solutions to GD1 have been tried with mild abandon in the last year (no, that's not a typo). They are bound and determined not to make the same old mistakes -- they will make new ones. Hopefully the new mistakes will not lead to the supposedly inexorable old outcome.

And so, yesterday, another Doomer myth bit the dust. November car sales were reported at 10.9 million vehicles, up from a year ago, and up from last month. This is the second increase in a row over September, and October and November have been the best months this year, ex- the 2 "cash for clunkers" months of July and August. In other words, the notion that the only thing that "cash for clunkers" did was borrow sales from the future, and we would have sub-9 million car sales a month for the foreseeable future, is yet another dead doomer black swan.

Not that they'll ever admit it. There isn't a week that goes by that I don't mention some news items that are contrary to my general take on the economy, and I always try to be open to the data changing my mind -- just as I was back in January and February when I noticed that consumers were coming "back from the grave" instead of spiraling ever deeper down into the endless abyss. But Doomers never have to admit that they have been wrong. They just move the goalposts, and move on to the next reason why Armageddon is upon us.

And if anyone in particular thinks this post is aimed at them, here is my challenge: find 5 times in the last 3 months when you have reported that data was positive. Not begudgingly, but with an accurate, neutral description. If you can't do that -- if you haven't been able to acknowledge that even 5 pieces of data in the last 3 months have been positive -- then you are ideology driven and are not, in fact, "reality based".

Wednesday Commodities Round-Up

A note to readers: while editing comments I mistakenly deleted some that I intended to publish. I apologize for this oversight.


A, B and C are all consolidation areas. Notice this is where the market has spent most of its time over the last 4 months -- consolidating after gains.

D tells us that as markets are consolidating there isn't a lot of money leaving the markets. People are content to let their money remain in this particular security to see what happens.


A.) EMAs are in a bullish position -- the shorter are above the longer and all are moving higher.

B.) The last two days have seen some strong volume surges as more money comes into the market.

Tuesday, December 1, 2009

Today's Market


Find the trend. No really -- find the trend. Can't find it? You're not alone. Over the last month I have seen fewer and fewer charts that in any was resemble a chart that would provide any kind of trade. I'll post some tomorrow to illustrate the point. Essentially we're in an overbought market; there is little strong upside potential. Yet there just aren't that many bearish things happening -- or at least not enough to take a position lower. So we're stuck right now in a sideways/trendless market.

A Quick Note On Dubai

Last week everyone was a-flutter about Dubai. It was the signal of another round of massive debt problems; we were all going to hell.

Except this overlooked a few basic points. First -- the total debt involved was $80 billion. That's tiny. Then there is the issue of what was really going on -- a renegotiation of real estate debt. In essence, a borrower was saying "I want to renegotiate the terms of my loan."

How do I know this?

Dubai World began talks with banks to restructure $26 billion of debt, including $3.5 billion owed by property unit Nakheel, and said the remainder of its liabilities are on “a stable financial footing.”

Debt from subsidiaries including Infinity World Holding, Istithmar World and Ports & Free Zone World will be excluded from the negotiations, Dubai World, one of the emirate’s three main state-related holding companies, said in a statement. The cost to protect Dubai debt against default fell to the lowest since Nov. 25. Dubai’s main equity index dropped 6.6 percent.

Dubai is seeking to delay payments on less than half its $59 billion of liabilities, easing the potential damage to banks recovering from $1.7 trillion of losses and writedowns from the global crisis. Shares worldwide recovered some of the losses suffered since Dubai announced it would seek a “standstill” agreement on all of Dubai World’s debt as the Dow Jones Euro Stoxx 600 gained 1.2 percent and the MSCI Emerging Markets Index showed the first back-to-back gains in two weeks.


For anyone that's been around the markets for longer than a day, the real reason for this situation should not have been surprising. In fact, it happens all the time especially in this environment. Borrowers ask banks to rethink the terms of a loan. And they usually start by saying, "I can't pay this." Duh.

November ISM Manufacturing disappoints

- by New Deal democrat

The Institute for Supply Management's Manufacturing Index was reported this morning at 53.6. (This is a diffusion index; any reading above 50 indicates expansion. The higher the number above 50, the more the expansion). Just as importantly, the ISM Manufacturing Employment Index was reported at 50.8; and supplier deliveries fell to 55.7. These all indicate continued expansion, but at a slower pace. Only new orders and exports increased at a faster pace. Inventories did shrink, a good sign as to the need for manufacturers to increase production to restock.

In summary, this means that manufacturing continues to expand, but at a slightly slower pace. Employment in manufacturing is just barely positive. The Supplier deliveries component is an LEI, and this in conjunction with November consumer sentiment and most importantly housing permits means that it is likely that for the first time since March, November LEI will print negative.

It is instructive to review the ISM Manufacturing Index since its post-WW2 inception. From 1948 through 1983, the economy relied much more upon manufacturing than it does today. There were repeated booms and busts, as shown on this graph:

Note how often the index fell below 40 and sometimes to 30 in recessions, and how frequently in expansions thereafter it reached not just 60, but sometimes as high as 70.
Now take a look at the same graph from 1984 to the present, a period of 25 years:

During the 1991 and 2001 recessions, the index almost never fell below 40 -- but on the other hand, the index only exceeded 60 during 9 of the 300 months since 1984. This is a symptom of what was euphemistically called "The Great Moderation" (R.I.P.).

Now let's look at the employment index and compare it with the manufacturing index.

Here is the same graph from 1948 to 1984, but with employment added in red:

There are two things to notice: (1) the red line moves up across 50 (indicating generally that more employers are hiring than not) after the blue line, meaning that manufacturing expansion comes before jobs grow; and (2) jobs start to grow very quickly and as equally strongly after manufacturing does.
Next, here's the same comparison graph from 1984 to the present:

The red line still moves up after the blue one, but notice how long it takes to rise over 50, indicating expansion. Until now (note: today's number isn't included on the graph) -- the blue line moved above 50 in August, and red line followed only 2 months later in October.

Today's decline to 53.8 is still consistent with numbers which in the past had coincided with actual job growth (the inflection point being at 53.0), but has not been so this time, due to how hard retail and services employment were hit in this recession.

Finally, let's look at overtime hours in the manufacturing sector. Here again there has been a sharp rebound, although not by a long shot making up all the time lost since 2007:

Overtime has already risen .6 hours. It took 10 months after the 1991 expansion to rise that much - and a full 2 years after 2001!

Simply put, while manufacturing (including employment in manufacturing) is having a more robust recovery than in either 1992 or 2002 - primarily due to cutting too far during the recession, and export sales to foreigners whose standard of living unlike that of Americans is still improving - it still isn't really V shaped.

Just as importantly, in our domestic economy, manufacturing this year is the relative bright spot, while the US consumer continues to struggle as indicated by Invictus' post earlier this morning.

From Bonddad:

NDD labeled this a disappointment. I disagree for the following reasons:


On the chart notice the overall trend is still higher. In addition, notice the last four readings have clustered in positive (expansion) territory. So long as we have a reading above 50 we're expanding. That's good news.

Consider these points from the report


  • "Becoming concerned about the value of the U.S. dollar." (Apparel, Leather & Allied Products)
  • "Low value of the dollar driving commodity costs higher." (Food, Beverage & Tobacco Products)
  • "Demand from automotive manufacturers remains strong and building." (Fabricated Metal Products)
  • "Capital construction seems to be picking up, and we are seeing more jobs that are bid out." (Electrical Equipment, Appliances & Components)
  • "Steady increase in business." (Primary Metals)
While there is concern with commodity prices, also note that the last three comments deal with increased activity in three different areas. These comments are included because they are representative of what people are hearing. Simply put, this is more good news.

-----
A quick note in response by NDD:

I agree with Bonddad that in terms of the economy as a whole, there is no doubt this indicates continued expansion, at least for now. At this point, though, I am filtering all economic news through the prism of whether this will be a "jobless recovery" or not, and in that regard I am looking for a stronger "V" than this report shows.

Recovery?

Sunday's New York Times had two Page 1 above-the-fold stories that, in my opinion, cast serious doubts on what type of "recovery," for lack of a better word, we're in store for. First up is "Food Stamp Use Soars Across U.S., and Stigma Fades." The lede: "With food stamp use at record highs and climbing every month, a program once scorned as a failed welfare scheme now helps feed one in eight Americans and one in four children." As concerned as I've been for some time about what's going with our economy, these numbers startled even me. This story is a real eye-opener, and should be a wake-up call for us all.

The other noteworthy story appeared right beside the food stamp story: "U.S. To Pressure Mortgage Firms for Loan Relief." Lede: "The Obama administration on Monday plans to announce a campaign to pressure mortgage companies to reduce payments for many more troubled homeowners, as evidence mounts that a $75 billion taxpayer-financed effort aimed at stemming foreclosures is foundering."

We continue to see an ever-increasing number of homeowners underwater on their mortgages, and there's concern that another wave of defaults and/or foreclosures is headed our way in 2010. So you'll excuse my muted reaction to the fact that initial claims for unemployment insurance dropped into the mid-400k range. The government has stepped in and to fill the spending void created by the tightening of purse-strings on the part of both businesses and consumers. But there are underlying, structural issues at play here (like our collective debt-to-income ratio) that the government simply cannot address.

But let's shift gears and look at the stuff that matters in actually making the recession call.

Employment is still a mess, although we know it's less of a mess and a lagging indicator.

Industrial Production appears to have carved out at least (let's hope) a temporary bottom, and is one metric we can look at as a positive, notwithstanding that it's taken a whole lot of government largesse to get us there.

Real Income continues to go nowhere fast. With unemployment as high as it is and record slack in the labor market, it's hard to envision a scenario any time soon wherein workers will have any leverage to seek higher wages. Just too many people looking for work now to get any wage inflation.

Retail Sales are flatlining for some time now, and early reports (as of Sunday night) for Black Friday seem to indicate heavier foot traffic, a very modest increase in spending, and a laser-like focus on the part of the consumer for discounted goods.

In a nutshell, we may technically be out of recession by virtue of what will likely be two consecutive quarters of GDP growth (although frankly I think the NBER is going to ponder this recession-end call long and hard before they make it), but it is clear that tens of millions of Americans don't much care what economists or the NBER are -- or aren't -- calling it, as they're still feeling significant distress.

I started this post on Sunday night, and intended to finish it up on Monday night with some final thoughts. Little did I know that Paul Krugman would finish it for me in his Monday column:

"There’s a pervasive sense in Washington that nothing more can or should be done [to promote job growth], that we should just wait for the economic recovery to trickle down to workers.

"This is wrong and unacceptable.

"Yes, the recession is probably over in a technical sense, but that doesn’t mean that full employment is just around the corner. Historically, financial crises have typically been followed not just by severe recessions but by anemic recoveries; it’s usually years before unemployment declines to anything like normal levels."

And, finally, it looks like Black Friday sales might not have been up at all.


From Bonddad:

This piece in today's WSJ further exemplifies Invictus' point:

Mr. Crane is part of a growing group of underemployed -- people in part-time jobs who want full-time work or people in jobs that don't employ their skills. Since the recession began two years ago, the number of people involuntarily working part-time jobs has more than doubled to 9.3 million, according to the federal Bureau of Labor Statistics, the highest number on record.

The proliferation of underemployed could represent a profound reordering of the employment structure. Many people who had comfortable full-time jobs with benefits and advancement opportunities now are cobbling together smaller jobs often at lower pay, in a shift that economists say could become permanent for many individuals stuck in the cycle. Underemployment, along with unemployment, is widely seen as a force slowing the economic recovery.

The trend has been building for years, says Robert Reich, who served as labor secretary under President Bill Clinton and now is a professor of public policy at the University of California, Berkeley. "For decades, workers have been watching their salaries and benefits erode," says Mr. Reich, who took an 8% pay cut last week, along with the rest of the Berkeley faculty.

"We are subjecting millions of people to a standard of living below that which they could achieve if the economy were at full capacity," he says. "Underemployment means that many more people who can't spend as much as they otherwise would."


This is from today's research note from David Rosenberg:


Click for a larger image.

Adding, for the record: Rosie's piece wasn't published until hours after this post printed, lest anyone wonder who was ripping off whom.

Treasury Tuesdays


A.) There is only one point I want to make with this chart: according to the accumulation/distribution line, money is moving into the Treasury market. In addition, this movement has been pretty consistent over the last 6 months.


A.) Prices have been rallying since the earlier part of November. Prices are now approaching levels where we had a sell-off.

B.) The EMA picture is bullish: the shorter EMAs are above the longer EMAs, all the EMAs are moving higher and prices are above all the EMAs. However, it's important to remember that as prices rise yields decrease. At some point, yields won't be attractive.

C.) The MACD shows that momentum is increasing.

D.) Again note we're seeing a net inflow into the Treasury market.

Monday, November 30, 2009

Seasonal Adjustment Cherry Picking

I just wanted to make a very short post in regards to the issue New Deal Democrat brought up earlier today about seasonal adjustments and how many in the blogoshpere (and in print) are trying to use the unadjusted data to back up their claims that the economy is getting worse.

You can't have it both ways, either you adjust or you don't. And if you decide not to then you must accept that last month the unadjusted household survey showed an unemployment rate of 9.5% (instead of the adjusted 10.2%) and the establishment survey showed an unadjusted employment GAIN of 641,000 jobs. Sadly, neither of those numbers backed up the "economy is getting worse" claims and thus the same people who are clamoring to use the unadjusted jobless claims data are using the adjusted employment situation data. Seems kinda hypocritical to me, but who am I.

Sorry for the short post, but it had to be said.

Today's Market


Click for a larger image

A.) Notice the incredible range that trading took today. Prices touched all the major EMAs. Going down to the 50 day EMA is a big deal -- it indicates there is a lot of bearish sentiment out there right now. However, also note the prices formed a narrow candle.

About Seasonal Adjustment of Initial Jobless Claims

- by New Deal democrat

The canard that we should ignore Seasonally Adjusted Initial Jobless Claims in favor of the non-seasonally adjusted claims is back. This canard was least seen masquerading as a "black swan" back in July, when as now seasonally adjusted claims were falling because the non--seasonal number of claims was not rising as much as would normally be expected at that time of year.

Of course, none of the people telling us that "non-seasonally adjusted claims are the real claims" had a peep to say about the subject back in September when SA claims were running at 557,000, and NSA claims were at 466.267 (having fallen from 671,242 in early July). Were there any breathless headlines about 200,000 fewer "real" job losses? No, of course not. NSA claims only matter when they are higher (for seasonal reasons) than SA claims.

In the case of the blogger in July, his black swan quickly turned up dead in August as jobless claims resumed their fall. The Doomsayers now will just as surely be proven wrong come the end of January -- by which time they will ignore the data and simply move on to the next reason to predict Armageddon.

But given the sudden downdraft in SA claims to 466,000 last week, Prof. Brad DeLong not unreasonably asks if the seasonal adjustments are missing something. The long answer, I suppose, would have to be given by the BLS statisticians themselves (and they would probably respond to a query from Professor DeLong), but we can give a good approximate answer, because there are comparable past episodes that suggest a result.

In addition to this past July, the other episodes include the severe recessions of 1974 and 1982. Both of these deep recessions each featured two periods of large seasonal adjustments: once as they deepened and once again as they abated. Let's take a look at them.

First, here is a graph of both SA and NSA initial jobless claims during the 1974 recession:


The 1973-74 holiday season NSA spike appears to have sometimes - but not always - exaggerated the underlying trend upward. Similarly, the July 4 1975 spike seems to have briefly exaggerated the underlying trend downward. In neither case, however, did the SA reverse or hide the trend. It is almost impossible to read what if anything the 1974-75 holiday season NSA spike may have done, as it occurred right at the height of SA claims. If anything, in that case it may have slightly muted the trend - but again, the trend is unmistakable.

Next, here is a graph of both SA and NSA initial jobless claims during the 1982 recession:


While the 1981-82 holiday season NSA spike appears to have had no affect on the underlying trend, the 1982-83 spike appears to have amplified the downward trend, as briefly so did the July 4 1983 spike. Contrarily, the July 4 1982 spike seems to have muted the upward trend in claims, but only for a couple of weeks.

Similarly, the July 4 spike this past summer briefly amplified the downward trend in jobless claims - but my no means hid the trend.

It seems likely that last week's sudden SA decline in initial jobless claims similarly amplified the underlying downward trend -- but by no means hides any alleged "real" countertrend higher. Just as in August initial jobless claims never again were recorded at the 600,000+ level they had been in June, it seems likely that by the end of January, there will be a slight rebound in initial claims - but never again hitting the 500,000+ recorded in October.

In short: the official adjustments may sometimes overcompensate for seasonal spikes during periods of big recessions, but if anything exaggerate rather than hide the underlying trend.
__________

One final note: Prof. DeLong says that
[t]he worry is that not as many people are being laid off because there aren't as many people at work in construction and Christmas rush goods-producing jobs to be laid off, and that we should be at the very least cautious in interpreting one-week movements in unemployment insurance claims. Perhaps we want to argue that the labor market is improving in a sense, but we should be clear on what sense that improvement is. It is: in a normal year new weekly unemployment insurance claims rise by about 100,000 in the month before Thanksgiving; this year they have risen by only about 50,000. So things are getting better.

In the ultmate sense of jobs in the economy, I wonder if the Professor's worry isn't something of a wash. Yes, it's true that temporarily employed workers would have had paychecks for 8 or 12 or 16 weeks. But on the other hand, the failure to hire, let's say, 100,000 seasonal workers in July-September means that there were 100,000 less jobs recorded in the jobs survey those months, and 100,000 layoffs that will not correspondingly be counted in the November jobs survey. So in the payroll employment sense, the effect washes out.

Hysteria and Economic Blogs: Why They're Best Friends

Reading blogs that in any way write about economics has generally become an exercise in utter futility. According to most good news is either propagated by corporate whores who are blind to the realities around them or presented without considering "all" the facts. All government statistics and all economists are wrong -- unless they support or present a bearish viewpoint. Then the facts are treated as irrefutable truths presented by intellectual gods. And Goldman Sachs or the Federal Reserve manipulated everything to further some plot. In other words, ridiculous conspiracy theories are far more common than simple factually based analysis. How did things get so out of line?

There are several reasons. The first and most obvious is, "if it bleeds it leads." This is a saying from the days when newspapers were the predominant form of presenting and communicating information. Bloody pictures and sensationalistic headlines simply sold more newspapers. Translate that to the blogsphere and proclamations that the economy is going to hell will probably attract more readers. For reasons that I still don't understand, train wrecks are fun to watch. I'm reminded here of the album by Megadeath titled Peace Sells ... But Who's Buying?

Then there is the issue that many people in the blogsphere were right about the economy. Over the last three or so years, the only people who issued any warnings about the US' economic trajectory were blogs. At first they were the lunatic fringe, the voice in the wilderness. But after the crash happened more people tuned into blogs to get their financial information. Readership increased. But as the facts changed -- as we saw economic indicators start to bottom and then turn positive -- blogs did not change their opinions. The reasons here are two fold. First, many people made a name for themselves by being bearish. Changing their perception would mean giving up the quality that made them famous in the first place and thereby threaten their readership. The second is many people have a preconceived perspective -- that is, some people are fundamentally bearish regardless of the economic environment. Just as importantly, there are some who want things to be bad in order to create an environment where fundamental change is more likely. In other words, these people have a clear political agenda; they simply use economics to accomplish these ends. There is nothing wrong with this. But their bias should be understood and clearly made.

Third, there is the simple fact that people who write about the economy don't understand the economy. Here is a classic example. The unemployment rate is a lagging economic indicator. This means it goes down after the economy starts growing. The intuitive reason for this is simple. During a recession businesses cut production and lay people off. As the economy starts to grow, businesses first increase production and the hours that their existing work force works. Then, as demand picks up more and more, businesses start to hire again. However, reading the economic blogsphere it becomes very obvious that people writing about the economy don't know about this relationship. I'd love to tell you that unemployment will suddenly drop to 5% next quarter. But that's just not going to happen because that's not the way the economy works. Certain things happen at certain times in economic cycles.

And finally there are the conspiracy theories floating around the Internet. According to some the entire crash was orchestrated by Goldman Sachs. According to others, the Federal Reserve is part of a secret plot to do ... something. The reality is the economic meltdown was caused by numerous, inter-related events coming together in what is literally a once-in-a-lifetime perfect economic storm. It's going to take a long time to sort through the mess to figure out what went wrong and how all of those pieces fit together. In difficult times it's easy to scapegoat parties and institutions. The reality is it's a lot more complicated.

So, here's the reality of where we are. The economy is back from the brink; we're no longer falling off a cliff. Last quarter the economy grew by 2.8%. Yes, that was the result of the stimulus -- which is exactly what is supposed to happen at the end of a recession. However, we have a lot of work to do. The unemployment rate is still over 10.2%. Unemployment benefits must be increased and extended. And plans to get the unemployment rate down should be initiated.

Market Monday's


A.) The SPYs are forming a broadening top.

B.) The EMA picture is still bullish: the shorter EMAs are above the longer EMAs, and teh longer EMAs (20 and 50) are still moving higher. The 10 day EMA is moving lower, but this EMA is always more volatile.

C.) Momentum is decreasing.

D.) Notice that on the most recent top the A/D failed to make a new high. In other words, the same amount of volume/people are participating; we're not seeing a huge new rush of new investors. That's concerning.


A.) Leading up to the new high we see very weak candles.

B.) When prices hit new highs, we see very weak candles.

Bottom line: this is a very weak top to a market.

Friday, November 27, 2009

Weekly Indicators: "National Beached Whale Day" special edition!

- by New Deal democrat

Yesterday the turkeys were stuffed. Today, it's 300 million stuffed Americans who are imitating beached whales, so keep your belt unbuckled and check out how the high-frequency economic indicators fared last week.

Monthly indicators were mixed. The BEA revised 3rd Quarter GDP down to 2.8%, as expected, due primarily to an increase in imports. On the brighter side, Personal Consumption Expenditures - a measure which generally leads the business cycle - improved, as did personal income and real disposable income. The Case-Schiller house price index continued to show monthly improvement, and better Year over Year comparisons, although still down on that basis. New Home Sales for October also showed improvement. New orders for nondefense capital goods - a Leading Indicator - improved.

Consumer confidence improved from earlier this month, but still declined compared with the last several months. The Chicago Fed’s National Activity Index (CFNAI) stalled, declining slightly for the first time this year. Durable goods declined substantially, a complete surprise compared with expectations. The American Trucking Association also reported a small decline in October traffic, the second in a row. My co-blogger Silver Oz points out that some of the improvement in rail traffic might have to do with substitution effects due to the price of oil.

Now, the high-frequency weekly indicators:

The BLS reported initial jobless claims, seasonally adjusted, were 466,000. On an unadjusted basis they were totaled 543,926. By contrast, last year there were 609,138 initial claims.

The ICSC reported same store retail sales were unchanged from the previous week, and up 3.3% from a year ago, and said
ICSC Research now expects same-store sales for November to increase 4 percent to 6 percent as easy year over year comparisons will dominate the results.

Meanwhile, ShopperTrak

reported that year-over-year GAFO retail sales increased 0.9 percent for the week ending November 21 while sales rose a slight 0.2 percent versus the previous week ending November 14.

GAFO retail sales posted a minimal gain as the previous week contained the Veteran’s Day holiday which allowed consumers an extra day to spend – providing a rather difficult comparison. ShopperTrak noted that in many years the week following Veteran’s Day shows retail sales declines, so even a slight increase could be a good sign for the retail industry heading into Thanksgiving week and Black Friday....

Rail traffic continued to point to bullishness, as intermodal traffic remained stable, while baseline, cyclical, and total traffic went UP! It is particularly bullish that cyclical traffic went up this late in November. (Last week a commenter asked why I use this site vs. the AAR site. The short answer is that I am looking for high-frequency weekly data to see if the economic expansion is stalling or not, and the AAR's report is monthly. The two reports on a monthly basis appear to give virtually identical numbers).

The Daily Treasury Statement for November 24 showed $103.1 million paid withholding taxes so far this month compared with $111.3 on November 24 last year. This is still the best Year-over-Year comparison since March, and while it continues to show great stress in the jobs market as well as for state and local municipalities, it may be bottoming on an absolute basis now.

The Department of Energy's weekly report showed that demand for gasoline, after spending several weeks lower than one year ago, improved last week slightly compared with last year. Refinery stocks are running above average as they have all year.

The Price of Oil fell under $74 on the Dubai investment scare. Given that result, a couple of more middle eastern petrosheikhdoms getting into financial trouble might be kinda nice!

Wednesday, November 25, 2009

Happy Thanksgiving

To everyone,

We're signing off for the rest of the week. Have a good Thanksgiving.

We'll be back on Monday.

A Personal Note to the Doom and Gloomers from Bonddad

This is Bonddad. I mention that because there are four writers here: me, New Deal Democrat, Invictus and Silver Oz.

I (as in Bonddad) still believe the economy will grow in the 1%-2% range for the next few quarters. I have been saying that for the previous 6 months. Until I see otherwise, I will continue to hold to that prediction. In case you are wondering, there are several reasons for this.

1.) We are use to major quarter to quarter percent changes in PCEs. However, these do not need to grow at a fast pace to add to growth. If we see 1% PCE growth per quarter that will be sufficient for now.

2.) We still have a lot of stimulus money left to spend.

3.) We have a lot of inventories to rebuild.

4.) Exports are increasing. Yes, they are increasing at a slower rate than imports. But the point behind the increase in exports is it shows our trading partners are also growing. And contrary to the great myth of the econo-blogsphere, the US still manufactures a lot of stuff. We just do it with fewer people.

5.) The Fed is keeping rates very low.

I have yet to see any data which seriously undermines the above points.

Now, there are other writers who post here. I asked them to post here because they provide a solid counter-balance to my viewpoint. And unlike the vast majority of doom and gloomers, Silver Oz and Invictus provide thoughtful, well-researched and well-presented presented commentary. They both know the difference between the household and establishment job survey. And they're analysis does not jump around from point to point in an attempt to desperately hold onto a perspective. Instead, they rely on a dispassionate reading of data.

For those of you who are apparently having trouble with reading comprehension, everyone signs off on their work at the bottom of the page. So, before you assign a particular writer's viewpoint to me (or mine to somebody else), please look at the bottom of the page before doing so. It's really not that difficult.

Three steps forward, two steps back

- by New Deal democrat

In addition to the very good (relatively speaking of course) Initial Jobless Claims report this morning (see below), there were 4 other economic releases pushed up to today due to the Thanksgiving holiday. Two were good, two not so good.

Personal income and spending were both up:
Personal income increased $30.1 billion, or 0.2 percent, and disposable personal income (DPI)increased $45.7 billion, or 0.4 percent, in October, according to the Bureau of Economic Analysis.

Personal consumption expenditures (PCE) increased $68.3 billion, or 0.7 percent. In September, personal income increased $20.7 billion, or 0.2 percent, DPI increased $21.3 billion, or 0.2 percent, and PCE decreased $60.3 billion, or 0.6 percent, based on revised estimates.

Real disposable income increased 0.2 percent in October, compared with an increase of 0.1 percent in September. Real PCE increased 0.4 percent, in contrast to a decrease of 0.7 percent.

Shorter good news: consumers have more to spend, and they are spending it. This is necessary for job creation.

Additionally, New Home Sales rose 6.2 percent to an annual pace of 430,000, the highest level since September 2008, the Commerce Department said today in Washington. The median sales price fell 0.5 percent and the number of unsold homes reached a four-decade low.

On the other hand, the University of Michigan "index of consumer expectations fell 2.1 points to 66.5. This is an upward revision from the 63.7 reported in early November, which economists were expecting would be revised to 64.0." This is a leading economic indicator, and while better than most of this year, is still worse than September or October, so this will be a negative.

The other bad news was that orders for durable goods fell during October:
New orders for manufactured durable goods in
October decreased $1.0 billion or 0.6 percent to $166.2
billion, the U.S. Census Bureau announced today. This
was the second monthly decrease in the last three
months. This followed a 2.0 percent September
increase. Excluding transportation, new orders
decreased 1.3 percent. Excluding defense, new orders
increased 0.4 percent.

Despite that, the portion of the durable goods orders that is considered one of the 10 Leading Economic Indicators was up:
Nondefense new orders for capital goods in October
increased $0.6 billion or 1.2 percent to $54.6 billion.

There is some evidence (see, e.g., Invictus' post about the CMI, as well as the American Trucking Association's Index) that manufacturing may have stalled in October. We'll find out a lot more on Monday with the ISM report. Despite that, the majority of the reports are good.
----------------
P.S. While you are doing your annual post-Thanksgiving imitation of a beached whale on Friday, belly up to the computer, because I will be posting the regular "Weekly Indicators" then as usual.

Gold Hits New High


Click for a larger image

A.) In September and October, prices rose in a gentler manner. They'd hit a high and the round out the action. This allowed the market to absorb the gains.

B.) So far this month, gold is simply screaming higher.

C.) The RSI is telling us prices are a bit overbought, but

D.) The MACD is saying there is plenty of momentum and

E.) The A/D line is telling us people are still moving into the market.

Also note the EMA situation: the shorter EMAs are above the longer EMAs, all the EMAs are moving higher and prices are above all the EMAs.

This is still a very bullish chart.

Initial Jobless Claims: 466,000 !

- by New Deal democrat

The BLS reported that for the week ending Nov. 21, seasonally adjusted initial jobless claims were 466,000. Last week's number was revised to 501,000. This is the best showing since "Black September" 2008 when the economy nearly ground to a panicked halt.

The 4-week moving average was 496,500, a decrease of 16,500 from the previous week's revised average of 513,000. The 4 week seasonally adjusted moving average is now about 24% lower than the peak of 658,750 on April 3 of this year.

Unadjusted, there were 543,926 new claims, an increase of 68,080 from the week before, and well below the 609,138 initial claims in the same week last year. In unadjusted terms, this was the best new claims number, relative to normal seasonal adjustment, in well over a year.
Because the BLS normally surveys business payrolls in the week ending the 12th of the month, this decrease if it persists won't show up until the December jobs number. If it does, according to my previous research, this indicates that jobs are actually being added to the economy. In this position I am at odds with people like Berkeley Economics Professor Brad DeLong and Calculated Risk, who say that the claims number must drop ot 400,000 before jobs are added. A number like today's is why I said I have no problem being proven wrong, provided that it is done quickly!

In that regard, here is a repost of some numbers I posted two weeks ago:

At the time of the 501,250 4 week average of new jobless claims reading in 1990, payrolls lost 160,000 that month and 211,000 the next. In 2001, the new jobless claims high of 489,250 coincided with payroll losses of 325,000 that month and 292,000 the next. This year, we have already seen in August new jobless claims in the 560,000-570,000 range coinciding with a payroll loss of 151,000.

Treasury Tuesdays

Sorry for being late with this. This week has been very crazy with with are traveling.


A.) Prices broke a two month uptrend

B.) Prices are now in a new uptrend that is confirmed by

C.) A Rising MACD

D.) A very strong A/D line that indicates there is a strong demand for Treasuries and

E.) A rising RSI

I want to return to the strong A/D line as it indicates that even when the market was in a correction in October there was not a flight out of the Treasury market. That is very important considering the equity markets rallied for the first part of October. This tells us there is still an undercurrent of concern in the markets regarding the rally. I think part of this is end of the year, lock in your profits thinking. However, the equity rally is getting thinner -- meaning we're seeing the rally gravitate to the big cap stocks. This is a safety play.

Wednesday Commodities Round-Up


Click for a larger image

The main issue with the agricultural prices chart is there is no clear direction either way. There are three different consolidation patterns with no strong up or down move between them. The MACD and RSI confirm there is no momentum in either direction. The EMAs are all moving higher, but they are in a very tight pattern. Prices are simply bouncing from one consolidation pattern to the other.

The only key takeaway from this chart is the accumulation/distribution line which shows that volume is leaving this market.

Tuesday, November 24, 2009

FOMC Minutes in a Minute

The FOMC released the minutes from its Nov. 3-4 meetings. Lately these minutes have really had something for everyone. As for me, I picked up on the following:

"While these developments were positive, participants noted that it was not clear how much of the recent firming in final demand reflected the effects of temporary fiscal programs to support the auto and housing sectors, and some participants expressed concerns about the ability of the economy to generate a self-sustaining recovery without government support."

This, to me, encapsulates exactly where we are right now -- still on life support without a clue as to how the patient might fare if it were withdrawn.

And there was this:

"The weakness in labor market conditions remained an important concern to meeting participants, with unemployment expected to remain elevated for some time. Although the pace of job losses was moderating, the unusually large fraction of those who were working part time for economic reasons and the unusually low level of the average workweek pointed to only a gradual decline in the unemployment rate as the economic recovery proceeded. In addition, business contacts reported that they would be cautious in their hiring and would continue to aggressively seek cost savings in the absence of revenue growth. Indeed, participants expected that businesses would be able to meet any increases in demand in the near term by raising their employees’ hours and boosting productivity, thus delaying the need to add to their payrolls; this view was supported by aggregate data indicating rapid productivity growth in recent quarters."

In all, I think the FOMC minutes were another "things are less bad" report, but there are still very real concerns about the fragility of whatever recovery we may experience and the ease with which it might jump the tracks.

GDP Up 2.8%: Case Shiller Improves

I'm still traveling. Posting will be sporadic today and tomorrow. I think all of us will be taking Thursday and Friday off.


From the BEA:

Real gross domestic product -- the output of goods and services produced by labor and property located in the United States -- increased at an annual rate of 2.8 percent in the third quarter of 2009, (that is, from the second quarter to the third quarter), according to the "second" estimate released by the
Bureau of Economic Analysis. In the second quarter, real GDP decreased 0.7 percent.

The GDP estimate released today is based on more complete source data than were available for the "advance" estimate issued last month. In the advance estimate, the increase in real GDP was 3.5 percent (see "Revisions" on page 3).

The increase in real GDP in the third quarter primarily reflected positive contributions from personal consumption expenditures (PCE), exports, private inventory investment, federal government spending, and residential fixed investment that were partly offset by a negative contribution from nonresidential fixed investment. Imports, which are a subtraction in the calculation of GDP, increased.

The upturn in real GDP in the third quarter primarily reflected upturns in PCE, in private inventory investment, in exports, and in residential fixed investment and a smaller decrease in nonresidential fixed investment that were partly offset by an upturn in imports, a downturn in state and local government spending, and a deceleration in federal government spending.


A few points.

1.) Durable expenditures increased 20.1%. This is obviously the result of cash for clunkers. However, non-durable expenditures increased 1.7% and service expenditures increased 1%. In other words, we saw good increases in all the components of PCEs.

2.) Auto related activity added 1.45 to overall growth. This will of course be a lightening rod where people will argue this wasn't real growth because of the C4C program. To that I would respond with the following: at the end of every recession we typically see government incentives to increase activity. If memory serves, at the end of the last recession we saw an increase in the depreciation deduction as a way to increase business investment. In addition, government spending typically accounts for about 20% of overall economic growth. If you're going to jump on the C4C number, fine. But please revise all economic numbers to take out all government programs at all times simply to be consistent. Finally, I've noticed trend where people who argued for the stimulus are now arguing against the latest GDP number. So -- make up your mind please.

3.) Residential investment increased 19.5%. That's a good sign. However, remember the housing starts decreased last month at a 10% clip.

4.) Exports increased 17% and imports increased 20%. While this is an overall negative for the report (this combination subtracts from growth) it does indicate that we are growing.

So -- I'm still pleased.

The Case Shiller index is also showing better numbers. First, here is the chart that shows the year over year percentage change in prices:


Notice the rate of decline continues to decrease. In other words, we're moving in the right direction.

In addition:


About half of the large cities showed improvement. Also note the rate of decline in those cities that showed a decline was low.

Consumer confidence was flat:

Conference Board data show no significant improvement in consumer confidence during November. The headline index rose slightly to 49.5, still disappointing compared to August's 54.5 level that raised expectations at the time of significant second-half improvement. A key to those expectations was a rise in the expectations index toward 80, a level that right now seems out of reach with the index currently at 68.5. The present situation index remains near record lows, down 1 tenth to 21.0. The present assessment of the jobs market eroded slightly, with slightly more saying jobs are hard to get, now at 49.8 percent, and slightly fewer saying jobs are plentiful, at 3.2 percent. Inflation expectations are benign, unchanged for a third straight month. Today's report points to no improvement in the labor market and will not boost expectations for holiday retail sales.


Here is the chart:


Confidence has been moving sideways since April. This is largely the result of the jobs market. When unemployment continues to increase consumer's aren't going to be happy. The good news in this number is it hasn't crashed. The had news is it hasn't gone higher. Considering the unemployment rate this is probably about as good as we can expect.

So, the economy is still growing, the housing market is still improving but consumer's are still sanguine.

CFNAI -- Yellow Flag?

The Chicago Fed’s National Activity Index (CFNAI) printed yesterday, and the 3-month moving average – which is what the folks in Chicago tell us to look at – declined for the first time in 2009 (click through for larger image):

Though not necessarily cause for concern, the decline is certainly worth keeping an eye on. As one data point does not a trend make, I'll simply suggest this could be a yellow flag.

Below I have charted the 3-month moving average of CFNAI for the four recessions in which it breached –2.00 (in other words, nasty recessions).

The circular markers represent the points at which the NBER determined the recessions ended. The diamond marker is where the ‘79 - ‘80 recession bleeds into the ‘81 recession (the purple line from the point of that diamond coincides exactly with the light blue line at month one. Got it?).

Given the fact that some NBER metrics are still in decline (employment, real income), and that another (real retail sales) is arguably flat-lining, I’m not sure we’ll be seeing an end-of-recession call any time soon, and today’s downturn in the 3-month MA of CFNAI bears close watching in the months ahead.

Monday, November 23, 2009

Today's Market

This is Bonddad -- I'm traveling early tomorrow AM and am hopelessly behind on packing right now. I'll post some market stuff when I get to Cincinnati where my wife and I are spending Thanksgiving.

Geitner Leaving?

From The Street.com

Geithner's tenure has been rocky with lawmakers and the public, and recently he has appeared to have fallen out of favor again. Geithner has come under criticism for the Obama administration's regulatory overhaul, which he had a key role in developing, as well as the bailout of American International Group (AIG Quote) and its trading partners, like Goldman Sachs(GS Quote), during his position as New York Federal Reserve chief in the previous administration.

Last week, he got into a heated exchange with members of the Joint Economic Committee over the handling of the economic crisis, with Republican Rep. Kevin Brady of Texas asking whether he'd resign and saying "the public has lost all confidence in your ability to do your job."

It's unclear whether that will happen, but JPMorgan's Dimon may be at the frontline of possible successors, according to the New York Post. Dimon has had what appears to be a friendly relationship with regulators. He has also been quite vocal in his views about regulatory proposals, even if they don't necessarily benefit the industry or JPMorgan. For instance, while he has been critical of plans for a consumer protection agency, he recently wrote an op-ed in the Washington Post outlining his opposition to the notion of "too big to fail," despite the fact that his bank is considered just that.


I haven't written much about the Obama economic team. I don't think they're bad, but I also don't think they're great. But, I have to wonder how good anybody is when they're handed the worst financial situation in the last 60 years. While arm chair quarterbacks will of course point out all the mistakes they perceive, these are the same people who don't know the difference between the household and the establishment job survey. In other words, take the criticism with the largest grain of salt possible.

In addition, we're at a point where impatience is trumping reality. Considering the damage that the economy was in a year ago -- when there was a very real threat of a deflationary spiral like that the started the Great Depression -- we're actually doing OK. We saw growth last quarter (as have a number of countries), the manufacturing sector has rebounded, housing is bottoming, consumer spending is flat, and exports and imports are rising. The main issue is the unemployment rate which is a lagging indicator and for which there is unfortunately no silver bullet.

My political guess (for what it's worth) is someone will probably get fired largely to assuage anger and frustration. Who it is doesn't matter.

Unemployment and Establishment Jobs Growth at the State Level

From the BLS:

Regional and state unemployment rates were generally little changed or higher in October. Twenty-nine states and the District of Columbia recorded over-the-month unemployment rate increases, 13 states registered rate decreases, and 8 states had no rate change, the U.S. Bureau of Labor Statistics reported today. Over the year, jobless rates increased in all 50 states and the District of Columbia. The national unemployment rate rose to 10.2 percent in October, up 0.4 percentage point from September and 3.6 points from October 2008.

In October, nonfarm payroll employment increased in 28 states and the District of Columbia, decreased in 21 states, and remained unchanged in 1 state. The largest over-the-month increase in employment occurred in Texas (+41,700), followed by Michigan (+38,600), California (+25,700), North Carolina (+12,100), and Pennsylvania (+10,600). Michigan experienced the largest over-the-month percentage increase in employment (+1.0 percent), followed by the District of Columbia (+0.8 percent), Montana (+0.7 percent), Oklahoma (+0.6 percent), and Utah (+0.5 percent). The largest over-the-month decrease in employment occurred in New York (-15,300), followed by Florida (-8,500), Georgia (-7,500), Virginia (-7,100), and South Carolina (-5,800). Wyoming (-0.9 percent) experienced the largest over-the-month percentage decrease in employment, followed by Idaho and Nevada (-0.4 percent each), and South Carolina (-0.3 percent). Over the year, nonfarm employment decreased in all 50 states and increased in the District of Columbia. The largest over-the-year percentage decreases occurred in Arizona (-6.9 percent), Michigan (-6.4 percent), Nevada (-6.0 percent), Georgia (-5.6 percent), and Wyoming (-5.5 percent).


First, remember there are two employment surveys -- the establishment and the household; hence the divergence of results.

The unemployment numbers shouldn't surprise anyone. In last months employment report we saw an increase in the unemployment rate from 9.8% to 10.2%. However, the fact that a majority of states saw job growth is encouraging. Better yet, two states (California and Michigan) saw growth. These are states that have been hit hard by real estate (California) and the auto sector issues (Michigan).

Bottom line: the second part of the report is encouraging.

OECD Countries Emerge From Recession

From the WSJ:

The world's developed economies emerged from recession in the third quarter, as their combined gross domestic product grew for the first time since the first three months of 2008.

Figures released Monday by the Organization for Economic Cooperation and Development showed economic output in its 30 members during the three months to September was 0.8% higher than in the second quarter, although it was 3.3% lower in annual terms.

The OECD said the combined GDP of the Group of Seven largest developed economies rose 0.7% from the second quarter, but was also down 3.3% from a year earlier.

Market Monday's

Click for a larger image


The P&F chart really shows how large cap stocks have done. Above is a P&F chart of the OEF -- the ETF that tracks the S&P 100, or the biggest stocks in the S&P. Notice that there is a ton of volume on the up moves. Also note there is only one small down move of any significance over the last 7-8 months. This tells us the big cap stocks are the big movers of this market.


A.) The QQQQs broke a long-term uptrend at the end of September.

B.) Now prices are forming a broadening top pattern, indicating we may be reversing.


On the transports, notice

A.) Prices broke an uptrend at the end of September and

B.) Prices have tried to move through the 72-73 area three times without any success. Also notice we have a descending bottom.

Most importantly, as prices on the larger stocks have made new highs, the Transports have not confirmed.


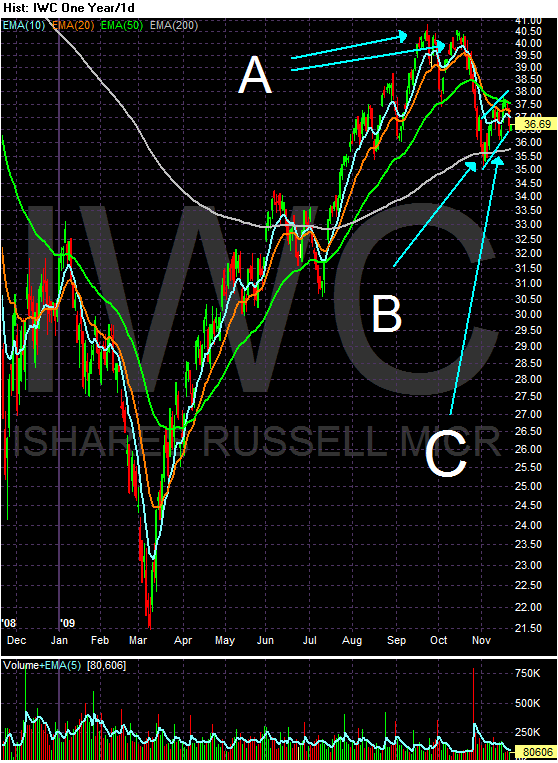
A.) The IWC (Microcap) formed a double top

B.) Prices fell to the 200 day EMA and then

C.) Formed an upward sloping channel.

So, we have a ton of money still going into the large cap stocks. However, the transports and micro-caps are not following suit. That tells us the rally is getting narrower which is not healthy.

As if on cue, the WSJ weighs in:

Signs of wariness are appearing in financial markets as investors worry that the end of the year could bring challenging trading conditions.

Last week saw a steep drop off in stock-market trading volume and a surge in demand for short-term government debt, indications that investors and financial institutions are growing cautious and retreating from riskier bets.

That defensive behavior is relatively common toward the end of the year. But this year it's happening earlier than usual. An uncommon confluence of events is driving the shift. The biggest catalyst is a reluctance among investors to take on new aggressive bets and avoid a late-year blow-up in their portfolios. Many are sitting on big gains after a 58% surge in the Dow Jones Industrial Average since early March and record returns from some corporate bonds.

"People who have booked some significant gains…are looking to take risk levels down," says Brian Fagen, co-head of Americas liquid market sales at Barclays Capital.