- by New Deal democrat
As we get towards the end of the month, the data from the important leading housing sector begins to be reported. This morning’s report on housing permits, starts, and construction continues the trend that has been in place for several years.
For the month, permits (gold in the graph below) increased 3,000 to 1.397 annualized, while the more noisy starts (blue) increased 58,000 to 1.321 annualized. But both of these are still very close to their post-pandemic lows. But the metric that is the least noisy of all and conveys the most signal, single family starts (red), decreased 33,000 to 866,000 annualized:
In the above graph, I normalized permits and single family permits to 100 as of their post-pandemic peaks. I did the same for starts, but used their peak three month average. Starts are down 23.9% from their peak, permits 27.2%, and single family permits 30.3%.
Is this sufficient to be recessionary? Here’s the historical pre-pandemic absolute levels of all three of the above metrics:
Downturns similar to current levels were in place at the beginning of most of the recessions in the past 50+ years, although in two cases - 1991 and the Great Recession - they were down 50% or more.
The significant decline in both measures of permits in the past several months is not a function of interest rates. Here’s an update of my graph showing the YoY change in mortgage rates (red) vs. the YoY% change in permits (blue):
Based on interest rates, permits (and subsequently starts) should be about the same as they were a year ago.
This is significant because in historically, the steep declines in permits and starts, generally more than 10% YoY, have persisted right up into recessions:
At present, permits are down -4.4% YoY, single family permits -8.4%, and the noisy starts only -0.4%.
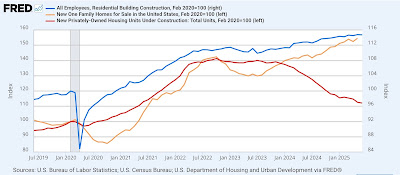
But as I have pointed out many times in the past several years, the best “real” measure of the economic impact of housing is units under construction (red in the graph below). This month they declined another 6,000 to 1.361 annualized, the lowest level in 4 years, and off 20.6% from their peak (graph is normalized to 100 as of just before the pandemic):
As I wrote one month ago, more often than not in the past, by the time units under construction had declined by this much, a recession had already begun. The only two exceptions were the late 1980s, where the pre-recession decline was -28.2%, and 2007, where the pre-recession decline was 25.6%.
The above graph also shows the final shoes to drop typically before recessions have started, houses for sale (gold) and residential construction employment (blue), in comparison with units under construction. Both of the two are either at or very close to their post-pandemic peaks. Here’s the historical YoY% look at all three measures:
I would expect all three series to turn negative YoY by the time a recession begins. Needless to say, that hasn’t happened yet. But because of the continuing downturn in actual construction, I do expect both of the last two measures to turn down. The only question is how long they can levitate before they do so. Once they do, I would expect their YoY decline to be similar to that already evidenced by housing units under construction - which, as per the above, is already at levels consistent with a recession on the horizon.


