- by New Deal democrat
To reiterate my Big Picture theme for this year, now that the supply chain tailwind has ended, will the effects of the 2022-23 Fed rate hikes drag the economy down towards recession at last, or will there be a “soft landing” (or no landing at all) instead, because interest rates have not increased in the past 12+ months? As a result, I am focusing most heavily on the leading sectors of manufacturing production and construction.
Last week and earlier this week I wrote of the importance of the downturn in building units under construction. Here it is compared with total (nominal) residential building construction spending, which has turned flat since last October:
Several weeks ago I also mentioned that the weighted average of the ISM manufacturing and services indexes had dipped below 50 (the equilibrium point between expansion and contraction, to 49.4, in April.
But there is at least one more data series which is flashing caution signals, and it is one that is fraught with political ramifications: real disposable personal income.
I had noticed this about a month ago, but didn’t write about it. I was prompted to look again when Dan Guild, who is an excellent source for reading polls, retweeted Carl Quintanilla of CNBC that “personal disposable income per household [is] at an all time high,” to the effect that Biden has a good economic record.
Here’s Quintanilla’s graph:
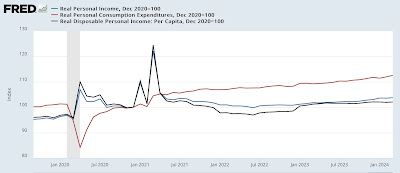
The most important thing to notice right off the bat is that this is *nominal* income. Below I show real personal spending (red), real personal income (blue), and real disposable personal income per capita (black), all normed to 100 as of December 2020, just before Biden took office:
All three are higher. In particular, we can see how the 2021 stimulus payments caused a real spike in spending, which has since subsided. But unlike Quintanilla’s graph, which shows nominal disposable income up over 10% since 2020, real income is up 3.7% since then, and real per capita income is only up 2.0%.
Further, personal savings amounted to $671 Million in April. With the exception of a number of month in 2022, that is the lowest level in just over 10 years:
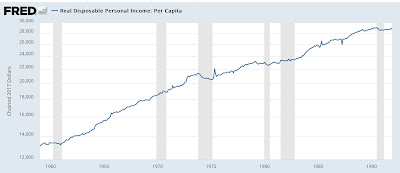
Now let’s see how that compares historically. Below I show real disposable personal income per capita since the inception of the series over 60 years ago:
Notice how flat the line is in the past year. This is similar to the flattening that has taken place before almost every recession since 1959 (1970 and 1973 being the exceptions).
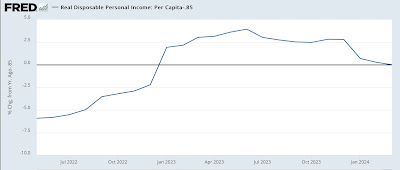
Let’s look at this same data YoY. First, here is the post-pandemic record, subtracting -0.85% so that the current level shows at the zero line:
Now let’s look at the past 60 years, similarly subtracting 0.85% so that equivalent situations also show at the zero line:
Before 2000, with only two exceptions (1987 and 1994), YoY gains in real disposable personal income per capita as low as they are now only occurred just before or during recessions. Since then, they have occurred more frequently, but mainly due to tax changes regarding Social Security withholding being changed for calendar years 2005 and 2013.
In other words, excepting tax law changes, gains in real disposable personal income per capita as low as they have been recently have generally been associated with economic downturns.
And, per Jame Surowiecki, especially in election years, they are particularly salient metrics forecasting presidential election outcomes. It will be updated next Friday.


