- by New Deal democrat
Let me tie this morning’s report on April existing home sales into my two last posts, which concerned the huge role that shelter prices, and the underlying shortfall in housing capacity, have in the continued elevation in overall consumer prices.
So let’s start by looking at the last 10 year history of existing home inventories [note: all graphs in this article are from the site Trading Economics, because the NAR only allows FRED to have the last 12 months’ data]:
Most importantly, note that even before the pandemic, housing inventory had been falling almost relentlessly YoY since 2014, the only exception being early 2019. the pandemic exacerbated this trend, which appears to have finally bottomed out in 2022-23. There in a nutshell is most of the story about the shortfall in housing in this country - which as I wrote yesterday means that the Fed’s rate hikes have probably been self-defeating, given the way shelter costs are measured in the CPI.
The good news, then, in this morning’s report is that inventory rose 9% (not seasonally adjusted) in April to 1.21 million units, and more importantly was up 16.3% YoY. This is nowhere near enough to resolve the issue, but at least it’s a solid start.
Unsurprisingly, existing home prices rose consistently since 2014, and accelerated when COVID hit and much of the market shut down. Similarly to the trajectory of the FHFA and Case Shiller repeat sales indexes, the median price for existing homes briefly turned negative in early 2023, troughing at -3.0% YoY in May. Thereafter YoY comparisons increased to a peak of higher by 5.7% in February, followed by 4.8% In March, and rebounding to a 5.6% YoY increase in April:
As I wrote yesterday, this affects that trajectory that the CPI’s shelter component “aims” for. Over the next 12 to 18 months, this suggests a much more gradual decline in that component to roughly 2.5% YoY - or roughly a 0.1% YoY deceleration in the CPI for shelter monthly over that time.
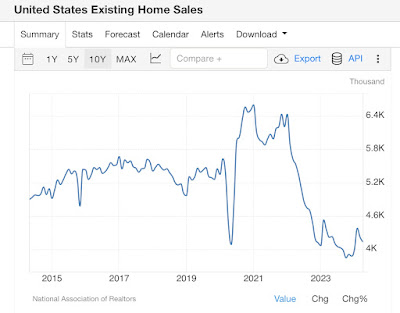
Finally, because unlike existing homeowners, house builders can vary square footage, amenities, lot sizes, and offer price and/or mortgage incentives to counteract the effect of interest rate hikes, new home sales have relatively speaking held up, while existing home sales have declined much more sharply. Specifically, even with the 1.9% month over month increase in existing home sales, and the same 1.9% increase YoY, existing home sales remain down -37.3% from their peak of 6.60 million units annualized at the beginning of 2021, at 4.14 million in April:
Existing home sales will likely remain range-bound at their recent levels until the Fed moves on interest rates, whenever that may be.
Which means that the chronic shortfall in housing is not going to be resolved any time in the immediate future.


