- by New Deal democrat
Let me start by quoting from my post yesterday:
“As to consumer prices, I am most interested in the relative weights of decelerating shelter increases (which as I have written many times are well-forecasted by the more current home price indexes and new rent indexes) vs. increasing gas prices
“I suspect that the increase in gas prices is going to outweigh the deceleration in fictitious shelter inflation. If so, that will mean that there is an actual slight increase in a headwind in consumer prices.”
Not only did this happen, but the big increase in energy prices overwhelmed the continued slow decline in fictitious shelter. Further, the fallout from distortions in motor vehicle production also continued.
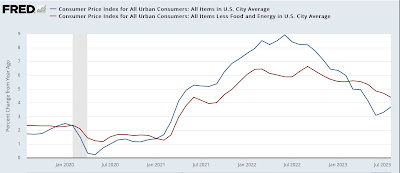
Let’s start with headline vs. core inflation. The former rose by 0.6% for the month and 3.7% YoY, up from 3.2% last month. The latter increased 0.3% for the month and 4.3% for the year, down from 4.7% last month:
As anticipated, the reason for the increase in headline inflation was a 5.6% monthly increase in energy (not shown), which is nevertheless still down -3.3% YoY.
But take out fictitious shelter, and prices are only up 1.9% YoY:
This is nevertheless higher than several months ago, when gas prices were at their most benign YoY.
Turning to fictitious shelter, it rose 0.3% for the month, including 0.4% for Owners Equivalent Rent. YoY shelter is up 7.6% and OER is up 7.3%, which continues its slow deceleration from 8.1% this past spring. In fact OER rose by the least monthly in two years:
Here is the update of OER compared with the Case Shiller and FHFA house price indexes (although I won’t show it, recall that apartment rent indexes are also now slightly *negative* YoY):
OER has been declining YoY at the leisurely pace of -0.2% per month, and the declines are going to continue. Still, if this rate of decline were to continue, it won’t return to 2% YoY for another 2 years, but I suspect there will be at least some acceleration in this rate of decline.
The other big distortion in inflation has been motor vehicles. I’ll discuss this further when industrial production is reported, but suffice it to say cumulative vehicle production since the pandemic struck is still probably about by about 10,000,000. While new vehicle prices rose 0.3% for the month, and are only up 2.9% YoY, and used vehicle prices declined once again, by -1.2% for the month, and are down -6.6% YoY, cumulatively they are up 20.5% and 39.9% since February 2020):
Because of the spike in vehicle prices, people have been holding on to their existing vehicles for longer and longer, and these older vehicles need more and more repairs. The gold line above shows that the costs of vehicle maintenance and repair is up 29.5% since February 2020. And it continues to rise at a rapid clip, up 1.1% in the last month alone and up 12.0% YoY (not shown). This is now the hottest single sector for inflation.
Since the Fed is focused on “sticky” prices, here’s what core, core minus shelter, and total less shelter look like YoY:
Excluding shelter, even “sticky” prices are only up 3.8%. Core “sticky” prices also excluding shelter are up 3.3%.
Finally, let’s update how inflation affected aggregate consumer wage income. Aggregate payrolls for nonsupervisory employees rose 0.5% in August, but since CPI rose 0.6%, real aggregate payrolls declined -0.1%, and are even with June. They remain up 2.0% YoY. Here’s what they look like normed to 100 one year ago:
This dynamic is what I have been concerned about. Namely, that wage gains will continue to decelerate, while consumer inflation as officially measured will at very least flatten if not re-accelerate with increasing gas prices. Once real aggregate payrolls peak, a recession has typically followed in about 6 months, coincident with their turning negative YoY. Additionally, any re-acceleration of CPI will give Fed hawks more ammunition to demand further rate hikes, which won’t even have their full effect for another year.


