- by New Deal democrat
Initial jobless claims is one of the few remaining positive short leading indicators. But as I’ve noted for the past several weeks, the trend is troublesome.
This week initial claims rose 4,000 to 230,000, and the 4 week moving average rose 1,000, also to 230,000. Continuing claims one week previous rose 62,000 to 1.671 million:
Initial claims aren’t even as high as they were in August, but the less volatile (and less leading) continuing claims rose to the highest level since February.
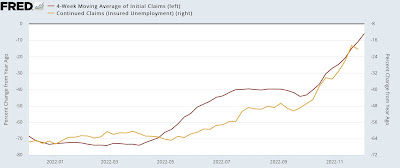
If their current trend continues, all 3 could be higher YoY within two weeks.
Back in 2019, surveying the entire history of claims, I wrote that
“Initial jobless claims are an important short leading indicator, typically turning up 3-9 months before a recession. A problem is the necessity of filtering out signal from noise.There are two ways I measure claims in order to do so: (1) how much has the less noisy four week average risen from its low? And (2) have initial claims, averaged monthly, turned higher YoY?
“Let’s start with the first measure. A 10% increase off of an interim low in claims is not unusual, and has happened every year or two for the entire 50+ year period that records have been kept. By the time they are up 15% from their bottom, not only is it almost always a signal of recession, but frequently the recession is imminent.
“….
“ In any given expansion, there is usually at least one month where claims are higher YoY. But if that happens for two months in a row, more often than not it has signaled that a recession is approaching.”
Last week I wrote something similar:
“In the past, if the 4 week average has been more than 5% higher YoY for any significant period of time, and less reliably, if the slightly lagging continuing claims were higher YoY, a recession was almost always close at hand.”
Here’s what the YoY% change in both the 4 week average and continuing claims look like historically:
At 230,000, the. 4 week average of initial claims is 35% higher than its low of 170,500 set in April. But they are still -5.8% lower YoY, and continuing claims are -20.4% lower YoY:
As I wrote above, if the current trend continues, that could change before the end of this month, warranting a yellow caution flag. But because the series is sufficiently noisy, even then I would want to see several months of ongoing weakness before hoisting any red flag, and even the note the false positives at least once during each decade between 1970 and 2010.


