- by New Deal democrat
Prof. Paul Krugman and Nate Silver got into a dust-up earlier this week about why so many voters seem to have soured on the Democrats. So that you don’t have to go digging through all the Twitter detritus, Alternet has a good write-up copying all the relevant tweets. (Apparently the two have been at odds at least since 2014, when Five Thirty Eight left The NY Times and went to ESPN; I do not know nor do I care who dissed whom first back then).
The dust-up started when Nate wrote:
Krugman responded:
Since how the average American is doing in the economy is something I’ve been obsessively following for about 20 years, and I’ve also spent a fair amount of time parsing what economic indicators appear to best forecast at least Presidential votes, I think I’m qualified to weigh in.
Sorry, Professor, I’m on Team Nate on this.
Yes, Nate Silver shouldn’t have said “some folks on here” without being able to back it up with at least one specific (Note: I’m not going to go digging for that either, but my recollection is that I have read tweets from partisans to the effect that “Actually the Economy is Great;” I think one such partisan may have been Dana Houle). But the *substance* of Nate’s criticism - that voters do not think the economy is going so great - is in my opinion on target. Krugman “straw man” criticism is actually something of a “straw man” itself, failing to come to grips with the issue.
First of all, I should point out that, as to Presidential elections, Silver himself did a regression on some 50 economic indicators to attempt to figure out which ones best predicted *Presidential* outcomes. But to my knowledge no such systematic review has taken place with regard to Congressional and State elections. So take the Presidential formula with a hefty grain of salt.
If this were a Presidential election year, the decline in the unemployment rate would be good news for Biden, because the unemployment rate is one of the best predictors of incumbent vs. insurgent Presidential vote. I was also able to determine that real retail sales were also a very good indicator. James Surowiecki has calculated that changes in real disposable personal income during the election year is also predictive. Finally, economists at the London School of Economics have calculated that the Index of Leading Economic Indicators through the first quarter of a Presidential election year work well.
The news with respect to the above statistics is mixed. The unemployment rate is clearly down, the index of leading indicators is still positive but has decelerated sharply through February, and real retail sales per capita and real disposable personal income are down.
Perhaps more importantly, as shown in the graph below, since last May (when the big stimulus effect first wore off), on a per capita basis, real personal income is down -1.6%, real *disposable* personal income is down -2.6%, real average nonsupervisory wages are down -1.9%, and real retail sales per capita are only up 0.1%:
These are averages; in other words, while median measures would be better if we had them, taking the vast mass of people together, about half of all of them have sustained *real* economic losses in the past 9 months since the stimulus wore off, and they are reining in their spending.
By contrast, only 1.8% of the population in the entire age bracket from 16 through 65 who were not employed as of last May has gotten a job:
In other words, 1.8% have benefitted from less unemployment, while somewhere near 50% (again, we don’t have median measures so this is the best we can do) have sustained losses. On top of that, since some stimulus benefits have ended (the $3000 child care credit comes to mind), this has created a hole in lots of families’ wallets, and the evidence shows they are blaming Democrats (thank you, Manchin and Sinema).
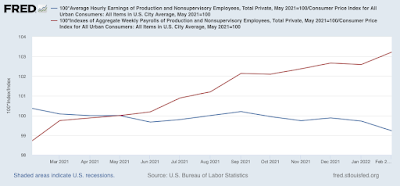
The difference between how “the economy” is doing, vs. how average families are doing, is best shown by comparing real *aggregate* payrolls, up 3.0% since last May, vs. real *average* wages:
In the aggregate, even after inflation payrolls are up 3.0%. But the average worker’s hourly wage is down -0.8%. The economy has been booming; the average worker’s wallet, not so much.
So I side with Nate Silver.


