- by New Deal democrat
My longform housing market analysis is almost complete, and will probably get posted later today or tomorrow at Seeking Alpha. I’ll post a link here once that is done.
In the meantime, consider the following. The Case Shiller national house price index had another sharp increase in February, and is now up 11.2% YoY, the highest rate since the days of the housing bubble in 2002 (green in the graph below):
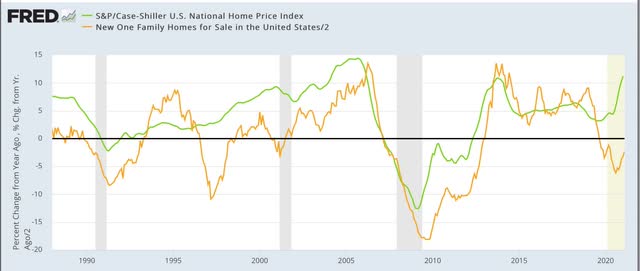
Meanwhile look at inventory (gold). In absolute terms, the seasonally adjusted inventory of new homes for sale bottomed last August and October. Last August inventory was down -12.3% YoY. As of last month, it was only down -4.6% YoY. At this rate of change, it will be *up* YoY by about May.
Multiple offers over asking prices within days if not hours are now becoming common. We are experiencing the hottest “seller’s market” in housing since the bubble.
A sharp break in house prices and inventory levels is likely to be the biggest “surprise” in the housing market between now and Labor Day.