- by New Deal democrat
Yesterday I wrote that the financial and production sides of the economy still looked very positive, and that today’s retail sales number would be especially important.
Well, they were very positive, clocking in at up 1.7% month over month in October. Even after inflation, “real” retail sales were up 0.7%. September was unrevised. Although real retail sales are down -2.2% from their April peak, they are +13.5% higher than they were just before the pandemic hit, and 4.9% higher than January of this year:
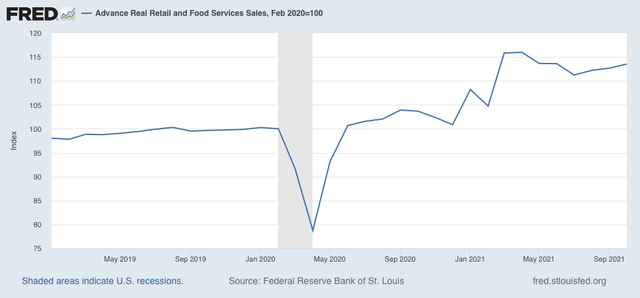
In September I wrote that ”while the recent decline from April is consistent with a slowing economy ahead, if sales stabilize here I don’t see this as a harbinger of an actual downturn.” That still looks correct, particularly as real retail sales are up over 2% since then, and 9.5% higher YoY.
How extreme is that? The below graph subtracts 9.5% YoY growth from retail sales from 1948 through 2019:
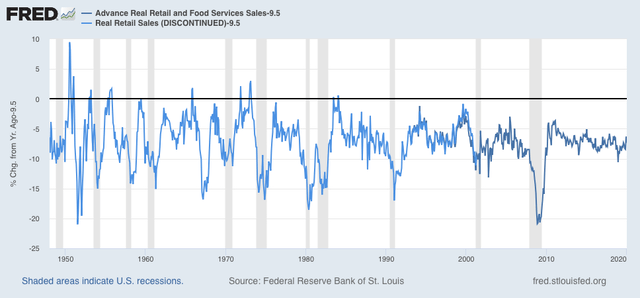
With the exception of 2 months in 1983 and 1984, real retail sales haven’t been this strong since the early 1970s! That’s the last time the US had such a worker-favorable economy.
This also explains a great part of the supply chain bottleneck, since it is incapable of handling such a sudden jump in consumer demand. Here’s a graph I came across a couple of weeks ago showing activity at the two big California port facilities:
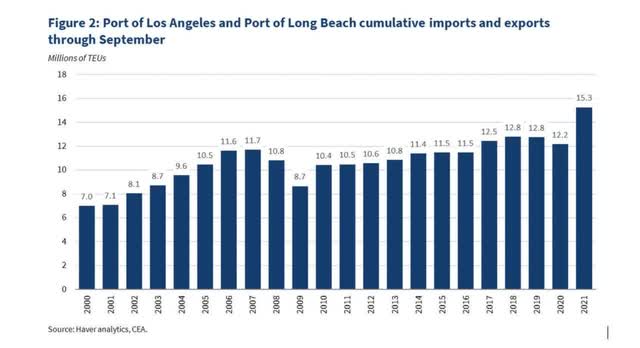
In other words, even though the ports are processing record volumes, they *still* can’t keep up with the increased import demand.
Now let’s turn to employment, because real retail sales are also a good short leading indicator for jobs.
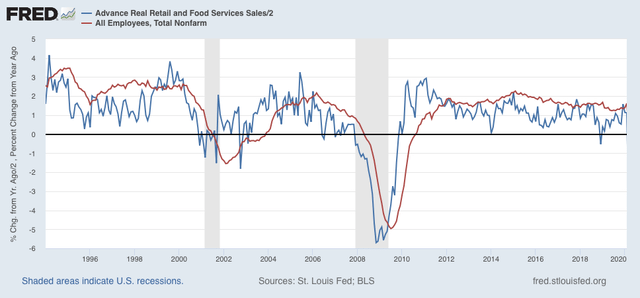
As I have written many times over the past 10+ years, real retail sales YoY/2 has a good record of leading jobs YoY with a lead time of about 3 to 6 months. That’s because demand for goods and services leads for the need to hire employees to fill that demand. The exceptions have been right after the 2001 and 2008 recessions, when it took jobs longer to catch up, as shown in the graph below, which takes us up to February 2020:
Now here is the same graph since just before the onset of the pandemic. Note the scale is much larger due to the huge downturn during the lockdowns and the comparisons one year later:
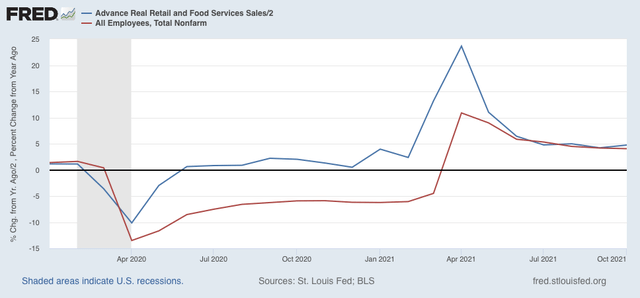
Last month I argued that, despite the lackluster initial jobs reports for August and September, this “argues that we can expect jobs reports in the next few months to average out about even with those from one year ago, which averaged about 500,000 per month.”
Well, two weeks ago those months were revised well higher, and October came in at 531,000 jobs added - which means that job growth indeed has continued to average about 500,000 per month. And should continue to do so in the next few months.