- by New Deal democrat
Here is the update through yesterday (May 5).
As usual, significant developments are in italics. The bottom line is the same as several days ago: trends in new infections, deaths, and in testing have all turned positive - if not positive enough. But the good news remains primarily a NY story.
I have discontinued giving the % increases day/day in infections and deaths. They were included when important to determine if the US was “bending the curve.” The two. issues now are (1) whether any States (beyond the least populated rural or isolated States) can “crush the curve;” and, sadly, (2) whether those States that have “reopened” see a renewed increase in the growth of cases and deaths - and whether customers in those States largely stay away from the reopened businesses.
Number of new and total reported Infections (from Johns Hopkins via arcgis.com and 91-divoc.com):
- Number: 23,841, total 1,204,475 (vs. day/day high of +36,161 on April 24)
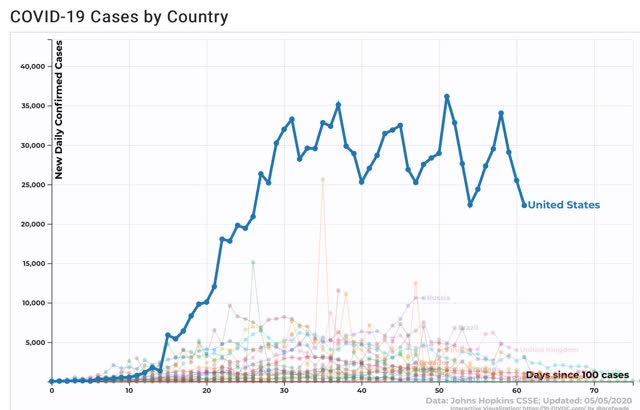
There has been a significant decrease in the number of new cases in the US. The US nevertheless has the worst record in the world, by far.
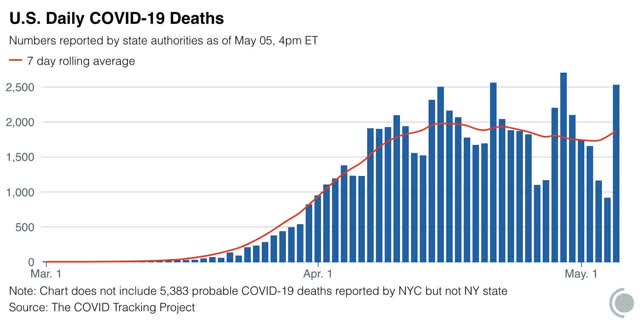
Number of deaths and infections and rate of increase of testing (from COVID Tracking Project)
- ***Number of deaths: 2,527, total 65,307 (vs. day/day peak of +2,700 April 29)
- Seven day average of deaths:1,826 (vs. 2,058 peak on April 21)
-
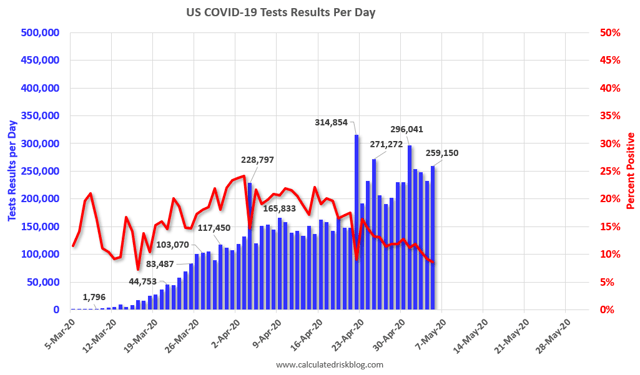
- Number of tests: 259,150 (vs. 305,118 daily peak on May 1*)
- Ratio of positive tests to total: 11.6:1 (new high - target is 15:1)
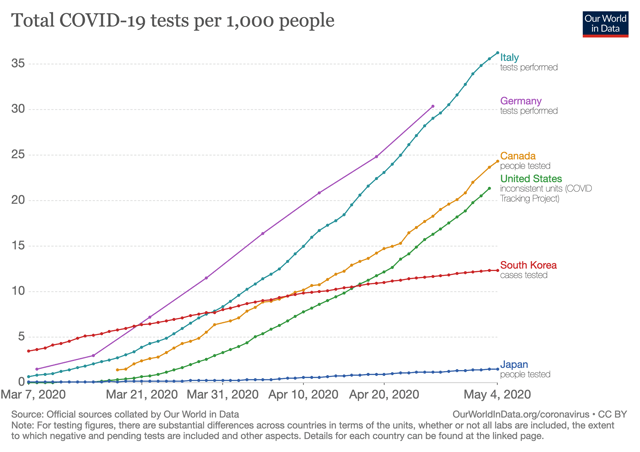
- Below is a good graph comparing cumulative testing rates for the US vs. other European and Asian countries. Note that for Germany and Italy, cases started to decline once the rate hit 0.5% of the population per week. In the past week, the US has tested slightly over 0.5% of its population:
In the past three weeks, as shown in the graph above, the percentage of positive to total tests has declined from about 20% to 9%. At this rate, within 10 days we should be at 6%, which, based on the history of South Korea, lockdowns can begin to be judiciously lifted and a thoroughgoing regimen of “test, trace, and isolate” can be begun.
*ex.-Calif clearing its backlog
Summary for May 6
- The number of daily new infections, adjusted for testing, appears to have peaked two to three weeks ago.
- The number of daily new deaths also appears to have peaked about 2 weeks ago.
- The trend number of daily tests has improved dramatically in the past 2 weeks from an average of about 150,000-160,000 to about 250,000. Better still, for the last 10 days, new infections have declined, even with higher testing - a very positive sign.
- My personal suspicion remains that the actual number of total infections in the US is about 5x the official number, or roughly 6 million at present. In NY, serological studies suggested that the actual number is about 10x larger than diagnosed infections, which would be about 12 million nationwide.
- Comparing those States which remain in lockdown vs. those that are “reopening” is the main task going forward.