- by New Deal democrat
No data today, so while we are waiting for new home sales tomorrow, let me step back a little and give you an updated overview of my thinking.
It boils down to: the short term forecast — over the next 4 to 8 months — looks flat at best, and could develop into an actual downturn. The longer term — over one year out — looks more positive.
Let me start with the positive long term forecast first.
Long term interest rates have gone down significantly. Most importantly, mortgage rates have declined from about 5% to 4%. As a result, overall housing permits and starts, new single family home sales (which will be updated tomorrow) and through last Friday’s release of existing home sales have all turned higher:

The last big holdout, single family permits, probably made a bottom in April.
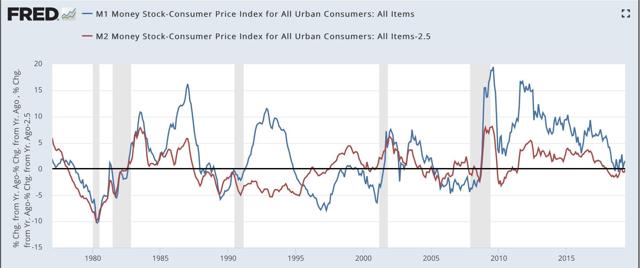
But they aren’t the only long leading indicators to have improved. So has real money supply. Here’s the long term view:
And here’s a close-up of the last few years:
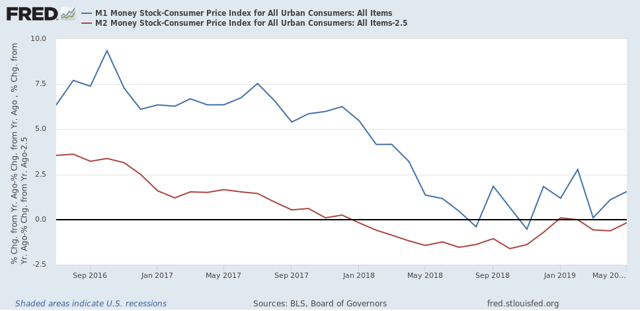
Last year real M2 (minus 2.5%) turned negative, and for several months, so did real M1. Both are now positive again. Note that the closest analogues are 1988 and 2002 - neither of which times coincided with a subsequent recession.
So while the inverted yield curve is a real concern, it isn’t being confirmed by a number of other very valid indicators over the past six months.
So while the inverted yield curve is a real concern, it isn’t being confirmed by a number of other very valid indicators over the past six months.
Now let’s contrast with the short term forecast. The second half of last year, especially Q4, coincided with the greatest number of the long leading indicators turning south. That means we are heading into treacherous waters in the near term.
One “quick and dirty” way to look at the short leading indicators is simply to compare stock prices via the S&P 500 (blue in the graph below) vs. initial jobless claims (red, inverted):
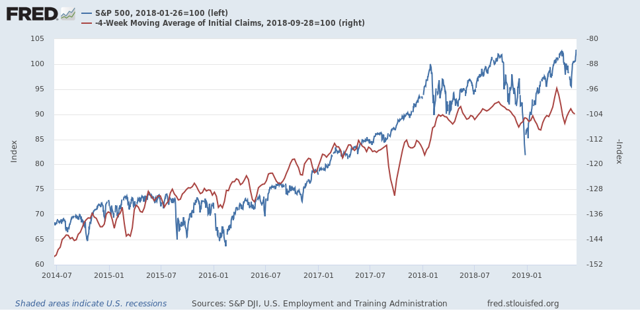
In the above graph, stock prices are normed to 100 as of the January 2018 high. Note they have only improved by a little over 3% as of their most recent highs last week. Meanwhile initial claims only improved over their September 2018 lows (shown as a peak) during the three weeks before Easter this year, probably due to residual seasonality.
In short, short leading indicators have been going basically sideways. And as I’ve noted repeatedly in the last few months, the leading employment sectors of manufacturing, residential construction, and temp jobs have all turned flat or downward since January. Whether there’s a recession or not in the short term probably depends on the intensity of Trump’s trade wars, and how much businesses, and business planning, suffers for them.
So if my writing on the economy seems schizoid, it’s because the dour near term forecast depends on the actions of a narcissist who thrives on chaos, while the longer term is being leavened by other very leading sectors.