- by New Deal democrat
Retail sales are one of my favorite indicators, because in real terms they can tell us so much about the present, near term forecast, and longer term forecast for the economy.
This morning retail sales for April were down, -0.2%. Since consumer inflation increased by +0.3%, real retail sales fell by -0.5%, a poor result that nevertheless did not reverse the extremely strong March showing of +1.3% in real terms. Last month I noted that sales were still slightly below their peak of five months prior, and YoY real sales remained in a downshift. Needless to say, April’s result did not help matters.
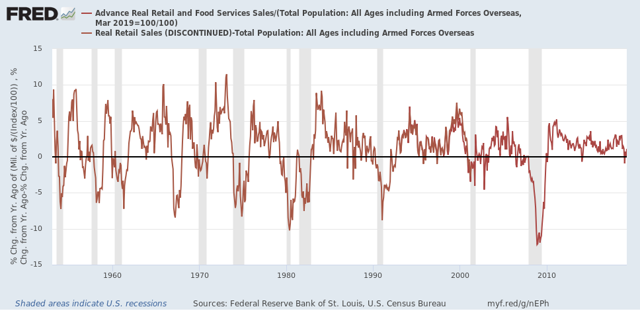
Below are both the long term and short term graph of real retails sales:
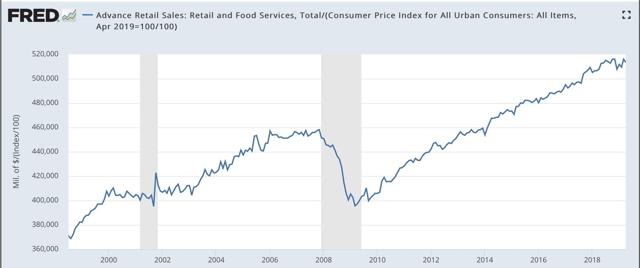
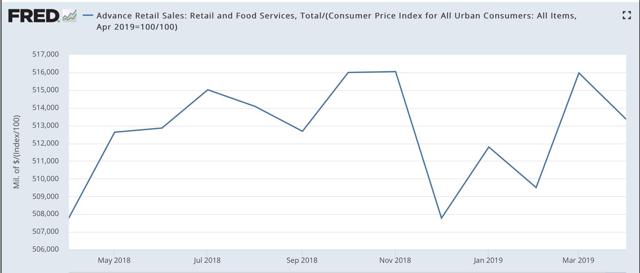
Note that real retail sales turned flat for about a year before both of the last two recessions. Since late last year we’ve hit the biggest soft patch since 2013. In fact, we’re only up about +0.2% total in the past 11 months. As revised, both of these last made new highs five months ago in last November.
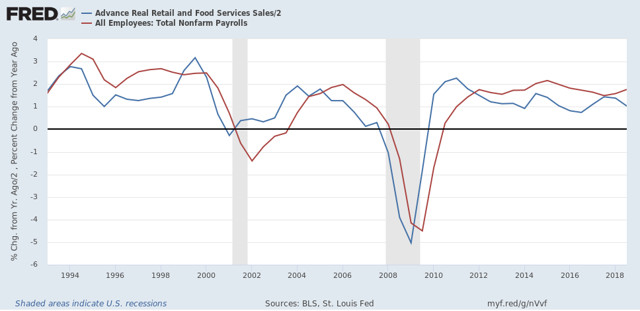
Next, although the relationship is noisy, because real retail sales measured YoY tend to lead employment (red in the graph below) by a number of months, here is that relationship for the past 25 years. Normally I show this quarterly, but this time I’d like to show it in 6 month intervals, that really shows the leading relationship:
Now here is the monthly close-up of the last six years. You can see that it is much noisier, but helps us pick out the turning points:
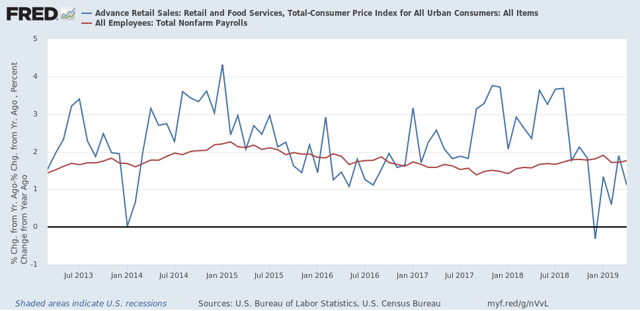
The lead times are somewhat variable, and notably most recently while sales roughed in mid-2016, employment did not similarly trough until a full 12 months later. We are currently 8 months into a big downshifting in YoY sales, so I still fully expect employment as measured in the monthly jobs report to slow down noticeably shortly.
The lead times are somewhat variable, and notably most recently while sales roughed in mid-2016, employment did not similarly trough until a full 12 months later. We are currently 8 months into a big downshifting in YoY sales, so I still fully expect employment as measured in the monthly jobs report to slow down noticeably shortly.
Finally, real retail sales per capita is a long leading indicator. In particular it has turned down a full year before either of the past two recessions:
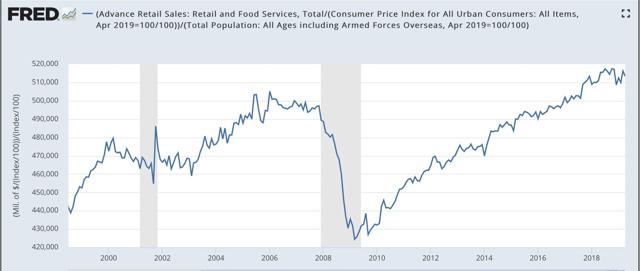
Here is the close-up of the past 18 months:

Measured per capita, real retail sales peaked 6 months ago, and are down compared with 11 months ago. Unless there are substantial upward revisions, or a good report next month, this metric is going negative YoY.
Why is that significant? Here are real retail sales per capita YoY, going all the way back to 1948:
In the last 70 years, this measure has always turned negative at least shortly before a recession has begun. There are no false negatives. While there are about a dozen false positives for a single negative month, there are only four false positives for consecutive negative readings — 1966, 1995, 2002, and early 2006. Recently there has only been one month - last December - where this was negative YoY, so this series bears close watching to see if it turns negative again, and for longer than one month.
To sum up, real retail sales for April weren’t just a weak coincident data point, bu they further point to weakness in the near term for employment gains, and are signaling negative for the long term depending on whether the poor readings remain durable for the next several months.