- by New Deal democrat
Let’s take a look at a relationship I haven’t updated in awhile: initial jobless claims vs. the unemployment rate.
There used to be a site called “thumbcharts.com” that published a bunch of graphs, including one that showed that, measured on a 6 month rolling average basis, the change in initial jobless claims anticipated a similar move by the unemployment rate. Here’s one that I made use of about five years ago:
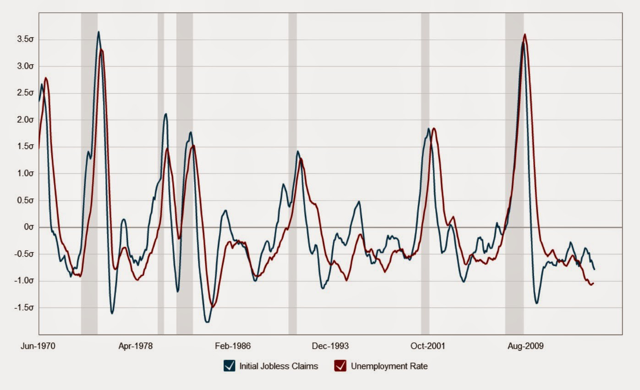
Certainly not perfect on a monthly basis, but over a longer timeframe, very persuasive.
Here’s what this looks like over the past 50+ years measured by their absolute levels:
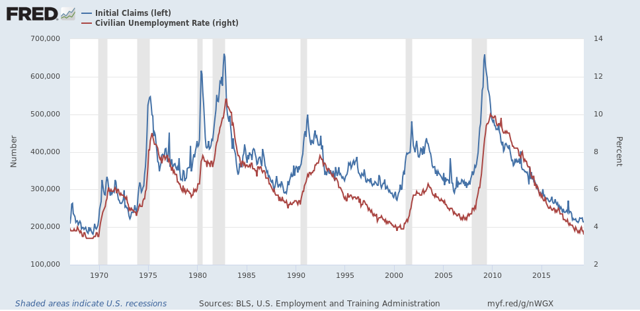
Again, it’s pretty clear that initial claims does lead the unemployment rate by several months with some variability.
Here’s a close-up of that metric over the past five years (with initial claims averaged monthly for comparability):
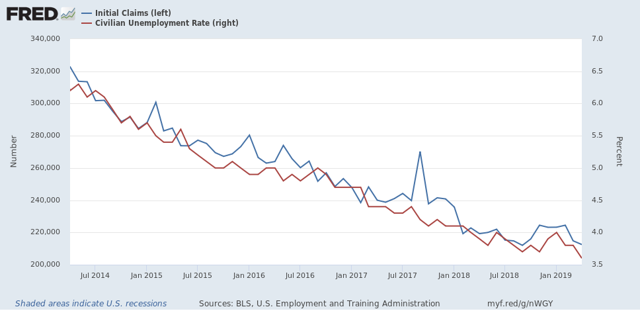
Interestingly, in the past year, the unemployment rate has moved in tandem with claims without any appreciable delay.
And here is the same data expressed as YoY% changes, first over the long term:
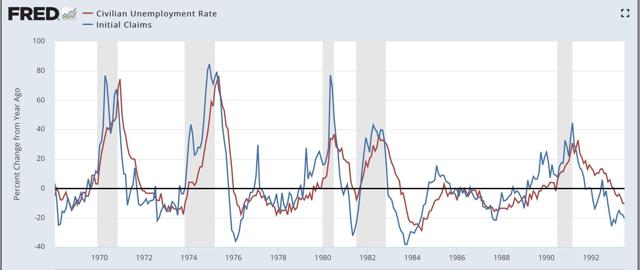
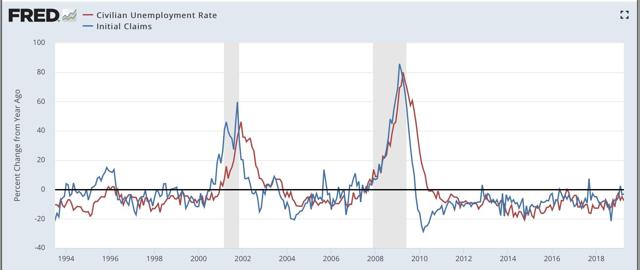
And now a close-up on the past six years:
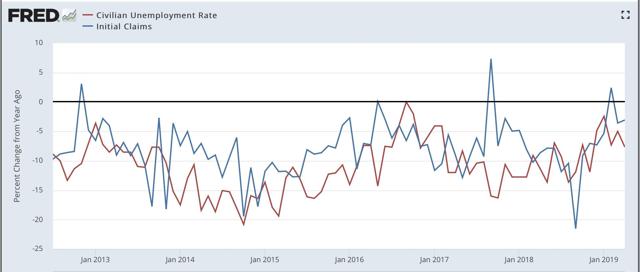
Again, lots of noise in any single month’s comparison, but averaged over a longer period of time, the leading/lagging relationship is pretty clear, and it is also pretty clear that the trend in the YoY% change in initial claims has been rising (i.e., is less positive) since last September.
With the exception of the three weeks right before Easter, initial claims have not declined significantly since February 2018. Leaving those aside, the biggest YoY% decline on a two week average basis was -3.5%. That suggests that the unemployment rate ought to be converging on about 3.8% (.965 x 4.0 = 3.86; .965 x 3.9 = 3.76). In any event, since initial claims have risen significantly in the four weeks since Easter, I do not expect the 3.6% unemployment rate to last, although I am not expecting it to rise above 3.9% anytime soon.