- by New Deal democrat
The headlines in this morning’s residential construction report were certainly positive: permits increased by 0.6% and starts by 5.7% m/m. I’ve been looking for a bottom in housing, based on lower mortgage rates, so this is good news because the bottom in overall permits and starts on a monthly basis may have been reached.
But the news was not nearly so positive underneath.
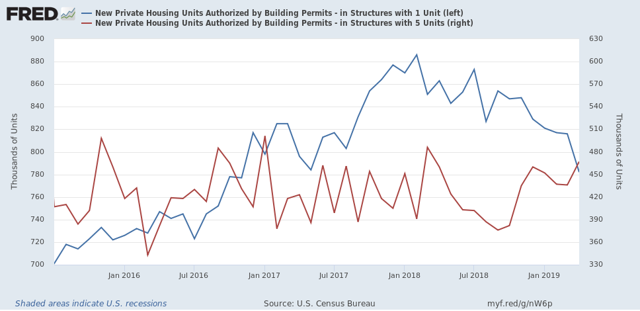
As I have repeated many times, single family permits are my favorite metric, because permits lead starts, and single family permits are the least volatile of any of the measures. Well, single family permits sank to a two and half year low, at 782,000. This is -11.7% off their February 2018 high:
The least that single family permits have fallen prior to a recession in the past 50+ years was prior to the 2001 recession, at -12.5%, so we are very close to that threshold.
The saving grace in this number is that permits for multi-family dwellings have increased at the same time. This is socially beneficial, because these are more affordable for households unable to afford single family housing, which had become very unaffordable up until a few months ago. It also ameliorates some of the negative economic impact of the decline in single family construction. By contrast, just prior to the 2001 recession, multi-unit construction declined by -34% as well.
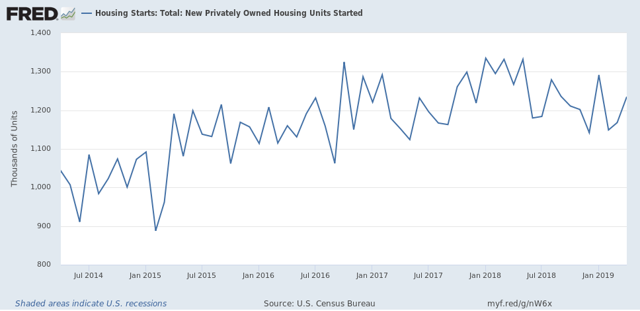
Next, housing starts are much more volatile than permits. And despite the great monthly improvement in starts, the three month moving average is also at a new 1+ year low:
Because starts represent actual economic activity, that this has continued to decline argues that the long leading effects of housing on the economy are going to continue to be negative for perhaps another year. And by the way, lest you think I am cherry-picking, the metrics above are the same ones I have been checking, month after month after month for years.
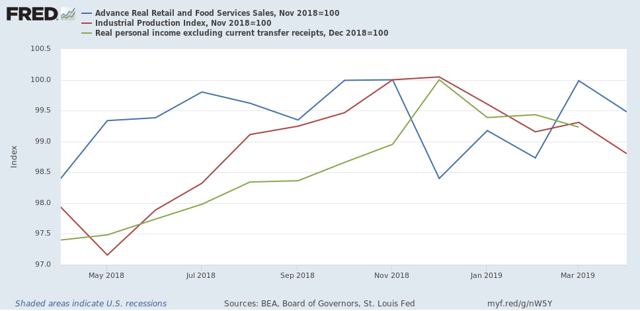
Finally, I’ve been watching construction employment as a leading sector of that metric. Employment has been the coincident indicator for the economy that has improved the most in the past half year. In fact, all three of the other four big coincident indicators remain below their highs of last November or December:
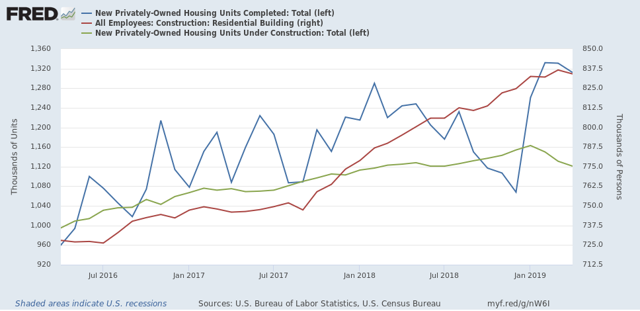
In the past, residential construction employment (red in the graph below) has usually started to decline within 6 months after the peak in the number of housing units under construction (green), and coincident with the peak in housing units completed (blue):
The number of units under construction peaked 4 months ago in January, and has declined ever since. Completed units peaked two months ago in March. Residential construction employment declined in April.
So this morning’s housing report is powerful evidence that we should expect to see continued declines in residential construction employment in jobs reports going forward.