Saturday, November 18, 2023

Weekly Indicators for November 13 - 17 at Seeking Alpha


 - by New Deal democrat


My Weekly Indicators post is up at Seeking Alpha.

After a brief pause, the coincident indicators have continued to improve. There are now very few that are not positive.

The spotlight therefore remains on the short leading indicators, as to which manufacturing has not declined enough to tip the economy into recession, and construction has not declined meaningfully yet at all (something I anticipate addressing further on Monday).

As usual, clicking over and reading will bring you up to the virtual moment as to the economy, and reward me a little bit for my efforts.

Friday, November 17, 2023

Housing construction continues to support subdued expansion


 - by New Deal democrat


Yesterday I wrote of how manufacturing has faded somewhat as a leading indicator, at least in the sense that it takes a steeper downturn than it used to in order to forecast a wider downturn in the economy.

Which makes the other big goods-producing sector, construction, even more important. And residential housing is the single most component of that. 

And even further, because of supply-chain issues during the pandemic, housing units under construction has been the most important metric of all, because they represent the actual economic activity of construction. As I wrote two months ago:

“total housing units under construction, although the most lagging of housing construction statistics, have also had to turn down before recessions begin. … multi-family units under construction, which typically turn after single family units, have also usually (except for 2008 and the pandemic) turned down before recessions have begun.”


This morning’s residential construction report for October confirmed that the peak is most likely behind us - but on the other hand, the level still continues to levitate close to that peak. Total units under construction about 1% for the month, but are only -2.2% below their all-time peak exactly one year ago:


Single family units under construction also declined a little under 1%, and are -19.5% below their May 2022 peak, while multi-family units rose by just 1,000, and are only -0.4% down from their all-time peak three months ago:


This is simply not recessionary at all. It bespeaks continued if decelerating expansion.

Now let’s turn to the proverbial tip of the spear, permits (blue, right scale in the graph below). These rose 1.1% for the month, and have rebounded about 20% back from their recent lows in January towards their previous pea. Single family permits, which are the most leading and least noisy of all the metrics (red, left scale) also rose about 0.5%, and have retraced about 25% of their decline. Multi-family permits (gold, left scale) rose about 2% off their post-pandemic low least month:


Starts are much noisier than permits, and generally lag by one or two months. Total starts (blue, right scale) also rose this month and probably bottomed in August. Single family starts (red, left scale) rose slightly for the month and remain well off their lows from the beginning of this year, while multi-family starts (gold, left scale) like multi-family permits are just off their lows set several months ago:


In summary, there was no big change this month. Very elevated interest rates have continued to suppress the new housing market, which has caused buyers to turn to apartments and condos, while builders are finding ways to cut costs. All of the activity has peaked, including the most lagging component of multi-unit dwellings under construction, but total activity has barely declined off peak, meaning this most important leading sector of the economy continues to support relatively subdued expansion.

Thursday, November 16, 2023

October industrial and manufacturing production tank - but it’s all about the UAW strike


 - by New Deal democrat


Industrial production historically has been the King of Coincident Indicators, turning up and down coincident with the onset and end of recessions in the past. But there are signs that has changed in the past 20+ years since China was admitted to normal trade relationships with the US. Because manufacturing is a much smaller share of domestic economic activity, and employment, downturns which before 2000 would always have meant recession probably do not do so now.


Which is a particularly apt introduction this month, because in October industrial production declined -0.6%, and there was a -0.2% revision to September. Manufacturing production declined -0.7%, and September was revised down by -0.1%. The below graph norms both measures to 100 as of their peaks last autumn:


Production is down -0.8% from its peak, and manufacturing down -1.7%.

BUT, let’s put a spotlight on the very important role that the UAW strike played in this month’s number. Indeed, the Fed’s release itself notes that “the index for manufacturing excluding motor vehicles and parts edged up 0.1%.”  Obviously the total index would have been much better as well, although whether it would be positive or not I cannot say at this point.

On a YoY basis, production is down 0.7%, and manufacturing down -1.7%:


Before 2000, these types of declines would always have meant a recession was upon us, and indeed underway, as shown in the below graph which norms the current YoY comparisons to zero:


But we had equivalent, and worse, declines in 2015-16 and 2019, all without recessions. This doesn’t mean that production is no longer relevant, just that it is going to take sharper declines to signal recessions - and we’re not there, particularly in light of the role played by the UAW strike.

The motor vehicle industry has been an important reason why past pattens haven’t necessarily been relevant here. Chip shortages curtailed production until earlier this year. Motor vehicle production hit an all-time high in July, but there was a-10.0% decline in October:


On a YoY basis (not shown), motor vehicle production is down -6.6%. In the past 50 years, there have been occasional bad months like this without signaling anything worse. The big decline last month was almost certainly all about the strike, and probably so were the earlier occasions.

The bottom line this month is to take it with a particularly large helping of salt. Absent the strike, there is no way of knowing whether the uptrend in production since June of last year is attenuating or not. We’ll have to wait one more month to see how the post-strike landscape compares.


Initial claims rise, but remain below the caution threshold


 - by New Deal democrat


Initial jobless claims rose 13,000 to 231,000 in the past week. The 4 week moving average increased 7,750 to 220,250. With a one week lag, continued claims rose 32,000 to 1.865 million:


I had speculated that the big decline in claims through September may have been affected by some unresolved post-pandemic seasonality, and the last several weeks have indicated that speculation may indeed have had merit. Which makes the YoY comparisons more important.

On the more important YoY basis for forecasting, initial claims were up 9.5%, the four week average up 7.0%, and continued claims up 28.3%:


Initial claims remain below the 10% increase YoY level that would warrant a yellow caution flag. While continuing claims are at YoY levels that in the past signaled recession, they have not increase YoY in almost 6 months, which tells me that longer term unemployment is also not likely to increase YoY.

Finally, here is the update vs. the Sahm rule. So far in November, initial claims are up 7.4% YoY, which suggests an unemployment rate of about 3.8% in the next few months:


This is not at the 4%+ level that would trigger the Rule.

Wednesday, November 15, 2023

Real retail sales consistent with continued slow growth, aided by a continuing decline in commodity prices


 - by New Deal democrat


Before I discuss today’s main course of real retail sales, let’s briefly ingest the ours d’oauvres of PPI and a brief update on chained CPI.


The economy has greatly benefitted from the un-kinking of the pandemic supply lines. That continued in October, as commodity prices declined another -1.3%, and finished goods PPI declined -1.9%. From their peaks in June 2022, commodity prices are down -8.8%, and finished goods inputs are down -3.0%:


Both are also down YoY, -3.6% and -0.4% respectively. 

This should feed through into continued deceleration or outright declines in consumer prices.

Speaking of which, here is the update on “sticky core” consumer prices from the Atlanta Fed. These increased less than 0.1% YoY, rounding to 3.0%:


I am sure members of the Fed will seize on this as a reason not to relax their hawkishness.

Turning to retail sales, nominally they were unchanged in October. After adjusting for inflation, they decreased -0.2%. Below I compare them with real personal consumption expenditures through September, both normed to 100 as of just before the pandemic:


Nominally both tend to follow the same path. The difference is in the deflator. Despite the slight decline in October, September was revised +0.2% higher, and the increasing trend since June 2022 has not been broken.

On a YoY basis, real retail sales are down -0.7%, vs. real personal consumption expenditures, which are still increasing. Because real retail sales, although noisy, tend to lead employment by several months, I also show employment YoY:


Real retail sales continue to forecast a continued deceleration in jobs gains. This adds to my suspicion that we will see a gain of less than 100,000 jobs in a report sometime in the next few months.

Finally, both gas and motor vehicles have played important roles in the trend in retail sales. Below I show both of them compared with total retail sales, all normed to 100 as of just before the pandemic:


In real terms, gas sales have slightly rebounded since their lows of June 2022. Motor vehicles were plagued by supply issues, which have supposedly been largely resolved. They rebounded much more sharply since 2022, although in the past few months those gains have stagnated. 

Bottom line: this month’s report remained consistent with continued slow growth.

Tuesday, November 14, 2023

Except for fictitious shelter and motor vehicle insurance and repairs, consumer inflation is thoroughly contained


 - by New Deal democrat


The October CPI report confirmed yet again what I have been saying for months: except for fictitious shelter, both headline and core inflation are well within what should be the Fed’s comfort zone.

Headline inflation (blue in the first two graphs below) was unchanged in October (thank you, renewed decline in gas prices!) and was up 3.2% YoY. Core inflation less food and energy (red) increased 0.2%, and was up 4.0% YoY.

Shelter, which is 1/3rd of the headline index, and 40% of core, increased 0.3% for the month - still the 2nd lowest increase in over 2 years - and was up 6.7% YoY. More importantly, CPI ex-shelter (gold) was *down* -0.1% for the month, and up only 1.5% YoY.

We don’t have the October read yet from the Atlanta Fed, but as of September 2021, “sticky” CPI ex food, energy, and shelter (gray) was up 2.9 YoY, and will probably be lower for October. [I will update once it is reported later this morning]

Here’s the month over month look:


And here’s the YoY look:


Parenthetically, several weeks ago the Apartment List National Rent Index shows a YoY decline for the 3rd month in a row through October:


Since fictitious shelter lags the change in both house prices and apartment rents by 12 months or more, here’s the update of the YoY% change in the Case Shiller housing index vs. Owner’s Equivalent Rent:


OER rose more slowly than house prices, and is coming down more slowly as well, but I expect the rate of decline to pick up a bit in the months ahead.

Aside from shelter, the only significant categories up 4.0% or higher YoY were food away from home (restaurants), up  0.4% for the month and up 5.4% YoY (vs. 6.0% last month), and transportation services (auto insurance and repairs), up 0.8% for the month and up 9.2% YoY (vs. 9.1% last month). Here’s the YoY trend in both:


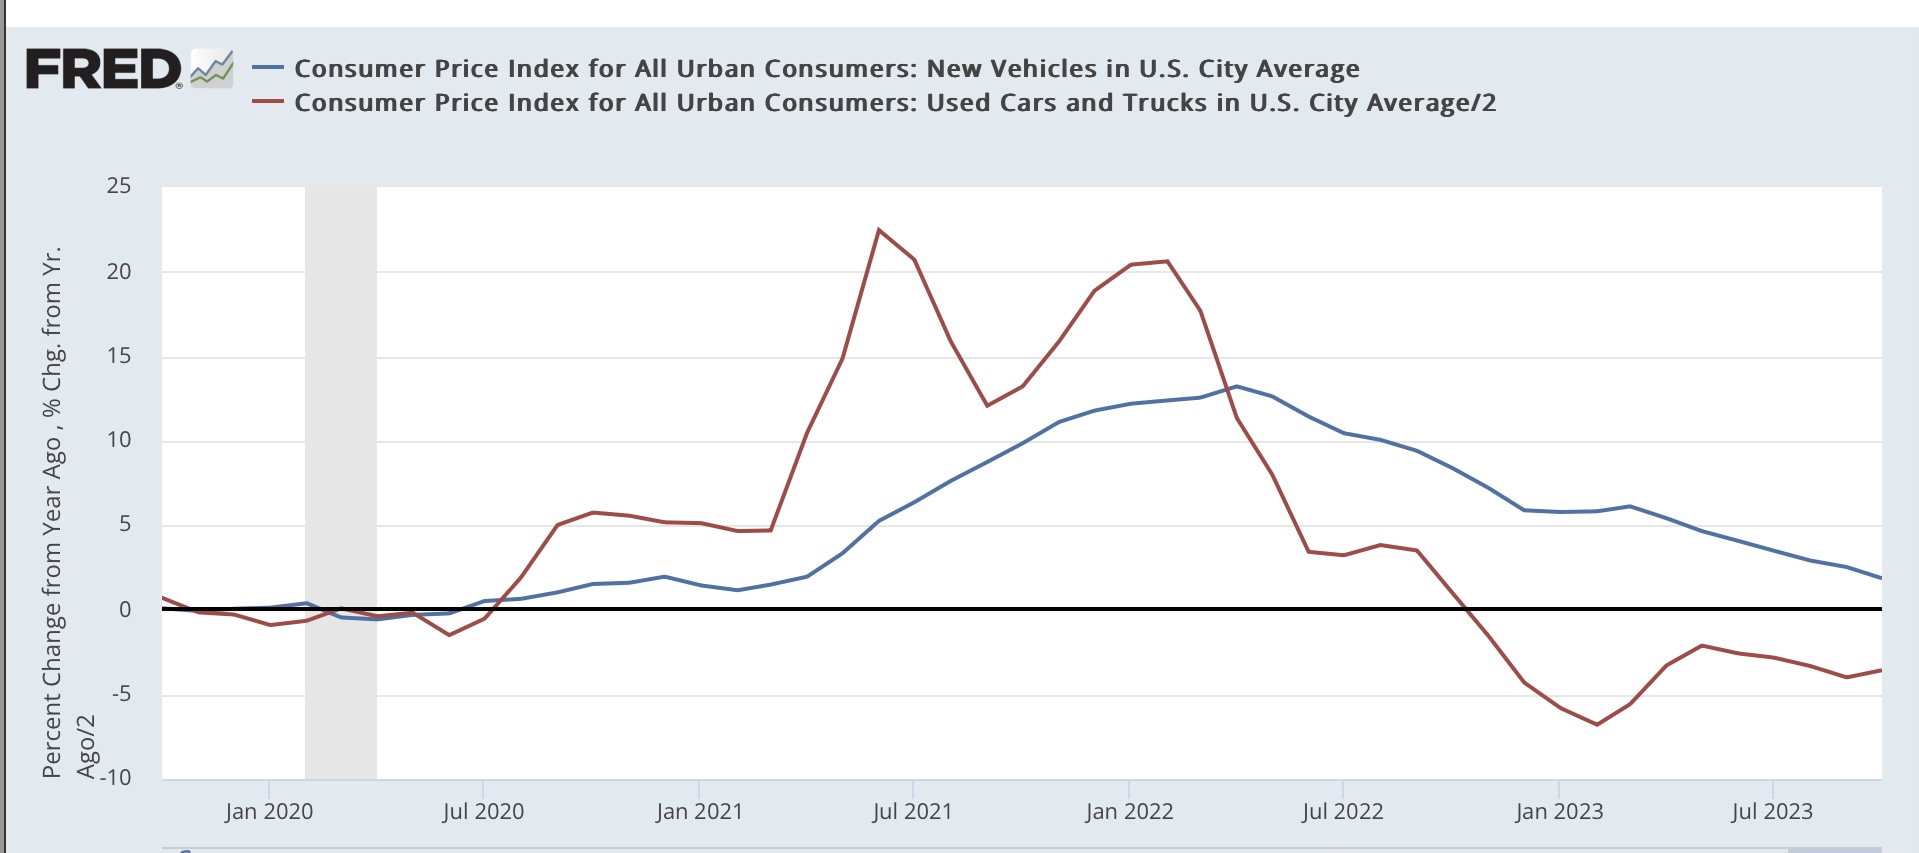
The former problem children of new vehicle prices actually *declined* -0.1% in September, and used vehicle prices (/2 for scale in the graph below) continued their cliff-diving, down -0.8%. YoY they are up 1.9% and down -7.1%, respectively:


The bottom line is, except for the lagging index of shelter, and vehicle insurance and repairs, inflation is well-contained. And if shelter were calculated realistically, headline inflation would only be up 1.8%, and core inflation up about 1.2%. We know where shelter inflation is heading, because rents and house prices are already there. So the only remaining question is what happens to other prices, like gas, in the next 6 to 12 months.

Monday, November 13, 2023

Why Biden is in trouble about the economy


 - by New Deal democrat 


A big focus of political discourse in the past two weeks has been about why Biden seems to be pollling so poorly against Trump, and in particular has not consolidated support among younger voters.

Since the economy is always a very important component of voter intentions, unless there is a major superseding event like 9/11, economic performance has historically been a good predictor of Presidential election outcomes.

So let’s take a detailed look.

First of all, remember that the election is between two people, Biden and Trump. And the economy was actually doing pretty good during Trump’s mal-administration before COVID. Here’s what real hourly wages and the unemployment rate looked like:


Real wages for non-supervisory workers, increased 3.3% between January 2017 and the end of 2019. Meanwhile the unemployment rate fell from 4.7% to 3.5%.

And that wasn’t just something ho-hum. In the case of real wages, they were the highest since the end of the 1970s. The unemployment rate was the lowest since the end of the 1960s.


So people remembering that the economy was good while Trump was in office, before the pandemic,  is not a fluke. It’s the truth, even though it is virtually 100% certain that he had nothing to do with it.

Now let’s take a look at how some important economic sectors have performed under Biden.

The unemployment rate has varied between 3.4% and 3.9% in the past year, about even with Trump’s best year - but not better. More importantly, while real wages for non-supervisory workers are up 2.2% since right before the pandemic hit, measured from when Biden came into office they are actually *down* -1.5%:


[Although I won’t bother with the graphs, other measures like the employment cost index and real personal income give similar results].

Some of this is compositional. That is, a lot of low-paid workers in sectors like restaurants and hotels were out of work during 2020 and have returned since. So their lot has improved. But this changes the averages, because more lower paid workers are in the mix. But the fact is, in the aggregate, real average hourly wages are down.

But perhaps more important is to compare the costs for some of the most important items with those wages.

Let’s start with housing, which has gotten a lot of good and insightful attention from commenters.

Below is a graph in which I compare average hourly earnings (nominal, not real) for non-supervisory workers (in red) vs. house prices (dark blue) and mortgage payments (light blue). All of these values are set to 100 as of January 2021 so you can see what has happened during Biden’s Administration. All of these are nominal, not “real,” so that we compare apples to apples:


Nominal average wages have increased 16%. But existing house prices have increased 32%, and monthly mortgage payments for new buyers have increased 279% (!!!), i.e., from roughly 3% to roughly 8%.

Is it any wonder younger workers who would like to buy their first home, or upgrade to a bigger home, would be upset?

A similar phenomenon is in place as to cars:


New car prices have increased 20%, and used car prices 23%, compared to 16% for wages (at least used car prices are down from their 40% increase 18 months ago). And new car loan payments have increased almost 70% (from about 5% to 8.3%).

Houses and cars are the two biggest purchases that most people ever make. and affording them has gotten much harder since Biden took office.

How about a couple of items the prices of which that people see almost every day, namely groceries and gas?

Grocery prices are up 29% since January 2021 (again, vs. 16% for average wages):


And gas prices, even after coming back down recently, are still up 55% since January 2021:


Now let me ask you: if you knew nothing about the personal qualities of the two Presidential candidates, i.e., if they were generic Candidate A vs. generic Candidate B, and you saw the two economic records shown above, who would you be most likely to favor?

That’s the problem Biden has.


Because I don’t like being a Doomer, let me point out that much of this is the doing of the Fed, which has raised rates at the most aggressive pace since Volcker over 40 years ago. And part of that is that the Fed fell behind the curve. Without going into all the gruesome detail, the Fed could started raising interest rates sooner but much more gradually, likely never reaching the level they are now.

Since the Fed will not want to lower rates right before an election, Biden should use whatever soft or hard clout he has to cajole the Fed into lowering rates at least some in the next 4 to 6 months. Additionally, he should explore regulatory actions, which won’t need Congress, to help out especially younger people trapped by higher loan rates. He can also propose actions to Congress, which will allow him to run against them when the GOP predictably yells that such actions are Commie Soshulist!

Also, because house prices all but stopped increasing about a year ago, housing inflation as measured in the CPI should continue to retreat. If Saudi Arabia and Russia are not successful in causing gas prices to skyrocket next year to hurt Biden, CPI on the whole should continue to moderate or at least not re-accelerate. And as supply chains continue to un-kink, we may see sellers actually lower prices on some things like groceries and yes, even cars.

Finally, and maybe most importantly, history shows that voters generally focus on the economy for the last 6 to 9 months before the election. In 2012, the economy improved a lot, and when the unemployment rate finally fell below 8% one month before the election, I knew Obama was in good shape. Contrarily, the economy was weakening close to recession in 2016. If we get better news on inflation and interest rates next year, Biden will be in much better shape.


Saturday, November 11, 2023

Weekly Indicators for November 6 - 10 at Seeking Alpha


 - by New Deal democrat


My Weekly Indicators post is up at Seeking Alpha.


How long can the short term outlook stay positive in the face of some of the worst financial background conditions in the past 40 years? Apparently, as long as commodity prices keep declining.

Clicking over and reading will bring you up to the virtual moment as to the condition of the economy, and reward me a very little bit for my efforts.

Friday, November 10, 2023

Consumption leads (longer term) unemployment, too


 - by New Deal democrat


Once again there is no new economic data, so let me follow up some more on the issue of longer term unemployment.


Earlier this week I pointed out that just as initial claims lead continuing claims, so does short term unemployment (under 5 weeks) lead long term unemployment (15 weeks and over). Think of unemployment as a pipeline, and the intake flows before the main body of the pipeline.

Yesterday I followed up by noting that just as initial claims lead the unemployment rate, so continuing claims lead long term unemployment.

Because one of my persistent themes over the years has been that consumption leads employment, let me take a little time and briefly examine a variant of this: does consumption lead *unemployment* as well?

The answer is, generally speaking, yes it does.

First, let’s look at the YoY% change in real retail sales going back 75 years to the inception of the series in 1948 (red) and compare it with the YoY% change in unemployment for 15 weeks and over (inverted, blue):


With the sole exception of the 2001 recession, where the consumer barely participated at all, the answer is pretty clear: while real retail sales are noisier, they clearly turn up and down before longer term unemployment turns.

Now let’s look at the post-pandemic record:


Once again real retail sales turned down YoY about 6 - 9 months before longer term unemployment rose. 

Next, let’s compare real retail sales with continuing claims, which as noted above, lead longer term unemployment as well:


Although sales are much noisier than continuing claims, and there is clearly no one-to-one relationship, in general sales turn up or down coincident with to slightly before the turn in  continuing claims.

Here is the post-pandemic look at that relationship as well:


Sales decayed first, although both crossed the zero line coincidentally. 

YoY real sales have been getting “less negative” and turned slightly positive in September. October’s retail sales will be reported next Wednesday. If the recent improving trend continues, this would be more confirmation suggesting that long term unemployment is not going to significantly worsen in coming months, contra the historical pattern highlighted by Cullen Roche and others.

Thursday, November 9, 2023

Initial claims continue tame YoY; why continuing claims indicate that elevated longer-term unemployment is not signaling recession


 - by New Deal democrat


Initial jobless claims declined -3,000 to 217,000 last week. The 4 week average increased 2,000 to 212,750. With a one week delay, continued claims increased 22,000 to 1.834 million:


More importantly for forecasting purposes, YoY both weekly initial claims and their 4 week average were up 4.8%. Continuing claims remained very elevated, up 27.4%:


So far for the month of November, initial claims are up 3.8% YoY, which forecasts that in coming months the unemployment rate may go back down to 3.6%:


In the meantime, since between March and September claims averaged about 11% higher YoY, the unemployment rate could tick higher by another 0.1% to 4.0% - which could be just barely enough to trigger the “Sahm rule” if it averaged 4.0% for 3 months, since it would be 0.5% higher than the 3 month average low in the unemployment rate of 3.5% for December 2022-February 2023:


But I think this is unlikely, since initial claims never quite passed the threshold for signaling recession, which would require a 12.5% or higher YoY comparison for a full 2 months.

Additionally, I wanted to follow up further on the issue of continuing claims and longer term unemployment. This is because several commentators including Cullen Roche have pointed out “when long term unemployment [for 15 weeks or more] rise by 15% or more year over year we are either in a recession or nearing recession 100% of the time.” Here’s his accompanying graph:


But, just as there is a 50+ year reliable history that initial jobless claims lead the unemployment rate, there is a similar leading relationship between continuing claims (red in the graph below) and the number of long term unemployed (gold). And there is also a coincident relationship between continued claims, averaged monthly, and the unemployment rate (blue):


Here’s the post-pandemic update of that graph:


Although continued claims are very elevated YoY, they have plateaued for the past 4 months. That suggests that the unemployment rate is already at or near its short term high (because it is coincident to continuing claims) and also forecasts that long term unemployment will not significantly worsen, unlike the past episodes Roche highlights, in which continuing claims continued to worsen YoY, as shown above.

Tuesday, November 7, 2023

Rays of sunshine in the supply and demand for credit?


 - by New Deal democrat


Access to and the supply of credit is a long leading indicator. The results of tightening or loosening don’t usually hit the economy for at least a year, sometimes two. The report on that credit for Q3 was just released yesterday, and it contained some positive (or at very least less negative) surprises.


There are two series in the Senior Loan Officer Survey that go back over 30 years: banks tightening or loosening credit, and reporting stronger or weaker demand for that credit. Let’s take a look at each.

The data for tightening standards is one where a positive number is a negative for the economy, since it means more banks are tightening rather than loosening lending standards. And here, the news was “less bad,” which is actually a positive. More banks than not continued to tighten lending standards in Q3, but at a lower rate:


What is interesting about this is that this sort of decline is what we have seen in the past 30 years as the economy is coming *out* of recession, not going into one - with the possible exception of the 1991 recession, where unfortunately the data started just before the brief recession began. We can’t put too much weight on this, given the limited data set, and it may simply be a reflection of the fact that interest rates went down between last winter and summer. Nevertheless, with economic data “good” news starts with “less bad” news, and that’s what this reflects.

This quarter for the first time the Survey broke down demand for credit not just between larger and smaller firms, but between larger and smaller banks as well. To keep the presentation cleaner, I’ve broken this down into two graphs.

First, smaller banks reported reduced demand for credit both from larger and smaller firms:


This is a negative, although once again note that the percentage of the decline has bottomed out, which is very similar to what we saw in the latter part or just after the last two recessions.

But interestingly larger banks reported an *increase* in the demand for credit from larger firms:


This is almost exactly what we have seen coming out of the last two recessions - again, with one important exception. Early in the Great Recession, when it was very shallow and focused on the housing market, a similar pattern occurred, only to be completely reversed when the banking crisis hit.

In other words, as to the demand for credit, once again the news is “less bad.” I am very much hedging my bets on what this means, given the limited history of this series. But it is of a piece with the recent increase in another long leading indicator, corporate profits, so I am keeping an open mind. This might just be a pause in a longer downward trend, or it might be the beginning of an actual turnaround in the long leading indicators.

Monday, November 6, 2023

Scenes from the October jobs report: soft landing vs. continued slow deceleration


 - by New Deal democrat


First, an editorial note: economic news is light this week, so don’t be surprised if I play hooky for a day or two.


That being said, let’s take a look at the most important trends, as I see them, from Friday’s employment report. The Big Question is, are we having a proverbial “soft landing?” Or is that just an illusory phase on the path of deceleration to something worse? Let’s take a look.

Jobs Growth

The 2023 record on job creation is susceptible to both interpretations. Since, alas, one shortcoming of FRED is that it does not have a setting for 3 month moving averages, I am outsourcing this graph to Harvard economist Jason Furman:


If we start from July 2021, there’s a clear pattern of continuous deceleration through this July. But if we start with March on the monthly numbers, or April in the 3 month average, the trend is sideways. It could just be a pause in the longer term trend, or it could be an inflection point. Since nonfarm payrolls themselves are a coincident indicator, we want to look at more leading indicators to see if a more likely answer becomes clearer.

The Leading Metrics in the Report

With a few exceptions, the leading jobs sectors have not turned down yet. Here’s the group of such leading sectors I highlight for each jobs report, plus truck transportation, all normed to their highs at 100:


With the exception of temporary help services, which peaked early last year, and truck transportation, which peaked this past January, all the other sectors are either at their highs or within 0.1% of them.

Separately let’s also look at the manufacturing workweek, one of the 10 “official” leading indicators. I’ve subtracted 40 from the actual number, because before 1983, usually hours had to fall below that measure of full-time work in order to signal recession:


While the workweek has declined by almost 1 hour since its peak, notice that it has stabilized since last December at between 40.6 and 40.9 hours, and is currently at 40.7.

I would expect all of the above metrics to decline, or decline further, before any recession begins. At the moment they are consistent with both the “soft landing” and the “continued slow deceleration” scenarios.


The short and long term Unemployment rate

The unemployment rate is somewhat unique, in that it leads going into recessions and lags coming out. And as I point out each week, it follows initial jobless claims with a lag of several months. Here’s the update of that with Friday’s 3.9% rate included:


This is weak, but it does *not* trigger the Sahm rule, which requires a 0.5% increase from the lowest 3 month averag of the past year. Also remember it is reflecting the very elevated initial jobless claims of several months ago. As initial claims have come back down, I expect some relief in coming months as to the unemployment rate as well.

One “dark” point in Friday’s report was that long term unemployment has increased sufficiently so that in every prior case going back half a century, there was a recession (see TBPInvictus, who way back in the day used to post here, and Cullen Roche, both on the Bird Site]. I want to delve into this separately in another post, but for now I just want to point out that the trend in longer-term unemployment much more often than not follows that of shorter term unemployment. Unemployment for less than 5 weeks was one of the leading indicators highlighted by the late Prof. Geoffrey Moore as one of his leading indicators, and it is part of my regular monthly report as well.

Here is the historical comparison of both short and longer term unemployment historically [I have normed the series so that their current readings = 0; also because short term unemployment (gold) is much more volatile than longer term unemployment (blue), I also include the quarterly average of short term unemployment, which distills signal from noise (red)]:


Once we distill signal from noise, over the long term, shorter term unemployment has almost always waxed and waned before longer term unemployment. Usually but not always they also turn up first before a recession begins as well. 

While longer term unemployment is indeed currently consistent with a recession, short term unemployment is not:


Unless and until both initial jobless claims and short term unemployment confirm the message of longer term unemployment, I am not treating it as anything beyond a caution signal.

Aggregate real payrolls

Finally, as you probably recall, I consider aggregate real payrolls for non-supervisory employees an excellent coincident indicator of recession, when the YoY change in payrolls is less than the YoY change in inflation. Here’s what that currently looks like:


It is likely when we get this month’s inflation report next week that the gap will narrow further, but will remain positive.

This indicator has been saying “soft landing” since the end of last year, but if as I suspect wages keep decelerating while headline inflation stabilizes, it will be more consistent with the “continuing slow deceleration” scenario.

In conclusion, the jobs report for October is convincing that there is no recession now. But it is not convincing for either the “soft landing” or “continued slow deceleration” scenario. If we are truly going to have a “soft landing,” I would expect to see continuing jobs growth of 100,000 or more each month, an unemployment rate below 4.0%, and no downturns in either construction jobs or goods producing jobs as a whole.

I’ll be paying heightene attention to those markers going forward.