- by New Deal democrat
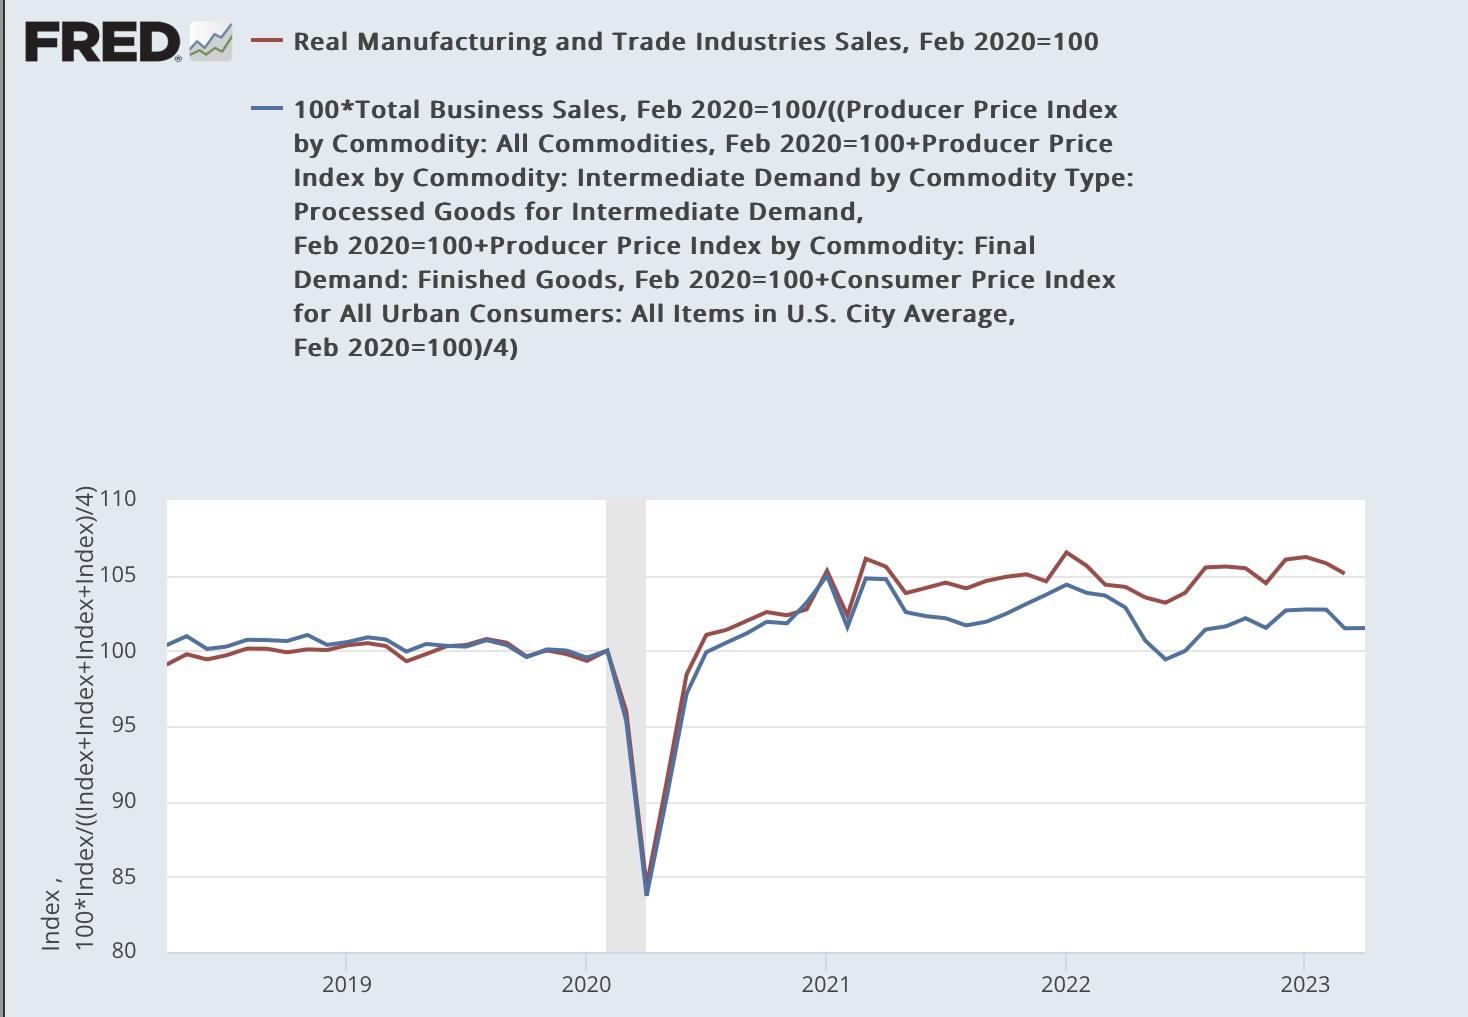
Real personal spending faltered in May, and real total sales continued to falter in April, as of this morning’s report; while real personal income continued to be aided by the big decline in gas prices that started a year ago.
- by New Deal democrat
Real personal spending faltered in May, and real total sales continued to falter in April, as of this morning’s report; while real personal income continued to be aided by the big decline in gas prices that started a year ago.
- by New Deal democrat
Initial claims dropped -26,000 last week to 239,000, the top of their former range this spring. The more important 4 week moving average rose 1,500 to 257,500, a new 18 month high. With a one week lag, continuing claims declined -19,000 to 1.742 million:
- by New Deal democrat
There’s no big economic news today.
- by New Deal democrat
Let me start with my usual caveat about new home sales: while they are the most leading of all housing metrics, they are very noisy and heavily revised.
- by New Deal democrat
Seasonally adjusted house prices through April as measured by both the FHFA (red in the graph below) and Case Shiller (blue) Indexes rose, the former by 0.7% and the latter by 0.5%. This is the third straight increase in a row. Thus house prices have probably bottomed. But on a YoY basis, prices have continued to decelerate sharply, with the FHFA index only up 3.1%, and the Case Shiller index actually showing an outright decline for the first time, down -0.3%:
- by New Deal democrat
My Weekly Indicators post is up at Seeking Alpha.
When nothing dramatic is happening, high frequency information can be like watching paint dry. That’s where we are at the moment. The positives - like improving sentiment in the stock market - are still positive; and the negatives - like interest rates and mortgage applications - are still negative. And the stuff on the cusp of changing from one to the other - is still on the cusp.
As usual, clicking over and reading will bring you up to the virtual moment on the data, and provide me with some lunch money.
- by New Deal democrat
One of the most important reasons why big Fed rate hikes and big downturns in things like housing starts and credit provision haven’t translated into a recession this year (so far!) is the big decline in gas prices in the second half of last year. This big decline has translated into income and spending gains across the board for American households.
- by New Deal democrat
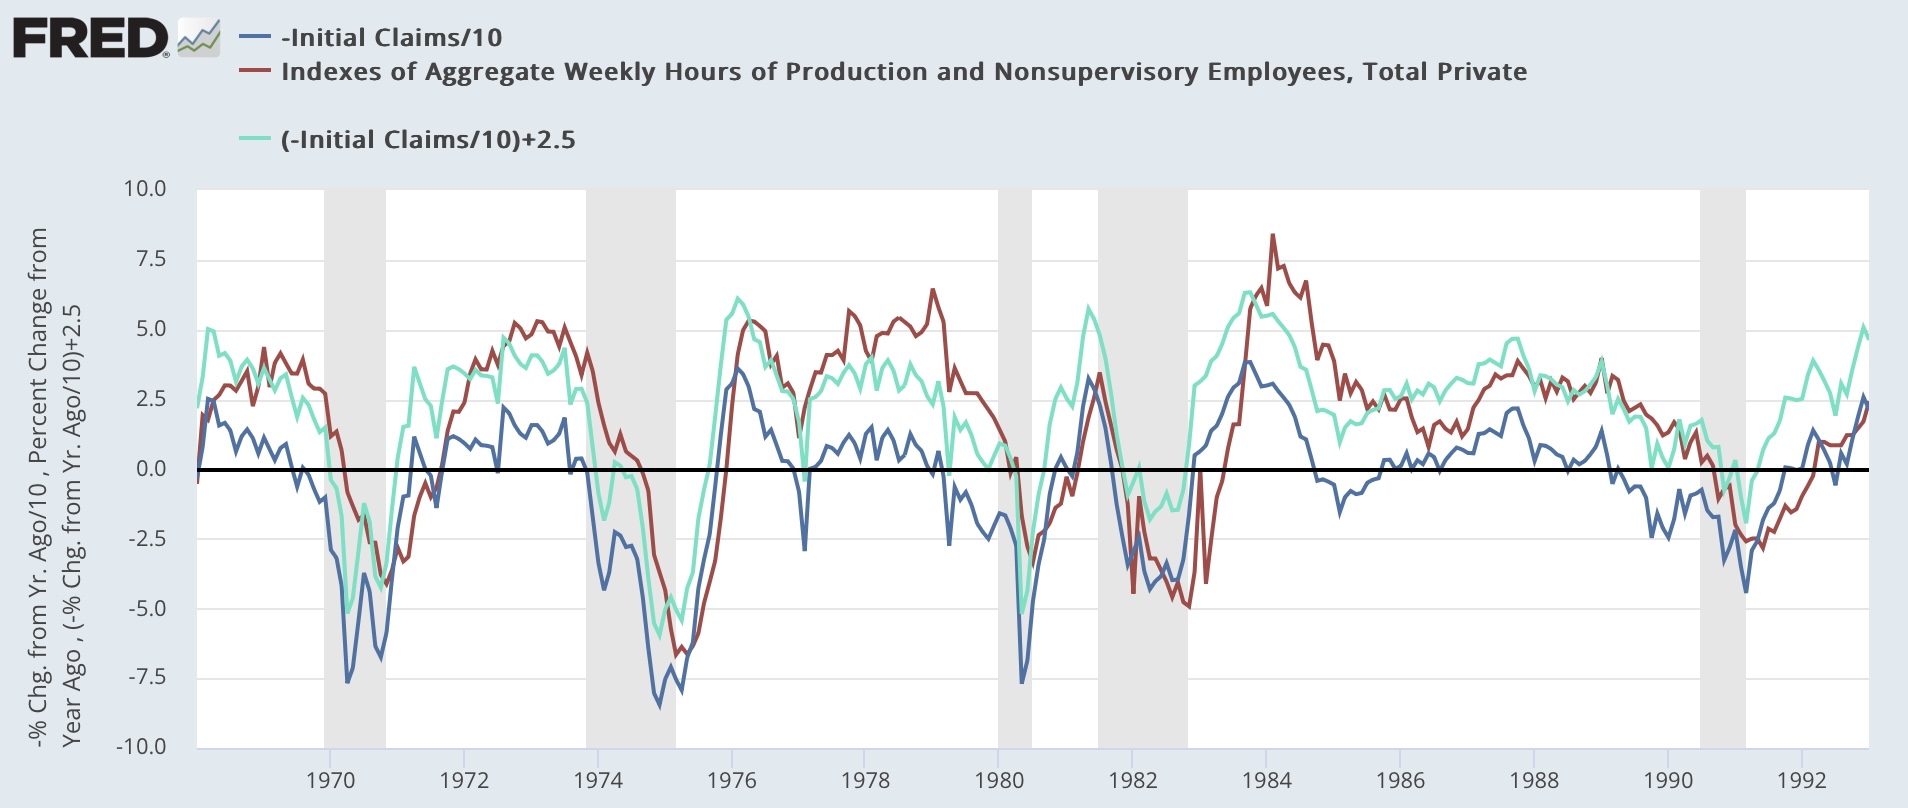
Initial claims, which were one of the most positive indicators of all last year, have turned darker in the last several months, and are edging closer to triggering their recession warning levels.
- by New Deal democrat
No big economic news today, so I wanted to pick up on a subject I began a week ago Monday; namely, taking a detailed look at personal spending, i.e., consumption. To put it in more socially relevant terms, what allows average American households to spend more, or to cut back? And what are its ramifications for the economy as a whole?
- by New Deal democrat
Last month I wrote that “the Fed’s sledgehammer attempt via one of the most aggressive rate hike campaigns in its history appears to be on the verge of failure. That’s because housing construction, more than a year after the Fed started its campaign, is not meaningfully cooperating.”
- by New Deal democrat
That Juneteenth is a national holiday ought to be a full rebuttal to those who think that teaching the entirety of American history, including its worst moments, is somehow an insult to the majority. That enslavement was finally ended by the Emancipation Proclamation and the 13th Amendment is something that all present-day Americans ought to be able to look back on as worth celebrating. We are *all* better for it, not just some of us.
Year | Permits % decline # Months | Construction %decline # months | Construction Delay from peak | |
|---|---|---|---|---|
1972 | -62% / 27 | -50% / 36 | 2 | |
1980 | -59% / 22 | -36% / 32 | 6 | |
1981 | -51% / 13 | -30% / 17 | 4 | |
1985 | -25% / 8 | -3% / 14 | 5 | |
1987 | -35% / 13 | -9% / 12 | 2 | |
1987-90 | -59% / 64 | -47% / 71 | 11 | |
2000 | -11% / 18 | -3% / 24 | 1 | |
2005-09 | -77% / 42 | -71% / 67 | 4 | |
2020 | -32% / 6 | -3% / 2 | 6 | |
Present | -30% /13 | Unknown | 10 | |
—— | ||||
—— | ||||
—— | ||||
--- | ||||
--- | ||||
- by New Deal democrat
My Weekly Indicators post is up at Seeking Alpha.
Stocks are really buying the “soft landing” scenario, rising to repeated 12 month+ highs, apparently aniticipating that corporate profits will be off to the races again.
Meanwhile, when we look at consumer spending, which is 70% of the economy, restaurant reservations, which are one of the easiest things for consumers to cut back on, continue to slowly fade downward, while retail spending as measured by Redbook also continues to inch towards turning negative as well.
As usual, clicking over and reading will bring you up to the virtual moment about the economy, and reward me a little bit for my efforts.
- by New Deal democrat
My final update this morning is for industrial production, the King of Coincident Indicators, which has most frequently corresponded with peaks and troughs in economic activity as determined by the NBER.
- by New Deal democrat
The second of the three important datapoints this morning was retail sales for May. This is one of my favorite indicators, because it has several leading relationships, and is also an important component of one of the main data series that the NBER looks at in dating recessions.