Saturday, October 22, 2022

Weekly Indicators for October 17 - 21 at Seeking Alpha


 - by New Deal democrat

My Weekly Indicators post is up at Seeking Alpha.

If you thought the long leading indicators couldn’t get any worse - well, they could.

As usual, clicking over and reading will bring you up to the virtual moment as to how the economy is doing right now, and how it is likely to perform over the next 12 months+.

Friday, October 21, 2022

Coronavirus dashboard for October 21: the autumn lull continues, despite new subvariants


 - by New Deal democrat


No economic data today, so let’s update the status of COVID-19.


We are currently in a relative lull, with confirmed cases, hospitalizations, and deaths all near or at low levels only matched or exceeded at mid-year 2021 and early spring of this year.

Here is the 6 month view of confirmed cases and deaths:


At the moment deaths are averaging a little under 350/day, in the range of this spring’s lows. At 35,200, confirmed cases are down 75% from their June peak and at a 6 month low.

Here is the long-term view since the beginning of the pandemic:


As I wrote above, current levels are only higher than 3-4 months during the entire past 2 years.

Similarly, hospitalizations have continued to decline to 24,000, just a little over half of what they were at their recent June peak, and only higher than 4 of the past 24 months:


BIobot’s wastewater analysis shows the West and South declining at low levels, the Midwest steady, and the Northeast also declining but from very elevated levels:


Nationwide (not shown), levels are consistent with about 225,000 “actual” cases of COVID daily.

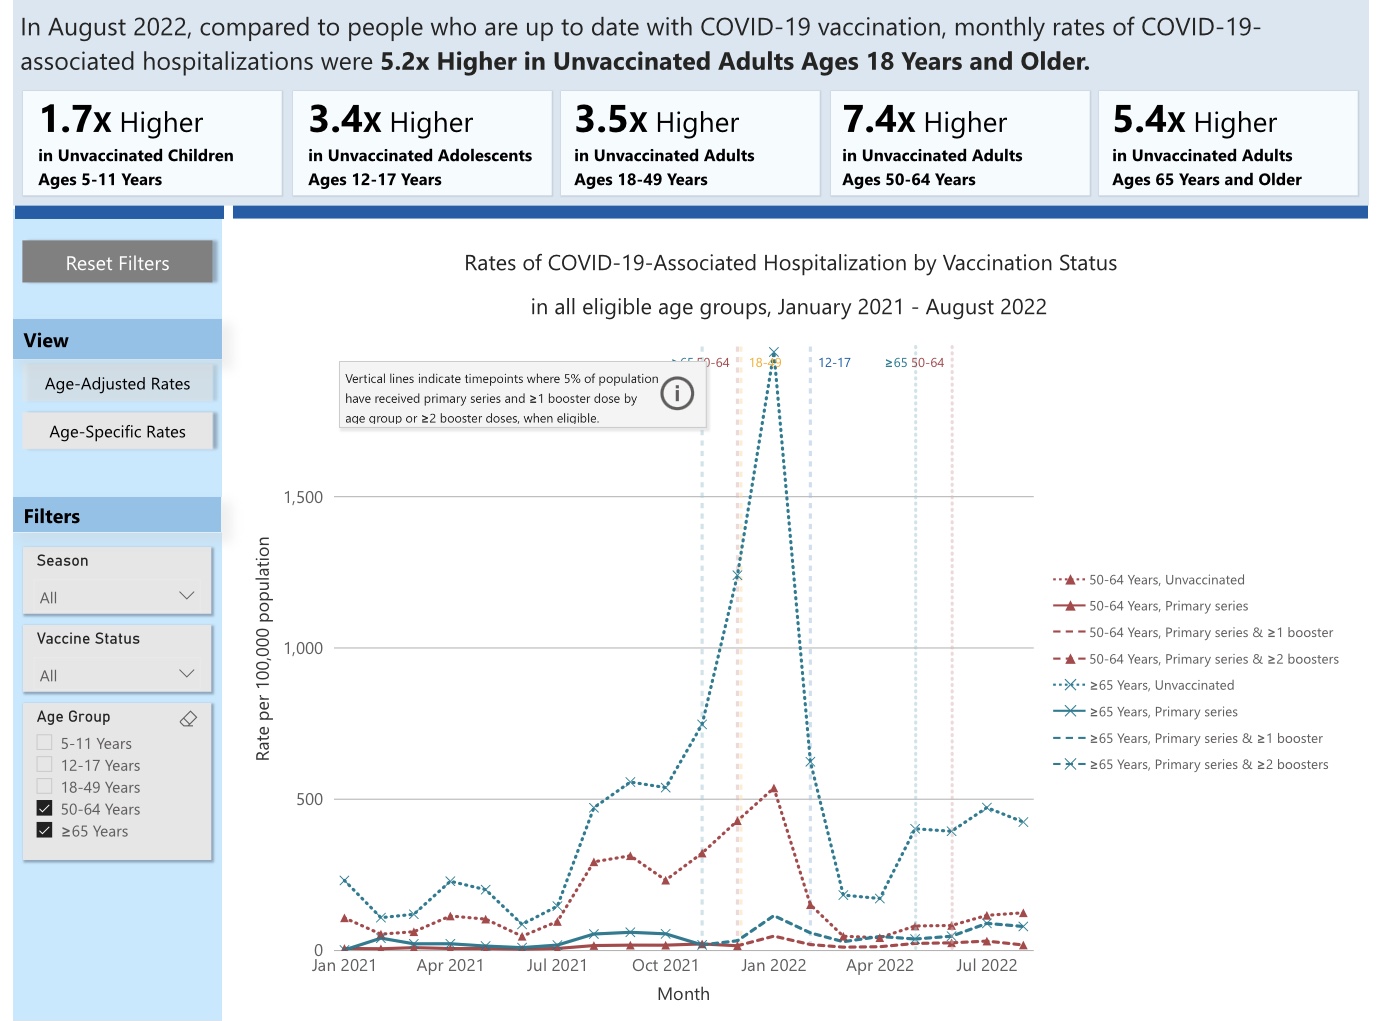
Demographically, as of August the biggest proportion of hospitalizations - by far - is among unvaccinated seniors, followed by the late middle-aged unvaccinated, and that followed closely by vaccinated seniors:


Aside from the unvaccinated younger middle-aged, everybody else has very minimal risk of hospitalization from COVID:


Finally, here is this week’s variant update from the CDC:


BA.5 continues to fade, and BA.4 is all but gone. The new alphabet soup of variants account for about 3/8’s of all cases, but since the number of cases has declined in the last 1 and 2 weeks, numerically the new subvariants altogether probably increased from an average of 11,000 to 13,000 cases daily. So far this looks much more like the BA.2.12.1 increase of late last spring rather than any major wave like Delta or the original Omicron.

Which makes sense, since as this graphic shows, all of the new alphabet soup of variants are either “children” or “grandchildren” of BA.2, and most are also “children” of BA.5:


COVID-19 is somewhat seasonal. So we get spikes in the South in the summer, and in the NOrth during the winter, both coinciding with the time of the most indoor social activity. We will almost certainly get some kind of winter wave, but at may simply resemble the BA.2.12.1 wave from this past summer, rather than a monster wave like the last two  winters.  

Thursday, October 20, 2022

September existing home sales and prices decline


 - by New Deal democrat

With the exception of their big impact on prices, I do not particularly pay attention to existing home sales. Their economic impact is small compared with the construction of new homes; at best they add confirmation to a trend in new home sales, permits, and starts.


In September, existing home sales did continue to decline, by 2%, to 4.71 million units annualized (Note: all the graphs except for one in this post come from Mortgage News Daily, and have not yet been updated with this morning’s September data):


Their total decline from their January peak is a little over 25%, and -31% from their even higher peak in October 2020, in line with what we saw in yesterday’s Permits and Starts report.

Prices declined for the month, but that is expected since they rise in the late winter and spring, and decline from summer into winter. More important is the YoY metric, and there prices rose 8.4% Note the big declines in July and August vs. prior years:


This is higher than last month’s 8.2% YoY, but lower than any other month in the past 2 years. It is also less than 1/2 of the biggest YoY% increase in the past year, which by my rule of thumb for non-seasonally adjustable data means that it is in decline from the absolute peak.

Inventory, which also is not seasonally adjusted, was slightly lower, by -0.8%, from one year ago:


This has become a chronic problem, but usually inventory rises after prices begin to fall, as sellers are initially reluctant to accept that the $$$ peak is in. Here is what the longer term inventory data looks like:


Inventory has generally increased from 2021, but is still well below inventory before 2019.

In sum: September existing home sales is confirmatory evidence that sales have continued to decline, and that prices have started to decline as well. Total inventory has increased, while new listings are slightly lower than one year ago.

Jobless claims flat for the moment


 - by New Deal democrat

There’s no big news in the jobless claims release this week.

Initial claims fell -12,000 to 214,000, but the 4 week average increased 1,250 to 212,250. Continuing claims, which lag somewhat, increased 21,000 to 1,385,000:


To the extent there is any discernible trend, I would call it sideways in the past few weeks.

I had expected gas prices to continue to rise following OPEC’s decision to cut production earlier this month. But that hasn’t happened:


It may well be that several OPEC countries are cheating (i.e., continuing to produce as before while relying on others to cut back and drive up prices. It could also be affected by Biden’s decision to release oil from the Strategic Preserve.

In any event, I expected jobless claims to rise again with gas prices. Needless to say, so far that hasn’t happened. Which is good news, so I’ll take it.

Wednesday, October 19, 2022

Housing on track for an early 2023 recession, but with a major caveat


 - by New Deal democrat

I don’t think anybody was expecting a good housing construction report this month, and those non-expectations were certainly fulfilled.


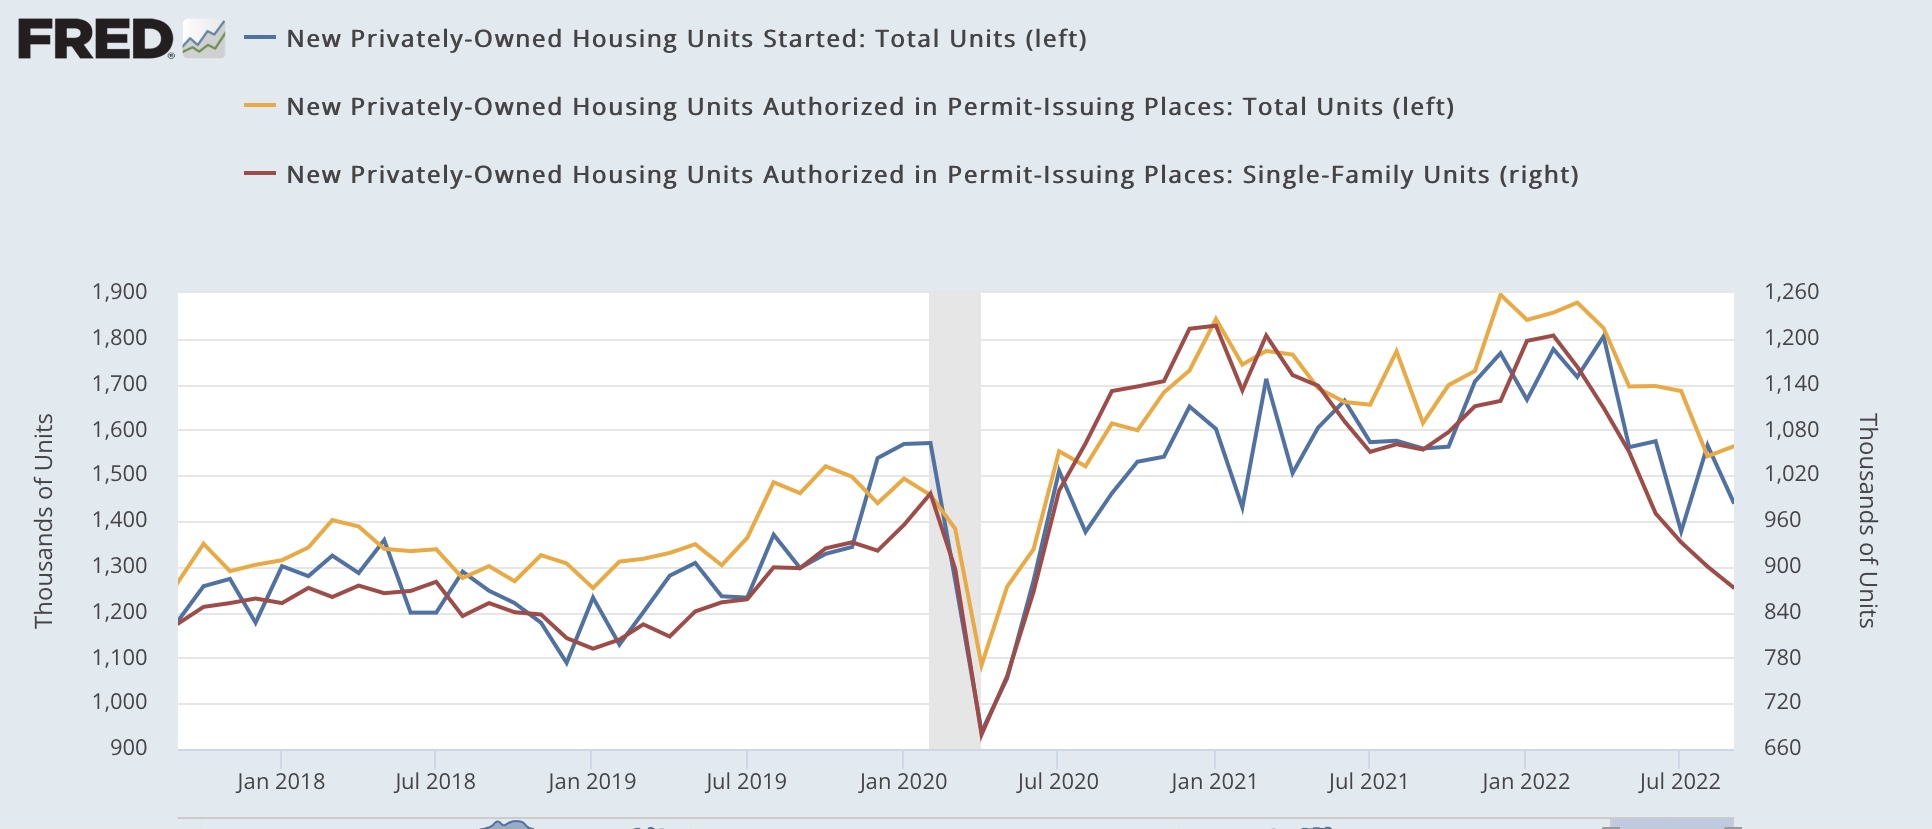
Housing permits rose slightly, 1.4%, from last month’s 2 year low. Single family permits, which contain even more signal, declined -3.1% to the lowest level in 3 years excluding two pandemic lockdown months. The more volatile starts declined -8.1%, while their 3 month average declined -11.3% during the 3rd Quarter, also to a 2 year low:


Measuring from their respective recent peaks, starts are down -20.3%, permits down -17.5%, and single family permits down -27.6%:


These are well within the ranges of declines that have previously been consistent with recessions, with the exception of 1966, although frequently the actual recession hasn’t started until there has been a -40% decline:


And it certainly looks like we are likely to get to that -40% milestone, and soon. 

Here is a variation on a graph I have run many times over the past 10 years, comparing the YoY change in interest rates, in this case mortgage rates (inverted, *10 for scale) with the YoY% change in housing permits:


As I always point out, interest rates lead housing permits roughly by 3 to 6 months. YoY interest rates have climbed 4%. That was only exceeded by 5% and 6% increases in 1980 and 1982 respectively, which coincided with -50% declines in housing permits. In other words, we should expect housing permits to have declined by about -40% within the next 3 to 6 months - putting a likely recession start date in the 1st quarter of 2023.

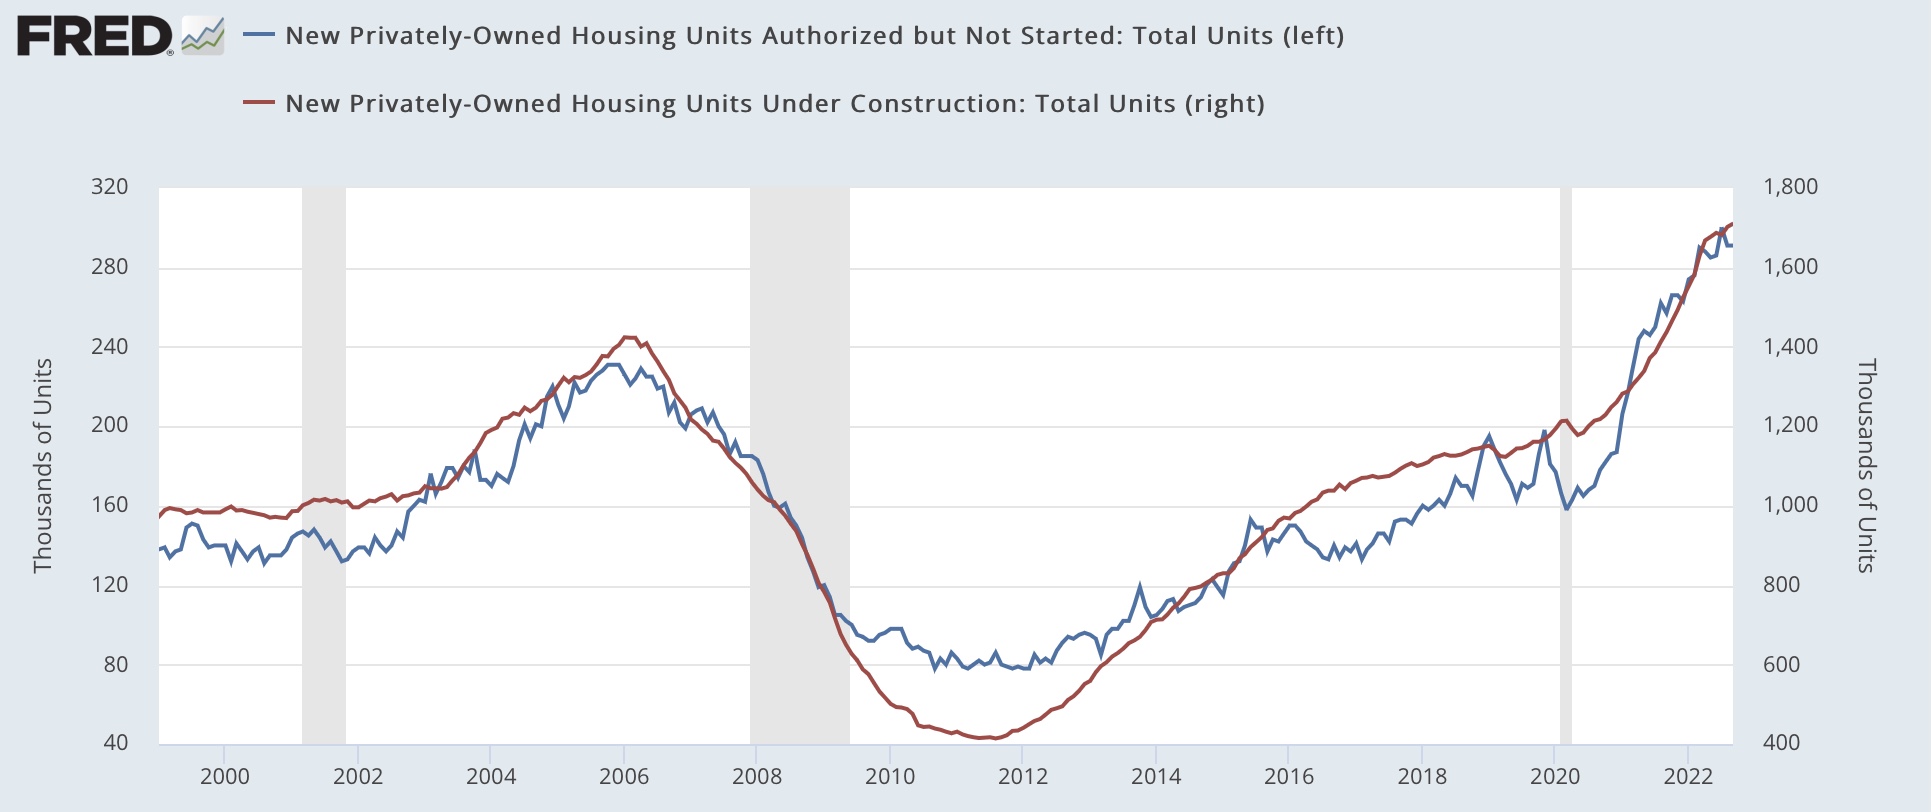
There is one silver lining, or at least an asterisk, in this forecast. Because of a shortage of building materials, there have been record numbers of housing units that have been permitted, but have not yet been started (blue in the graph below), and consequently a big lag in housing under construction compared with housing permitted (red):


The former may have peaked in July, and has been essentially flat for the past 6 months. The latter has continued to increase, but only by 2.5% in the past 5 months. 

Because housing under construction is the actual economic activity, this suggests that in the 3rd Quarter residential housing contributed ever so slightly to GDP growth. 

With the sole exception of the 2020 pandemic lockdown recession, construction, which is an even smoother metric than single family permits, has always peaked at least 6 months before the onset of recession, with a median time of 18 months, and as much as 47 months; and has declined at least 6.5%, and as much as 34%, with a median decline of 20% from peak:


In other words, there is a significant element of “it’s different this time,” in that construction has in the past typically followed a decline in permits by 0 to 11 months, with a median of 5.5 months. Further, a recession has typically followed a decline in construction by between 6 and 47 months, with a median time of 18 months; and has declined at least 6.5%, and as much as 34%, with a median decline of 20% from peak.

We are now 9 months out from the peak in permits, and construction has not yet rolled over. Thus past history would suggest no recession begins until at least 6 months from now, and possibly much later - depending on how quickly construction rolls over and how abruptly it declines.

Tuesday, October 18, 2022

September industrial production comes in very strong


 - by New Deal democrat

September’s industrial production report puts the final nail in the coffin in the notion that the US is already in recession.


I call industrial production the King of Coincident Indicators because, more than any other single metric, it coincides with the peaks and troughs of US economic activity as determined by the NBER. In September total production increased 0.4%, and August was revised higher by 0.3%. Manufacturing production increased 0.5%, and August was revised higher by 0.1%:


Total industrial production is at an all time high. Manufacturing is higher than at any previous level with the exception of the end of 2006 through early 2008.

Today’s report, including revisions, also reverses the decelerating trend which I noted last month, as shown by the YoY% changes:


Because this is, as I said at the outset, a coincident indicator, it does not materially change my forecast for next year. But it is good news for now.

Monday, October 17, 2022

The “Consumer nowcast” recession warning is triggered, as real wages decline, real aggregate payrolls near stall, plus record mortgage payments


 - by New Deal democrat

No economic news today. So, now that we have the September inflation read, let’s take a look at a couple of important consumer indicators: real average wages, and real aggregate payrolls for non-supervisory workers.

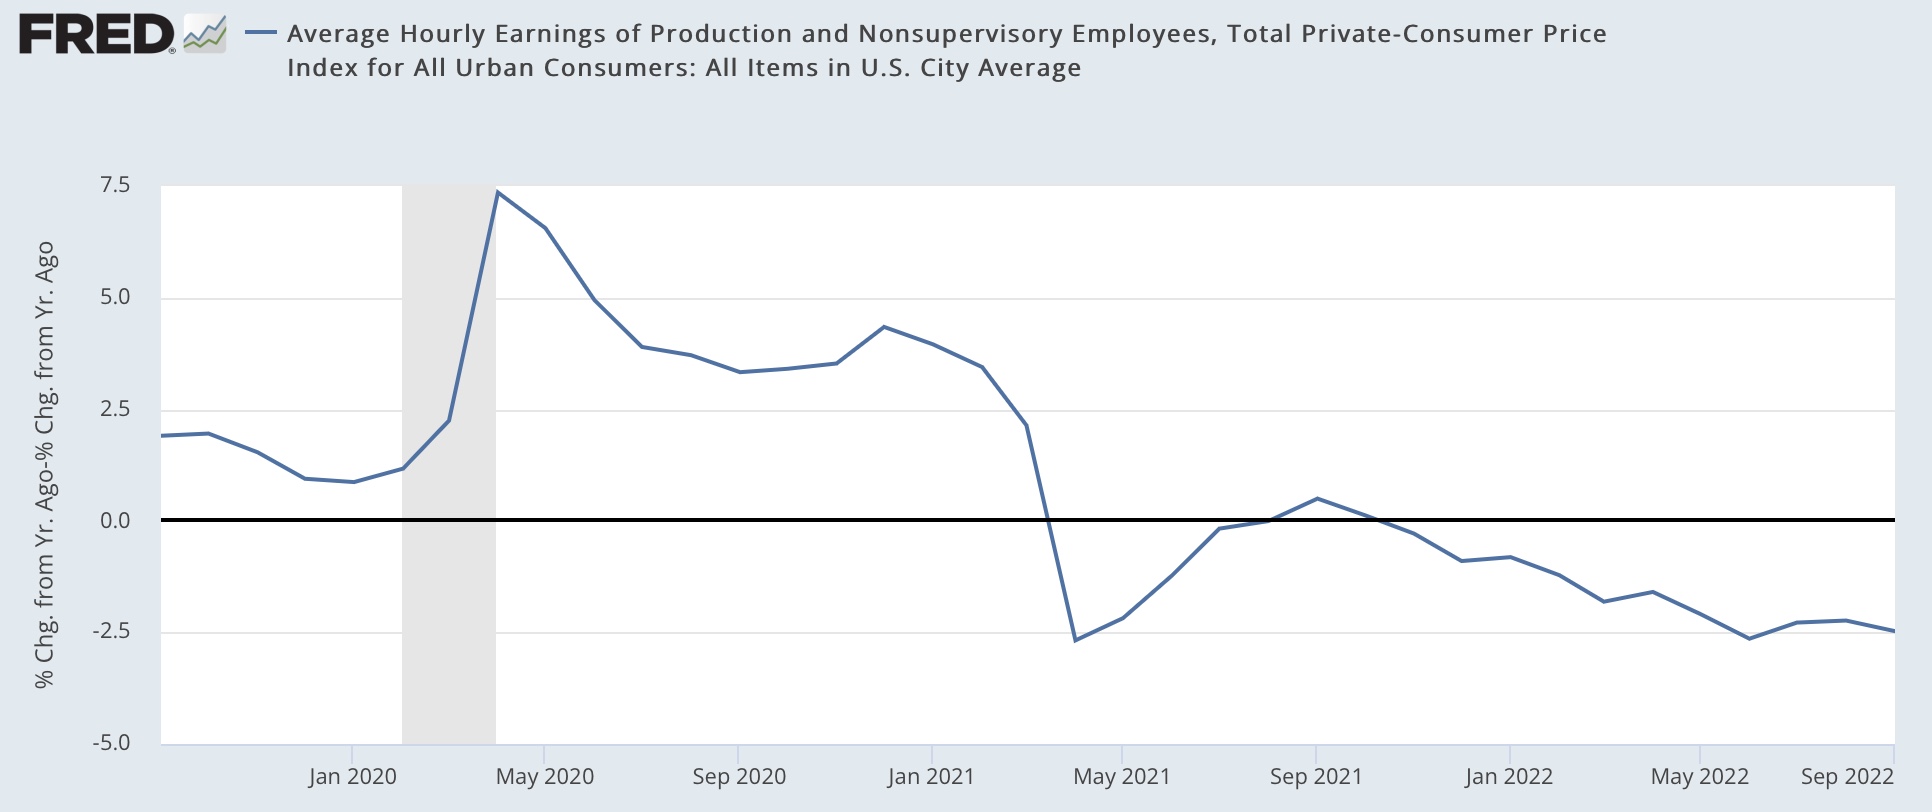
Real average hourly wages for non-supervisory employees have declined almost relentlessly since last September, only broken during months where gas prices were steady or declined:


The total decline since then is -2.5% YoY:


Frequently - but not always, this level has been associated with recessions:


The only way to keep up consumer spending in the face of such a decline is either to cash out an asset (e.g., a cash out refinance of a house) or to dig into savings (in the 1980s, it was assisted by women’s entry into the workforce, which boosted *household* income). And as I’ve written the past couple of months, the personal saving rate, at 3.5% in August (after a 15 year low of 3.0% in June), is near all-time lows, equivalent to the 2005-07 period:


Meanwhile, as I suggested they would several weeks ago, real aggregate payrolls for non-supervisory employees did improved in the 3rd Quarter:


As I wrote then, that pretty effectively kills the idea that a recession has already begun.

But they are only up 1.1% in the past year:


As I wrote recently, real aggregate non-supervisory payrolls are a good coincident to short leading indicator for a recession, because they tend not to be noisy, and with the notable but I believe irrelevant exception of the 2003 “jobless recovery,” whenever they have declined YoY (1967 and 1996 were close to zero, but no cigar), a recession has either begun or is going to start in less than a year:


In the past year, real aggregate payrolls have decelerated at a pace of 1% every 4 months. Which means that if that pace continues, they will turn negative in January or February of next year.

And remember: although I won’t bother with the graph, consumption leads employment, and real consumption has been essentially flat to slightly declining for over a year. So there is no reason to expect the pace of employment not to keep slowing down.

In fact, there are a couple of reasons to expect that it *will* keep declining.

First, gas prices stopped declining with OPEC’s cutback in production:


One month ago the nationwide average gas price was $3.64/gallon. It rose as high as $3.95 before declining back to $3.85 today.

What is more serious is what has happened to mortgage payments. I last looked at this back in April.

Here’s what has happened to mortgage rates in the past year:


They have risen from just over 3% last October to just over 7% now.

Back in April I calculated that house prices in real terms were almost identical to their 2006 highs. They got a little higher by summer, and have fallen back a little since, so they are about the same now as they were then. 

That being the case, let’s compare a $250,000 mortgage at the peak of the housing bubble 15+ years ago and now at the prevailing mortgage rates in real terms. Here’s the monthly payment for each in today’s $$$:

April 2006: $1865.
July 2006: $1913.
October 2021: $1337.
October 2022 $1947.

That’s a new all-time record high. And an extra $600/month is going to price a lot of people out of the market. We’ll see what September housing permits and starts bring us Wednesday, existing home sales on Thursday, and new home sales next week. But it’s not likely to be good.

Finally, this brings to the fore my alternate, “consumer nowcast” model of recession. This states that when real wages decline, if consumers can’t cash in an appreciating asset like stocks (down almost 25% since their peak in January), or housing equity (which likely peaked over the summer), and they start to save more (possibly the 3.0% June saving rate was the low for this expansion), a recession is imminent. This model has now been triggered: it signals that a recession is likely, and very soon, as in Q1 2023. The only questionable component is whether the increase in the savings rate persists.

In summary, we have average Americans with very little more money in real terms to spend in total vs. one year ago, and less money per capita. This by itself should cause new hiring to flag somewhat more than it already has from last year’s blistering pace. And two very big, very important spending items aren’t getting any better and in one case has gotten much, much worse. This is, to say the least, not a recipe for expecting a turnaround to the downward pace.

Saturday, October 15, 2022

Weekly Indicators for October 10 - 14 at Seeking Alpha


 - by New Deal democrat

My Weekly Indicators post is up at Seeking Alpha.

Just about everything looks awful. And one bright spot, consumer spending as measured by Redbook, just got dimmer.

Needless to say, if consumer spending rolls over, that’s pretty much the ball game..

You can be brought up to the virtual moment in the ugliness by clicking over and reading, and it will reward me a little bit for my efforts.

Friday, October 14, 2022

September real retail sales lay another egg


 - by New Deal democrat

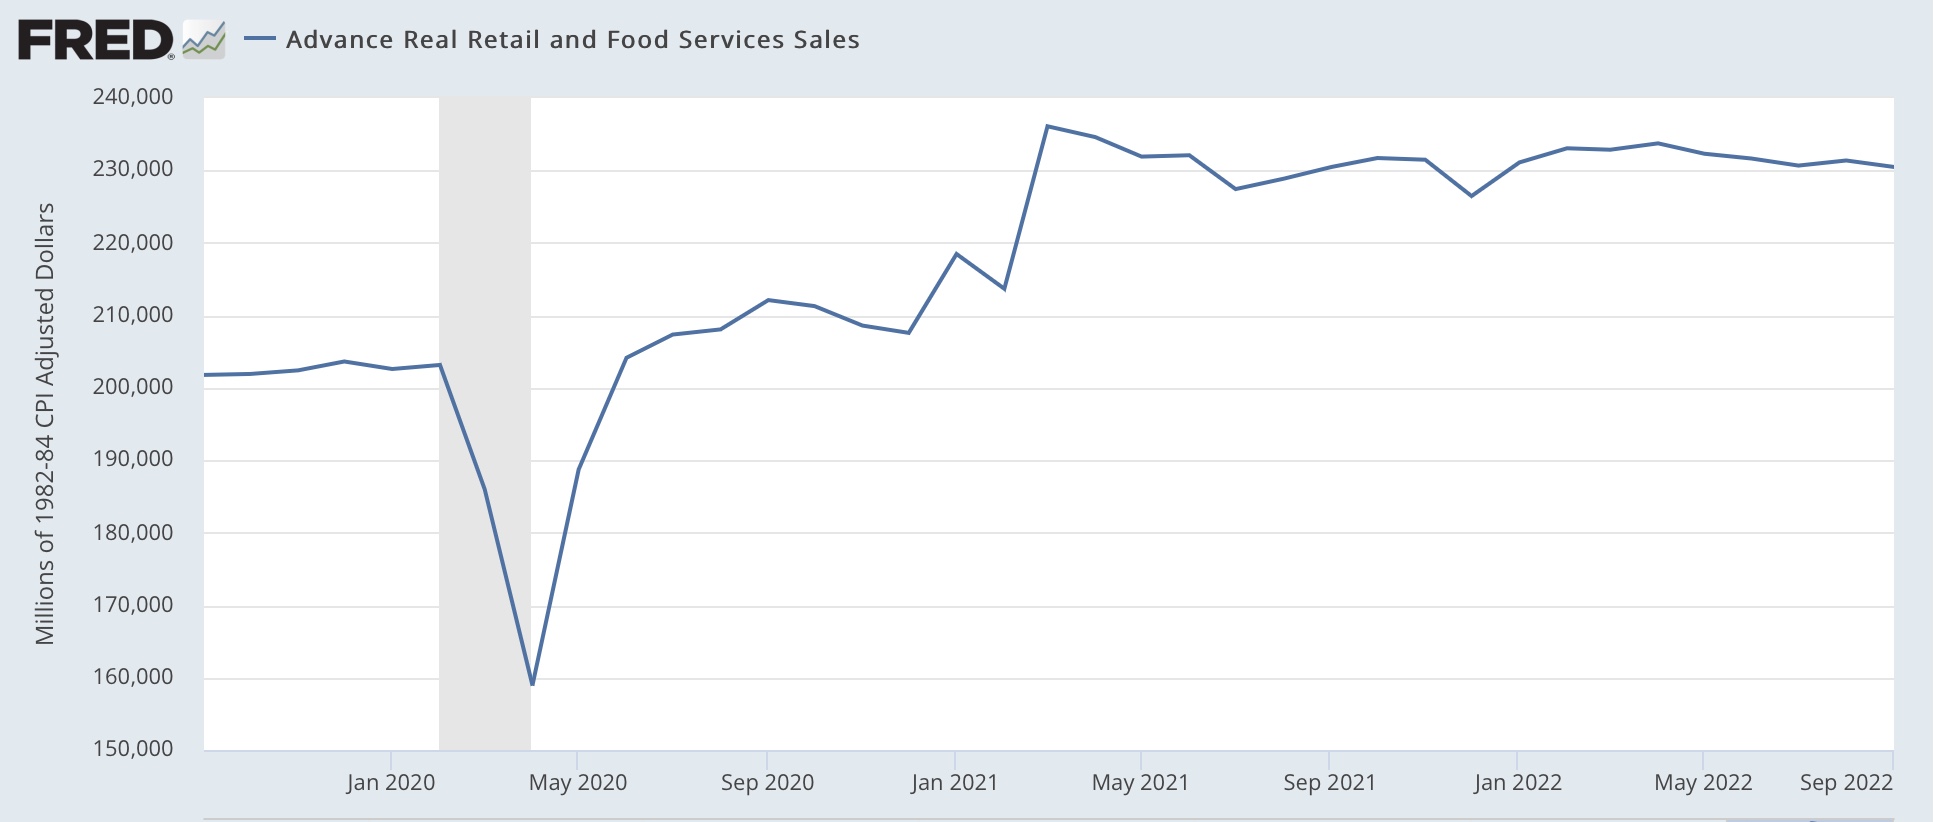
One of my favorite indicators, retail sales, was reported for September this morning, and it came in unchanged. Which means that after factoring in +0.4% inflation in September, real retail sales were down -0.4%.

Which is not good, because real retail sales have gone nowhere in 18 months, and have been down every single month since April with the exception of August, and are now down -1.4% since then:


Furthermore, real retail sales being negative YoY for more than a couple of months has for the past 75 years been an excellent coincident to short leading indicator for an oncoming recession:


The only false positives are 1951 and 1966. In September, the YoY change was exactly *0*. Our current situation - of half a year of monthly readings just above or below zero - is very similar to the first half of 2007, and we know how that wound up!

Next, As I note almost every month, real retail sales (/2) are a good short leading indicator for employment. Here’s the long term view from 1993-2019:


To avoid issues with scale, I am skipping the data from 2020 and early 2021. Here is the updated comparison with payrolls since June 2021:


Retail sales continue to forecast a deceleration in monthly payroll gains. Last autumn’s Booming payroll gains are a thing of the past. While there will always be monthly outliers, payroll gains averaging under 0.2% (about 300,000) - and gradually decelerating more - are what we should expect for the rest of this year. 


Thursday, October 13, 2022

September consumer inflation: primarily a function of the fictitious “owners’ equivalent rent” plus new cars


 - by New Deal democrat

Since last November I’ve been hammering the fact that the official CPI measure of housing inflation, “owners’ equivalent rent,” seriously lagged, as in by a year or more, actual house prices as measured by the most popular housing indexes. At the time I wrote that OER was only up 3.1% YoY and core inflation was only up 4.6% YoY. I said then, and I have reiterated almost every month since, that because of this serious lag, OER was going to rise probably to 7.5% YoY or more, and drag core CPI along with it.


Here’s just a few highlights of what I have written since then, beginning with December:

“Last month I wrote that inflation was “a Big Deal,” because it showed that consumers were already under pressure, and because, via owners’ equivalent rent, we could expect higher inflation to continue next year. Today’s report only reinforced that concern. While we haven’t crossed a threshold at this point into a downturn consistent with a recession, we certainly are at a point where a sharp deceleration beginning with the consumer sector of the economy is more likely than not.”

And since then, the consumer certainly has slowed down. In fact, consumer spending has been essentially flat (up 0.7%) in real terms in the last 12 months.


“I fully expect the housing component of inflation to continue to worsen considerably.”

 Then in May I wrote:

“the current rise in house prices of nearly 20% YoY, is significantly worse than either of the previous two - and has been up almost 20% YoY for the last 8 months running. With CPI housing inflation already at a 20 year high, we can further record CPI housing increases as this year progresses.”

And in August I wrote:

“Since house prices had not meaningfully decelerated through May, the last month measured in the index, it is still likely that OER has not hit its YoY peak. We are likely to see the highest YoY% increase for OER ever before this episode is over.”

Since house price indexes have historically been about twice as volatile as OER, and peaked at about +20% YoY, I have anticipated that the OER component of inflation could go as high as close to 10%.

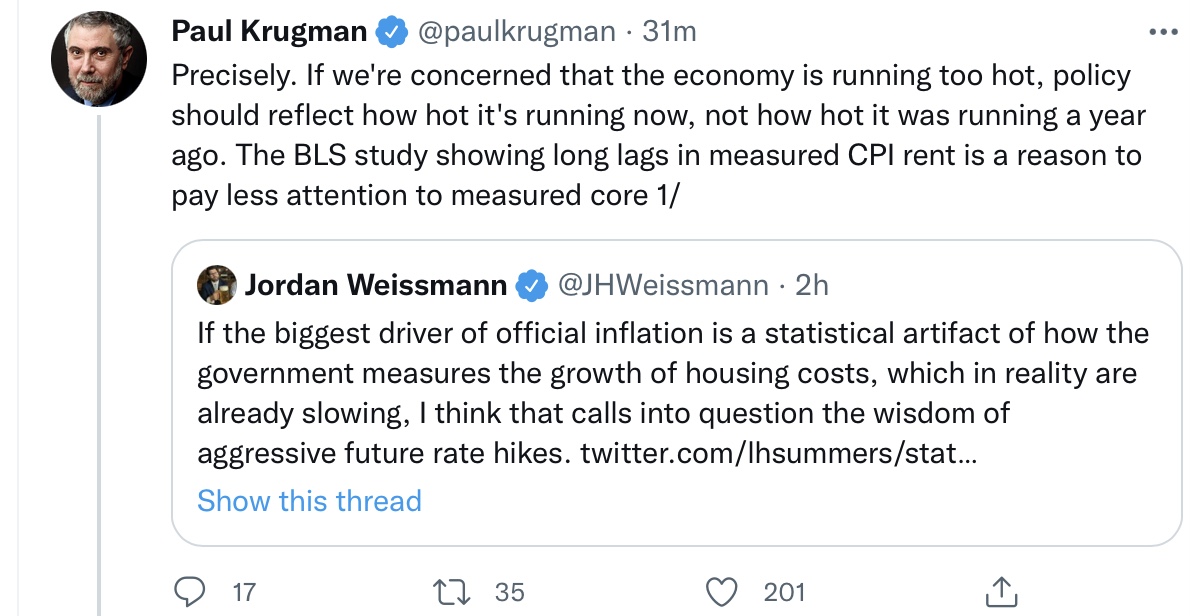
This week that notion finally made it to the top of the academic economic establishment, as Larry Summers wrote:


And Paul Krugman responded:


Here is the projected path of OER as forecast by Summers:


All of which I forecast almost one full year ago.

So let’s look at how badly OER skewed core inflation in September, from this morning’s report. To cut to the chase, without OER total inflation would have been up 0.3%, and core inflation up 0.4%, vs. the reported numbers of +0.4% and +0.6%, respectively. 


Here are the headlines with attendant graphs:
Total CPI +0.4% +8.2% YoY (less than 0.1% decrease from last month)
“Core” CPI +0.6% +6.7% YoY (new 40 year high)

Monthly:

YoY:


Owners’ equivalent rent +0.8% +6.7% YoY (new all time YoY high, exactly as I forecast) compared with the FHFA purchase only house price index (black, /2 for scale):


Energy -2.1% +19.9% YoY (down from +41.5% YoY in June):


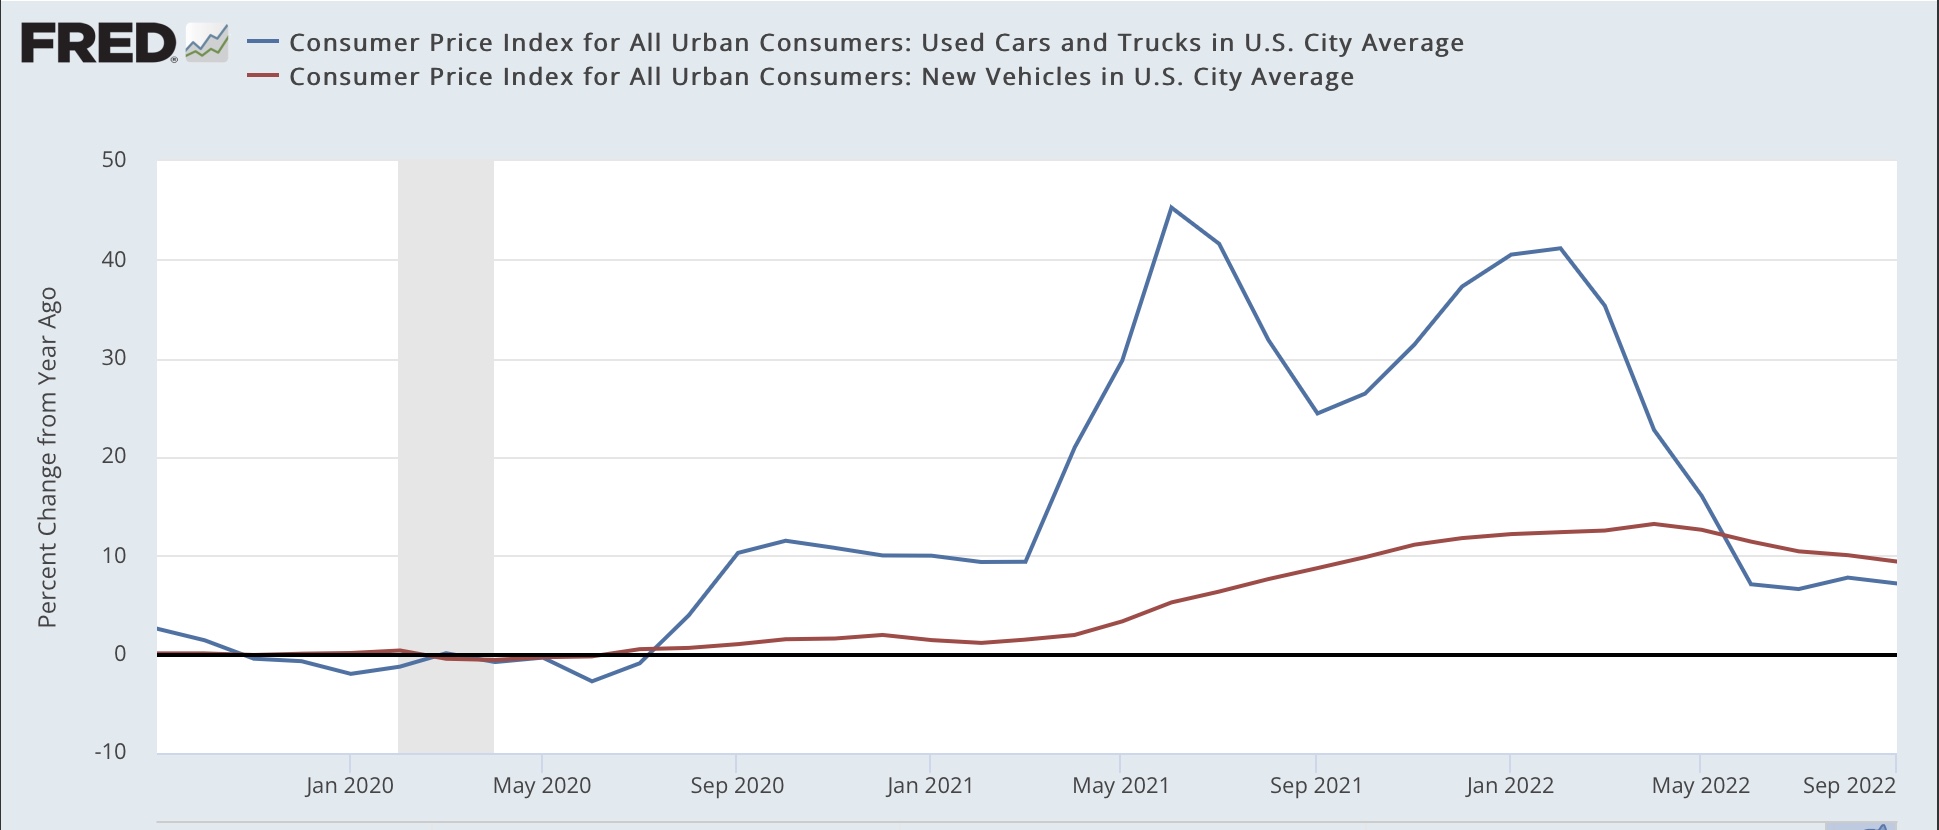
Used vehicles -1.1% +7.2% YoY (down from +41.2% in February
New vehicles +0.7% +9.4% YoY (down from +13.2% in April)

Index values:

YoY:


In essence, inflation at this point is primarily a function of the fictitious and lagging measure of housing that is used by the Census Bureau (even though the house price indexes peaked in May and June, and turned down slightly in July), plus the shortage of computer chips for manufacturing vehicles.

In hiking rates, the Fed is chasing a phantom, lagging, menace.

UPDATE: And here is Krugman’s reaction:
Only 11 months after I highlighted the same issue - and forecast exactly where we are today - it’s nice to see a top academic “get it.”

UPDATE #2: Here is what core inflation without OER looks like - it is declining:


Initial claims continue to rise along with gas prices


 - by New Deal democrat

Last week I wrote that initial jobless claims may have ended their recent downtrend. This week appears to have confirmed that.

Initial claims rose 9,000 to 228,000, and the 4 week average rose 5,000 to 211,500. Continuing claims, which lag somewhat, increased 3,000 to 1,368,000:


With OPEC deliberately cutting back production in order to cause a shortage in Europe and the US this winter (to aid Russia, and also the GOP in the midterm elections), gas prices will likely continue to rise. I would expect jobless claims to continue rise as well. Whether this is the final rise before a recession signal is impossible to know just yet.