Saturday, December 21, 2019
Weekly Indicators for December 16 - 20 at Seeking Alpha
- by New Deal democrat
My Weekly Indicators post is Up at Seeking Alpha.
Are we just having a slowdown, or actually slipping into contraction? The short leading indicators would like to have a word.
As usual, clicking over and reading should bring you up to the moment on the economy, and rewards me a little bit for my efforts.


Friday, December 20, 2019
The consumer vs. producer divergence widens at year end
- by New Deal democrat
My economic theme for about the past half year has been the contrast between the floundering producer sector vs. the decent consumer sector. With two of the last important reports of the year out this morning, that divergence has been highlighted.
First, the good news: real personal income rose +0.4% in November, and real personal spending rose +0.3%. Here’s a look at the past five years:
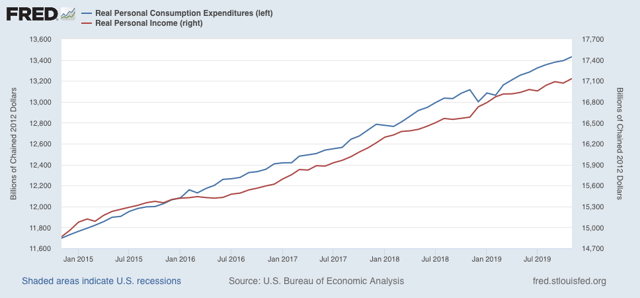
No perceptible slowdown here!
But now, let’s look at the producer side, where the Kansas City Manufacturing Survey was the last of three regional surveys to be reported this week. Here is the moving monthly average of all five regions that I update in my weekly post:
Regional Fed New Orders Indexes
(*indicates report this week)
- *Empire State down -2.9 to +2.6
- *Philly up +1 to +9.4
- Richmond down -10 to -3
- *Kansas City down -13 to -16
- Dallas up +1.2 to -3.0
- Month-over-month rolling average: down -3 to -2
Today marks the very first time all year that the average of all five actually crossed into negative territory. This does not bode well for the December ISM manufacturing survey in particular, and for the manufacturing sector going forward into 2020 in general.
To conclude 2019: the consumer is alright. The producer, not so much.
Thursday, December 19, 2019
Political leanings through time for birth cohorts
- by New Deal democrat
A chart on “political preferences by generation” from Pew Research has been making the rounds in the past few days. Here it is:
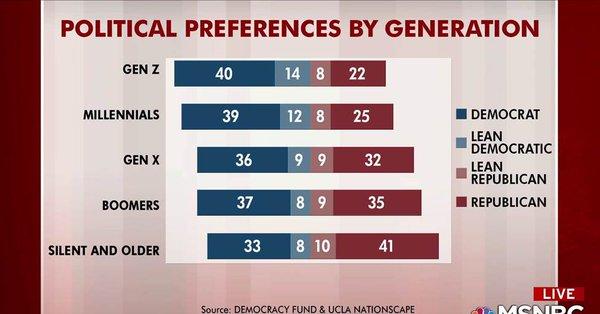 This chart tells the simplistic story that older generations are more conservative than young ones. It’s considerably misleading.
After all, how did the democrats ever win if older generations, who vote in higher percentages, are always more conservative than younger ones? The answer is, it’s not true.
Although Pew’s chart does not show the now-passed “greatest generation,” the simple fact is, that generations which came of age during the Great Depression and World War 2, and revered FDR, voted Democratic their whole lives.
As I’ve posted before, better way of looking at political preferences is to consider who was President during their teenage years. Because people tend to form their basic ideologies in their later teenage, or college years, and stick to it for the rest of their lives.
That is shown by this striking graph, of the evolution of political ideology over time for each birth year, from The Upshot today. The large circles show the ages and voting preferences for each year’s birth cohort as of the last election:

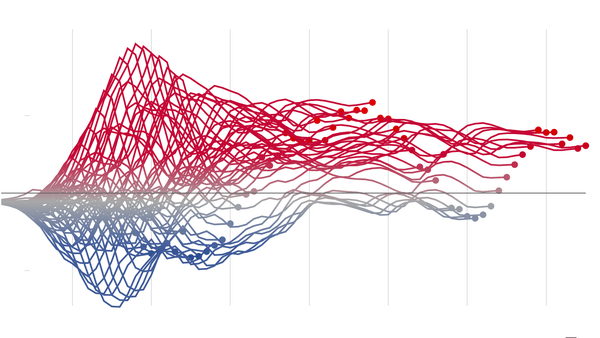
All of a sudden, that inexorable conservative drift with age disappears. Rather, people born during the LBJ and Nixon presidencies shifted ever bluer compared with those born before. Those who formed their ideologies during the unpopular Carter presidency, or during the Reagan years - basically, late Boomers and at the first half of Gen X - became the most conservative of all.
Over the next decade, as the oldest cohort dies off and the blue cohorts who formed their ideologies during the Clinton years and later vote in higher percentages, we can expect the electorate to turn more Democratic. But then, when the blue mid-Boomer contingent passes from the scene, over the next 15-20 years, the most conservative cohort of all, who have always worshipped at the altar of St. Ronnie, will also become the highest voting contingent of all.
A yellow flag for initial jobless claims
- by New Deal democrat
As you know, I’ve been monitoring initial jobless claims closely for the past several months, to see if there are any signs of a slowdown turning into something worse. Simply put, if businesses aren’t laying employees off, those same people are consumers who are going to continue to spend, which is 70% of the total economy. So the lack of any such increase has been the best argument that no recession is imminent.
This morning’s report of 234,000 initial claims is enough to put us over the threshold to a “yellow flag,” but historically still has more often coincided with slowdowns rather than recessions.
To reiterate, my two thresholds for initial claims are:
1. If the four week average on claims is more than 10% above its expansion low.
2. If the YoY% change in the monthly average turns higher.
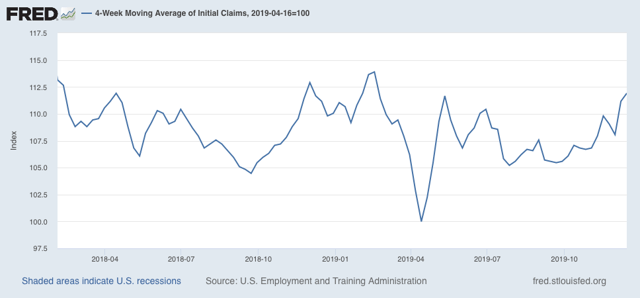
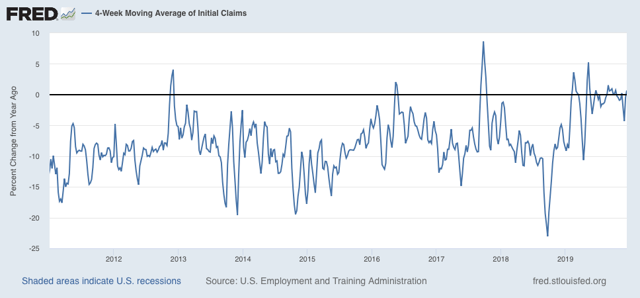
Aside from last week’s 252,000 claims, this week was the weakest but for two weeks since January of 2018. As a result, the 4 week moving average of claims has risen to 225,500, and is 11.9% above the lowest reading of this expansion, which occurred back in April:
On a YoY% change basis, the 4 week average is 1,500, or 0.7%, higher:
For the first two weeks of December (blue in the graph below), the average is 243,000 vs. 223,200 for the entire month of December last year (red), or higher by 9.0%, while on direct comparison with the first two weeks of last December, they are higher by 12.2%:
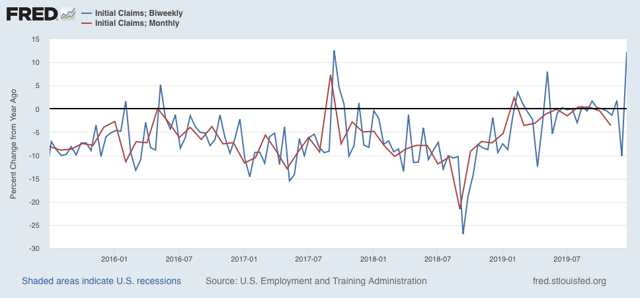
In short, pending the completion of December for a direct month to month comparison, both thresholds for initial claims have been met this week.
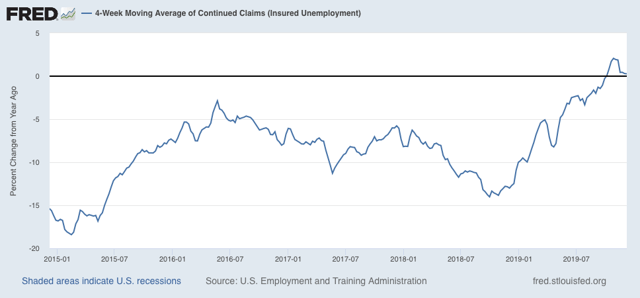
Meanwhile, the less volatile 4 week average of continuing claims is 0.3% above where it was a year ago:
Here is the longer term graph:
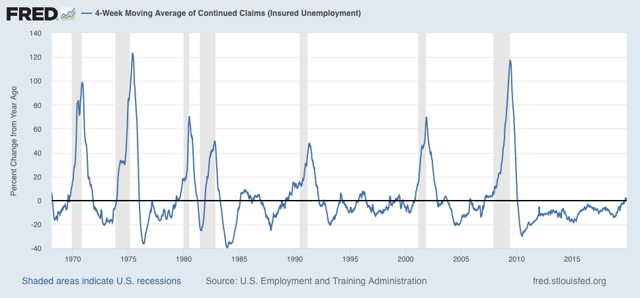
The four week average of continuing claims, while cautionary, is consistent with a significant slowdown. But there have been similar readings in 1967, 1985-6, 3 times in the 1990s, and briefly in 2003 and 2005, all without a recession following. So the threshold for continuing claims being a negative (vs. neutral) has not been met.
Several weeks ago I wrote that “unless initial claims start to be reported in the 230’s, and continuing claims continue to trend higher, into the 1.770 million range (by mid-December, after which the YoY comparisons for continuing claims get much easier), no interim recession will be signaled.”
For the last two weeks, both numbers have been in the 230’s or higher, and 4 of the last 6 weeks have been above 225,000. Because continuing claims have not climbed meaningfully higher, and because we still have two weeks left in December, there is no red flag.
For the record, if the four week average of claims is more than 12.5% higher than their low, that will be a red flag. If they move more than 15% higher, and the YoY changes are higher for two months in a row, that would mean a near-term recession were almost certain.
For the last two weeks, both numbers have been in the 230’s or higher, and 4 of the last 6 weeks have been above 225,000. Because continuing claims have not climbed meaningfully higher, and because we still have two weeks left in December, there is no red flag.
For the record, if the four week average of claims is more than 12.5% higher than their low, that will be a red flag. If they move more than 15% higher, and the YoY changes are higher for two months in a row, that would mean a near-term recession were almost certain.
But we have just enough as of this week to move this short leading indicator to a yellow flag, I.e., from neutral to weakly negative.
Wednesday, December 18, 2019
October JOLTS report shows soft patch in employment
- by New Deal democrat
Let’s take a look at yesterday morning’s JOLTS report for October. I thought I’d start off this month by stepping back and comparing the monthly change in employment from the jobs report (red) with the monthly total of hires minus total separations from the JOLTS report (blue), going all the way back to the beginning of the latter series in 2001:
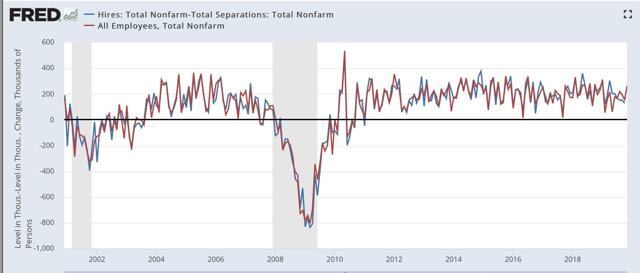
Note that the monthly changes are almost always very close.
Here is a close-up of the past few years:
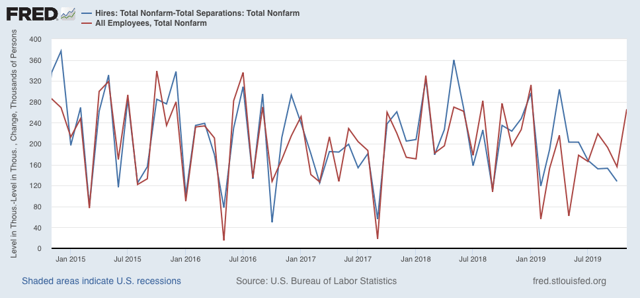
By contrast, since April of this year the series have diverged significantly. I’m not sure what the reason is, but it is something to keep an eye on.
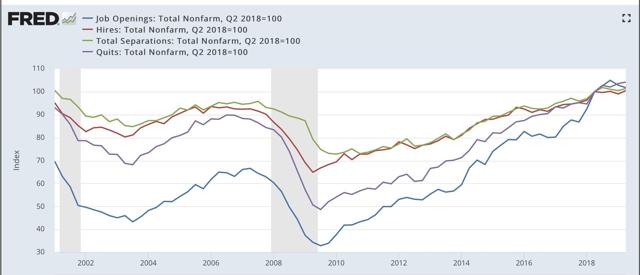
Next, let’s review the order in which the JOLTS series peaked during the 2000s expansion:
- Hires peaked first, from December 2004 through September 2005
- Quits peaked next, in September 2005
- Layoffs and Discharges peaked next, from October 2005 through September 2006
- Openings peaked last, in April 2007
as shown in the below graph (quarterly, normed to 100 as of May 2018):
Here is the close-up on the past few years (monthly), normed to 100 as of August 2018:
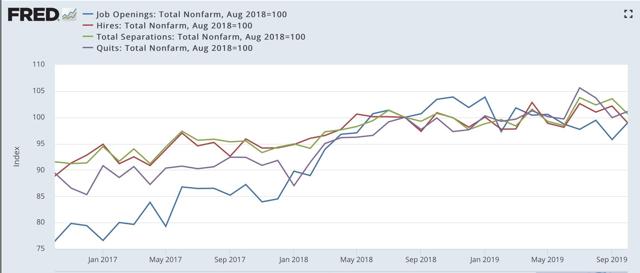
In the past 14 months, with the exception of job openings, these series have essentially gone sideways, with job openings and hires both below their levels then, and quits and separations only slightly (1.1% and 0.6%) higher, respectively.
Here is the same data tracked YoY, first quarterly since 2001:
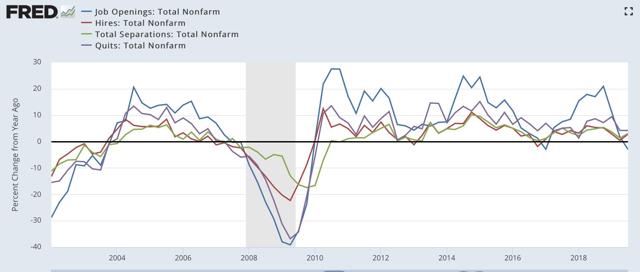
Note that hires and total separations turned negative YoY first, in Q1 2007, followed by quotes and openings in Q3.
And now focused on the past five years:
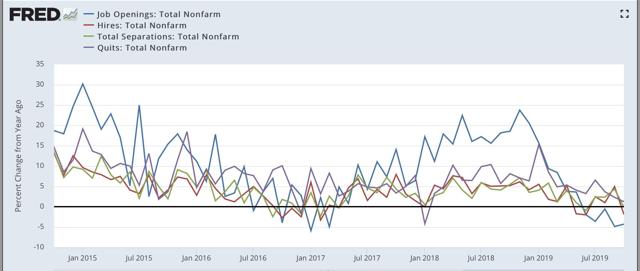
The soft patch during the shallow industrial recession of 2015-16 is evident. The current soft patch is not quite so negative.
Finally, For completeness’ sake, below are total layoffs and discharges (blue). Note that these turned up appreciably in the six months or so before the Great Recession. This month I thought I would compare them with initial jobless claims (averaged monthly, red) to compare which gives better signals of turning points:
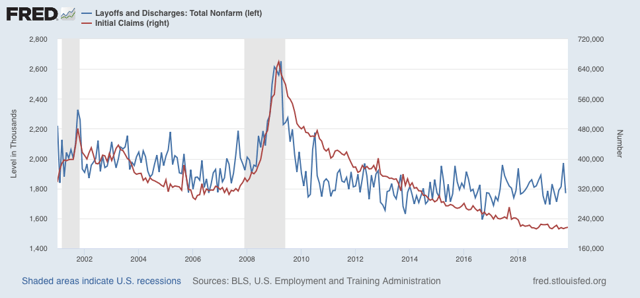
As you can see, both peaked at the same time near the end of the last two recessions, but initial claims are much less noisy in the lead-up to recessions, and so are the better indicator.
Because November’s jobs report was so strong, I am expecting a better JOLTS report next month. In the meantime, the soft patch in the employment market is evident.
Tuesday, December 17, 2019
Live-blogging the Fifteenth Amendment: December 17, 1868
- by New Deal democrat
In the Senate, Senators Dixon and Ferry, both Republicans from Connecticut, continued the debate from several days prior concerning a federal imposition of African-American voting rights on the States:
Dixon:
[M]y colleague ... proposes to amend the Constitution of the United States in a manner which to me is very revolting, not because I hate negro suffrage, but, sir, I do desire that the proud old State of Connecticut, shall not be humbled in the dust. Having enjoyed the right of suffrage and of regulating her own right of suffrage for over two hundred years — longer, I believe, than any State in the Union — I do not desire that at this late day she should be compelled to submit to the demands ... of any other State with regard to who shall vote within her borders . . . .
Ferry:
With regard to an amendment to the Constitution of the United States removing the distinctions of color now existing in different States of the Republic I had certainly hoped that my colleague would be willing to stand side by side with me in the support of it. I know that he had twice in my State voted with me for a constitutional amendment there to extend the franchise to the negro; and I ask what difference is there between an amendment to the constitution of my State and an amendment to the Constitution of the United States for the purpose of accomplishing the same object? . . . .
Dixon:
I prefer leaving it to the State of Connecticut to decide for herself; and that was the substance of Dr. Bacon’s letter. He said he was in favor of negro suffrage, but preferred that the negroes should never vote rather than that negro suffrage should be forced upon Connecticut by act of Congress; and you may say the same thing of an amendment to the Constitution of the United States.
[ Source: Congressional Globe, 40th Congress, 3rd Session, pp. 123-124, Appendix, p. 50 ]
The above exchange highlights what Dr. Foner refers to in his book “The Second Founding.” For the proponents of the Fifteenth Amendment were proposing that the Federal government be given the right to demand and enforce voting rights in the States, which was anathema not only to most Jacksonian Democrats, but also to some anti-slavery Republicans as well.
————
December 7, 1868
————
Previous installments:
November housing and production both up sharply
- by New Deal democrat
We got two of our final most important reports of 2019 this morning. Both were positive, one strongly so.
Starting with the best and most forward-looking news, housing permits and starts both improved strongly in November:
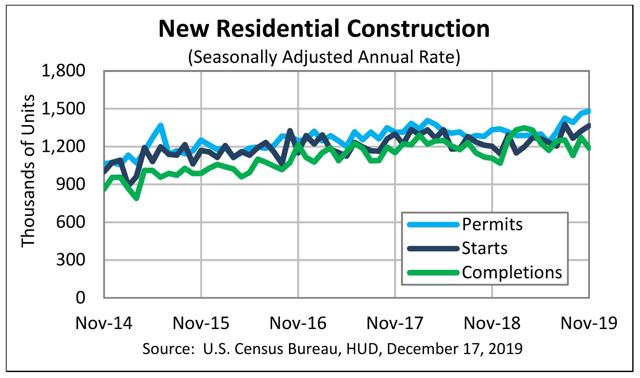
I’ll have a more detailed report up at Seeking Alpha later today, and I’ll link to it here once it’s up. The bottom line is that lower interest rates have re-ignited the housing market, and that good news is going to flow through the economy in 2020. [UPDATE: Seeking Alpha article is up here ]
Industrial production, the King of coincident indicators, was also up a sharp +1.1% in November (blue in the graph below). Most of that was the end of the GM strike, but even without that, production was up +0.6%:
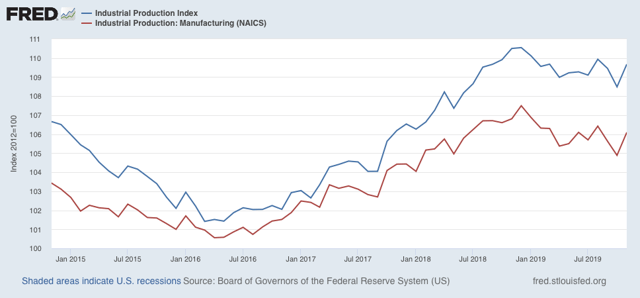
One important drawback in this number, though, is that manufacturing production, while up for the month, is still lagging (red in the graph above) and if anything, appears to still be in a slight downtrend.
All in all, this tells us that right now we are in a shallow manufacturing recession, but that the situation in the economy overall should improve as we head out of winter towards summer next year.
Monday, December 16, 2019
The oncoming generational UK and US political tsunamis
- by New Deal democrat
No big economic news today, so let me put up a couple of striking charts about the UK election last week.
First, the change in party results in 2019 (left) vs. 2017 (right) in millions:
Tories: 13.9. 13.6
Labour: 10.3. 12.9 (a 20% decline!)
Lib Dems: 3.7 2.4
SNP: 1.2 1.0
Total turnout was down 1.5%. As should be obvious, as the accompanying commentary said, the Tories didn’t win; Labour lost, and terribly. Apparently having a leader (Jeremy Corbyn) with a -44% approval rating, and no substantive position at all on the most important issue in decades, Brexit, was a loser. Hoocoodanode?!?
Second - and this is really stunning - which party won seats based on age group:
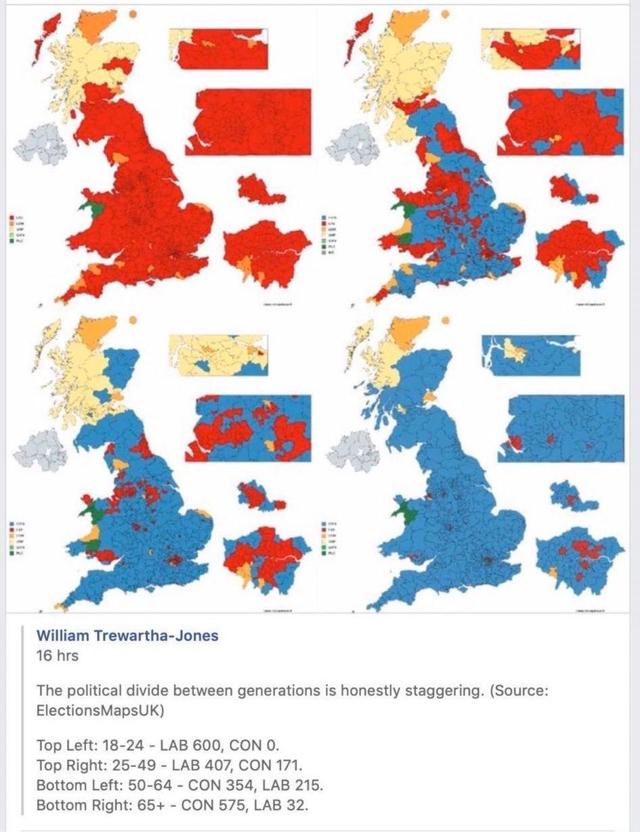
The conservatives won precisely *zero* seats among the youngest voters.
Meanwhile Labour won only 32 seats among the oldest.
More generally, there was a Labour landslide among voters under 50. But an even larger Conservative landslide among voters 50 and older. One caveat: I don’t know the source for this information, because voting is of course anonymous. Probably the information comes from exist polls, so take with a few grains of salt.
Since people tend to form their basic political ideologies in their later teens or early twenties, at some point - probably within the next 10 years - there is likely to be a political tsunami in the UK sweeping away right wing economic policies.
That made me go look for a similar breakdown of the 2018 US Congressional elections. The below graph is the closest thing I found:
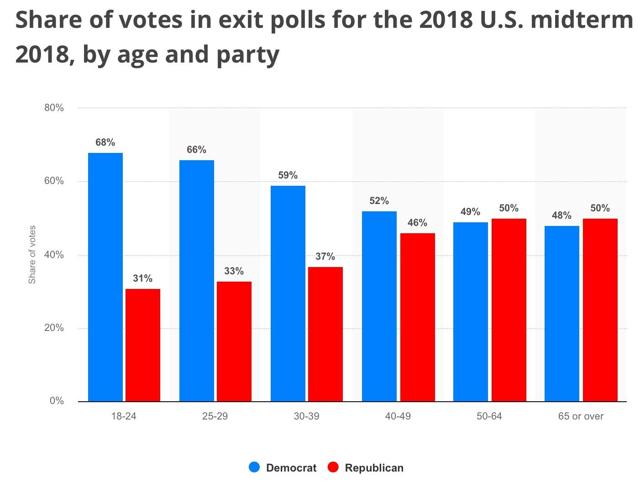
Interesting that the inflection point seems to be at age 50 in the US as well. People who formed their political views in the Reagan era or earlier in the US, and the Thatcher era and earlier in the UK, skewed conservative, while those whose views were formed later skewed to the left.
In the UK, the immediate risk is that the union itself ruptures, with Scotland and possibly Northern Ireland as well leaving. In the US, the risk is a rupture of the Constitutional fabric, by way of heightened mutual “hardball” and political violence, and a significant chance of a slide into Presidential autocracy.
Sunday, December 15, 2019
Live-blogging the Fifteenth Amendment: December 15, 1868
- by New Deal democrat
Sen Orrin S. Ferry (R-Conn), in the course of offering a joint resolution to lift the disabilities mandated by the 3rd Section of the Fourteenth Amendment against those who participated in the rebellion:
[I]t does seem to me as if the experience of the last fifty years ought to enlighten us as to the chimerical character of the dangers which have been apprehended from the extension of suffrage and to eligibility to office at one time and another.
It has been thought once, even in this land, that poverty disqualified a man from voting, and no man, unless he was the owner of property, was permitted to exercise the suffrage. Time went on; the property qualification disappeared; and nowhere are the law and order more respected, are person and property more secure than in those communities where suffrage is most universal and government rests upon the broadest foundation.
It has been thought that dangers might assail us in the influx of the enormous immigration from the Old World, and a great party was once organized upon that very apprehension. The fear has passed away, for time and experience have demonstrated that the evils accompanying that immigration are but temporary, and will pass away in a single generation.
The time has been when the negro was a beast of burden, and nothing else. The time is now when good men too often apprehend the danger of the extension of the suffrage unto him be reason of the ignorance which is the result of centuries of slavery; but it is beginning to be seen by the practical operation of the laws extending suffrage [mandated by the Congress in the constitutions of reconstructed States], that all these fears are chimerical, and that the black man as well as the white is an element of strength and prosperity in civil society.
In support of the resolution, Sen. Willard Warner, a union general, who moved from Ohio to Alabama after the war, and was elected to the Senate from Alabama in 1868, argued that a Republican-controlled legislature in Alabama had removed the disabilities to those who had engaged in rebellion, but that even after that, Republican candidates had triumphed in the next election.
To which, Garrett Davis, a unionist KY Democrat, replied:
[S]uppose there was no military force moving from this center, this capital, and from States and places outside of Alabama, what would become of the honorable Senator’s negro government and of his representation of it in this body? I am inclined to think they would be fugitives from it.
.... I will never consent that the Congress of the United States shall vote to force negro suffrage upon the State of Alabama or the State of Kentucky or any other State; and I assert that Congress has not a vestige of power to enforce such a constituency upon the people of any State.
The honorable Senator [Warner] ... seems to be very much enamored with the idea of negro suffrage, and he seems to think that I and my political party are responsible for the non-existence of that political power in the other States. Who voted down negro suffrage in Kansas? Who voted down negro suffrage in Ohio? Who voted down negro suffrage in Michigan, but the honorable Senator’s political friends.... Now, when Ohio by more than forty thousand, Kansas by eight or ten thousand, Michigan by twenty or thirty thousand, all the northern States, where there are no negroes to vote, voted down the principle of negro suffrage by such immense majorities, with what grace can they or their southern auxiliary, the Senator from Alabama, vote to force negro suffrage upon the ten southern States, under the principle of the Constitution of the United States that the people of a State have the sole and exclusive power of framing their own governments.
As Davis pointed out, when it came to their own States, northern States had refused to grant to African-Americans the right to vote. That a majority of their own constituents did not actually believe in racial equality, but that the effects of the Fifteenth Amendment would overwhelmingly be felt in the South, has to be taken into account when considering why the Amendment wound up being more narrowly crafted.
Saturday, December 14, 2019
Weekly Indicators for December 9 - 13 at Seeking Alpha
- by New Deal democrat
My Weekly Indicators post is up at Seeking Alpha.
Every time I am tempted to remove my “recession watch” for this quarter through mid-year 2020, more data shows up that is at very least not inconsistent with a recession having actually started a month or two ago.
To find out what I am talking about, go click over and have a read. As usual, it should be useful for you, and it helps reward me a little bit for my efforts.
Friday, December 13, 2019
November real retail sales show consumption still weakly positive
- by New Deal democrat
Retail sales are one of my favorite indicators, because in real terms they can tell us so much about the present, near term forecast, and longer term forecast for the economy.
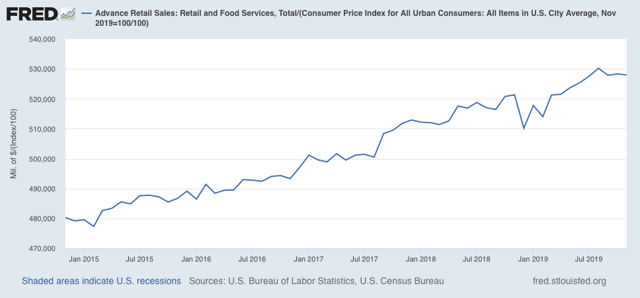
This morning retail sales for November were reported up +0.2%, while October was also revised up +0.1%. Since consumer inflation increased by +0.3%, however, real retail sales were down less than -0.1%. Real retails sales remain slightly below their August peak.
Here is what the longer term absolute trend looks like.
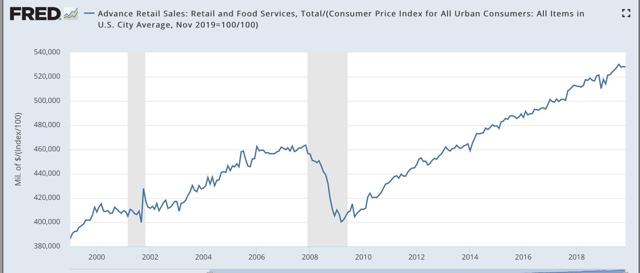
A closer view shows that the last three months’ decline remains well within the range of noise:
A closer view shows that the last three months’ decline remains well within the range of noise:
Others may use other deflators. I use overall CPI because:
1. I’ve been doing it this way for over 10 years.
2. This is the deflator used by FRED.
3. It has a 70+ year history.
4. Over that 70+ year history, it has an excellent record as a short leading indicator for employment and recessions. That’s the kind of track record I like.
Further, although the relationship is noisy, real retail sales measured YoY tend to lead employment (red in the graphs below) by about 4 to 8 months. Here is that relationship over the past 20 years:
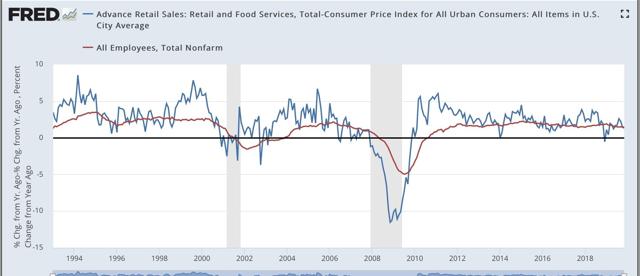
The recent peak in YoY employment gains followed the recent peak in real retail sales by roughly 6 months, and the downturn in real retail sales at the end of last year has already shown up in weakness in the employment numbers this year, as shown in this shorter term view of the past 5 years (note change of scale in payrolls better to show the changes):
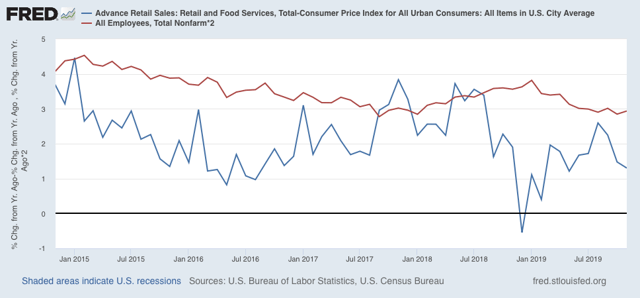
Similarly even with the recent small decline at least stabilization in the employment numbers by about next spring.
Similarly even with the recent small decline at least stabilization in the employment numbers by about next spring.
Finally, real retail sales per capita is a long leading indicator. In particular it has turned down a full year before either of the past two recessions:
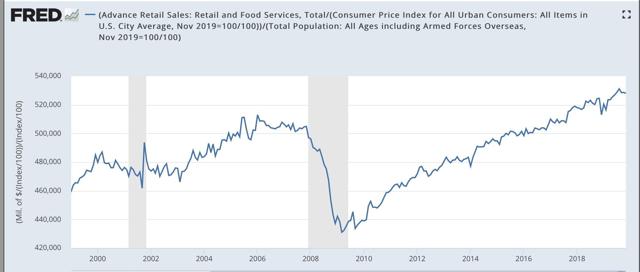
In the last 70 years, with the exception of 1973 and 1981 this measure has always turned negative YoY at least shortly before a recession has begun:
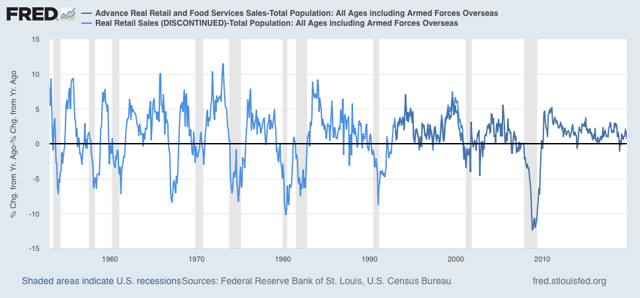
Thus this is a quite reliable indicator, and with this result still being up +0.7% YoY, it is not flagging any imminent recession.
To summarize, this is a small decline from a peak three months ago. On the positive side, it is not enough for me to change this indicator to neutral, although it is enough to downgrade it to a weak positive. I will need at very least one more month without making a peak, or a more serious decline, to downgrade this indicator. On the negative side, together with yesterday’s poor weekly jobless claims number, if there is further confirmation, it *could* mark the beginning of the spread of contraction from the manufacturing sector into the consumer sector that I have been worried about.
Thursday, December 12, 2019
Off topic: two solutions to home delivery theft
- by New Deal democrat
By now we all know that theft of packages delivered to people’s home doorstep is a big problem. Here are pictures of two solutions:
1. Massive 1984-style and easily hackable home monitoring. Or even worse, the ability of the delivery person to open the homeonwer’s garage to leave the package inside.

2. A large 1950’s style milkbox:

For those of you who may not know what I am talking about, the milkbox was built into the side wall of a garage and had doors that could be opened and locked from the inside on each side.
The homeowner unlocked the outside door. When the milk was delivered and the milkman closed the outside door, it would lock from the inside. When the homeowner wanted to retrieve the milk, they opened the inside door.
Make the box wider to accommodate larger sized packages. Problem solved.
Initial claims turn neutral on seasonality, but no red flag
- by New Deal democrat
As you know, I’ve been monitoring initial jobless claims closely for the past several months, to see if there are any signs of a slowdown turning into something worse. Simply put, if businesses aren’t laying employees off, those same people are consumers who are going to continue to spend, which is 70% of the total economy. So the lack of any such increase has been the best argument that no recession is imminent.
This morning’s report of 252,000 initial claims is enough to signal a caution, but historically has more often coincided with slowdowns rather than recessions.
To reiterate, my two thresholds for initial claims are:
1. If the four week average on claims is more than 10% above its expansion low.
2. If the YoY% change in the monthly average turns higher.
This week’s reading of 252,000 was the weakest since September of 2017. As a result, the 4 week moving average of claims has risen to 224,000, is 11.2% above the lowest reading of this expansion, which occurred back in April:
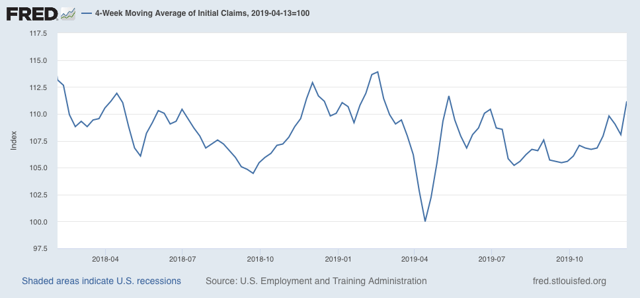
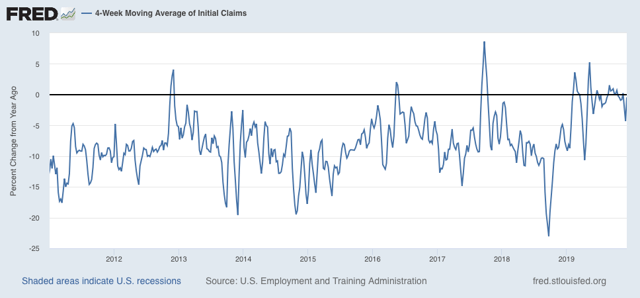
Nevertheless, on a YoY% change basis, the 4 week average is still slightly below, as in by 1,000 or -0.5%, its level one year ago:
For the first two weeks of December (blue in the graph below), the average is 226,000 vs. 223,200 for the entire month of December last year (red), or higher by 1.3%, while on direct comparison with the first two weeks of last December, they are higher by 4.4%:
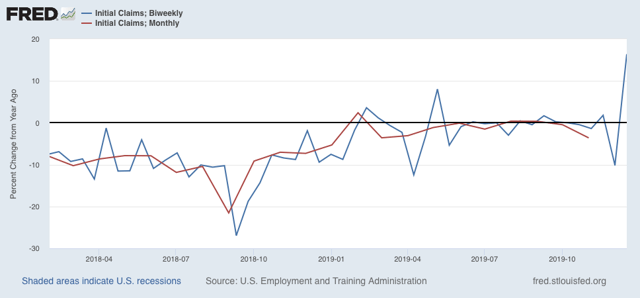
Both thresholds for concern - extra watchfulness - have been met.
Meanwhile, the less volatile 4 week average of continuing claims is 0.2% above where it was a year ago:
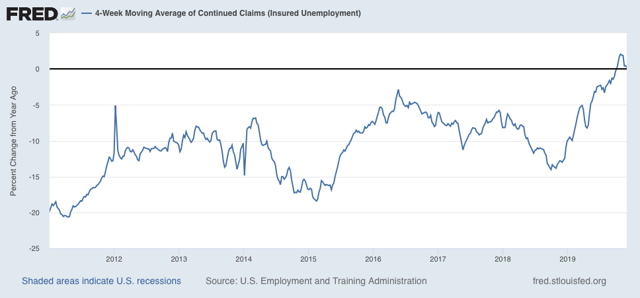
Here is the longer term graph:
Again, this certainly is cautionary, and is consistent with a significant slowdown. But there have been similar readings in 1967, 1985-6, 3 times in the 1990s, and briefly in 2003 and 2005, all without a recession following. So the threshold for continuing claims being a negative (vs. neutral) has not been met either.
Several weeks ago I wrote that “unless initial claims start to be reported in the 230’s, and continuing claims continue to trend higher, into the 1.770 million range (by mid-December, after which the YoY comparisons for continuing claims get much easier), no interim recession will be signaled.” Last year we also saw some seasonal weakness in initial claims, even before the government shutdown, so one bad week is not enough reason for a fundamental change of opinion beyond turning neutral. So it will take several more weak weeks of readings in the 230’s or worse for initial claims to raise a red flag.
Wednesday, December 11, 2019
November average real wage growth stable, but aggregate growth now puts expansion in second place behind 1990s
- by New Deal democrat
November consumer inflation came in at +0.3%. Since in last Friday’s jobs report average hourly earnings also increased +0.3%, real average hourly earnings were unchanged:
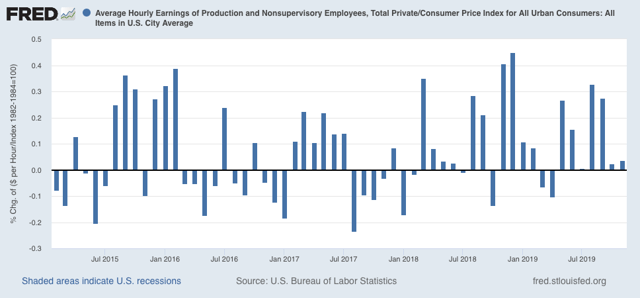
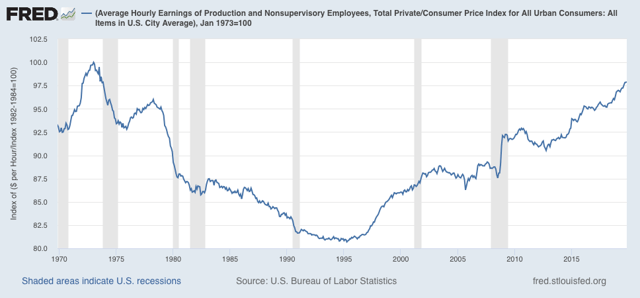
In a longer term perspective, this means that real wages remain at 97.9% of their all time high in January 1973:
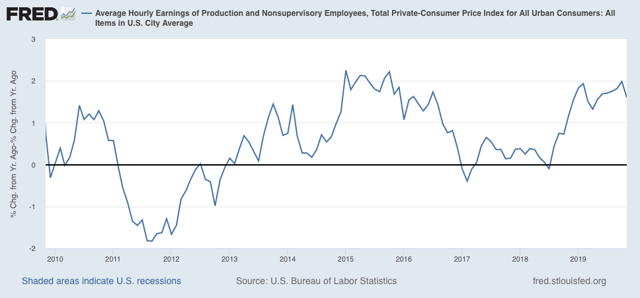
Since in November 2018 consumer inflation came in a 0%, the YoY measure of real average wages declined from +2.0% to +1.6%:
Aggregate hours and payrolls have improved significantly since July, so even though they declined -0.1% in October, real aggregate wages - the total amount of real pay taken home by the middle and working classes - are up 30.4% from their October 2009 trough at the beginning of this expansion:
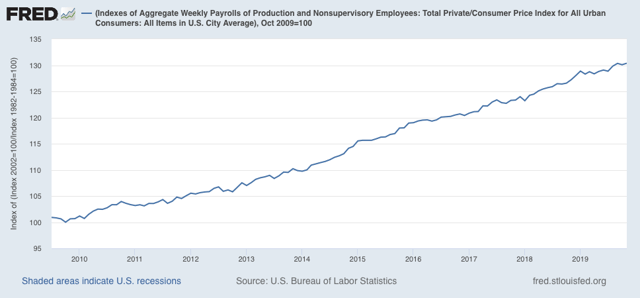
As of this month, in terms of total wage growth, this expansion rises to second place, ahead of the 1960s (dated from January 1964 when record-keeping began) but still below the 1990s peak of +33.9%. Nevertheless the *pace* of wage growth has been the slowest except for the 2000s expansion.
This year, 2019, has really been a boon for labor. Labor force participation has increased, undemployment and underemployment have made new lows, and somnolent gas prices combined with accelerating nominal wage growth have meant that real average and aggregate wages have risen strongly. I suspect this will mark the “sweet spot” for average middle and working class Americans from this expansion, as YoY consumer inflation ex-gas has risen back to +2.3% YoY (red in the graph below):
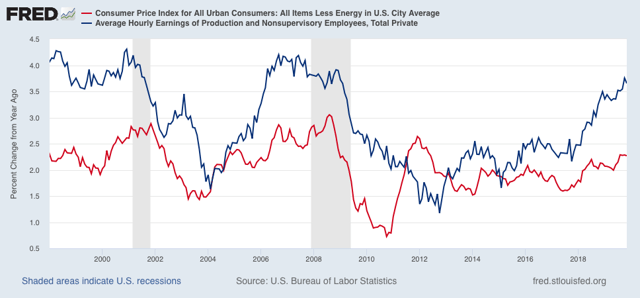
Should this rising inflation trend continue, along with strong nominal non-managerial wage increases (blue), the Fed is going to want to raise rates again.
Tuesday, December 10, 2019
Live-blogging the Fifteenth Amendment: December 10, 1868
- by New Deal democrat
In the Senate, the two proposals for a Fifteenth Amendment to the Constitution were referred to the Judiciary Committee.
In the House of Representatives, Rep. James G. Blaine made the following speech (in relevant part):
And now that victory, complete and unsullied, has been won [in the elections of 1868], ... it may not be unprofitable . . . to make a brief summary of the points that have been solemnly adjudicated and permanently settled by the American people in the election of General Grant to the presidency.
.... The election of 1868 is the last in which the lately rebellious section, even if it could be wholly controlled by rebels, will have sufficient power in the electoral vote in the country to make it the object either of hope or fear on the part of political organizations striving for the government of the nation. . . . . The withdrawal of northern Democratic support for these [ten rebel] States will give to the loyal inhabitants, who are a clear majority in each of them, the power of governing them in the interest of loyalty . . . . The Union was actually saved by General Grant’s actions in the field. The menace of its destruction ceases with his victory at the polls.
[ ] The reconstruction laws of Congress have been vindicated and sustained by General Grant’s election. The State governments created under those laws will be upheld and the basis of impartial loyal suffrage, without regard to race or color, will be accepted as the permanent rule in the lately rebellious States, as it will be at no distant day throughout the entire Union. This result is certain to be achieved either through the amelioration of prejudice and the conquering force of justice in the individual States or by the comprehensive influence of a constitutional amendment which shall affect all the States equally and alike. . . . The rebellious element in those States, seeing the hopeless folly of longer resisting the mandate of the nation, will acquiesce in the decision, if with no better grace than merely accepting the inevitable. .... The better minds even among the rebel leaders recognize and admit that as a question of practical statesmanship it is too late to discuss negro suffrage; for having been granted it is impossible to recall it. Between originally withholding a franchise from large masses of people and annulling it after it has been conceded, wise men can see a vast difference . . . . So that even excluding from the case the abstract and unchanging element of justice which underlies it, it is demonstrably impracticable to withhold suffrage from the southern negroes now that they have exercised it, without involving consequences which would would destroy all security for life or property in that section for generations to come. Negro suffrage then [has] be[en] of necessity conceded . . . .
[Source: Congressional Globe, 40th Congress, 3rd Session, pp. 43, 57-58]
With the hindsight of 150 years, Congressman Blaine’s triumphalism can be seen as wildly overoptimistic to say the least. But he was hardly alone. The writings of Frederic Douglass at the time have the same triumphal tenor. As it turned out “Negro suffrage” wasn’t conceded at all, as the low level guerrilla insurgency by the KKK and others in the South ultimately wore down northern Republicans, most of whom may have abhorred slavery but did *not* believe in actual racial equality.
Note also, however, that Blaine’s speech completely cuts the feet out from beneath Chief Justice Roberts’ holding in Shelby County that there is some amorphous and inchoate requirement in the Constitution that all States be treated equally. As Blaine pointed out, States undergoing reconstruction were treated far differently than the others, including other slave States, as it was mandatory that their constitutions enshrine black suffrage, whereas, e.g., the loyal slave States of Maryland, Kentucky, and Missouri faced no such obligation.
Previously: December 7, 1868
Scenes from the November jobs report 2: participation and wages
- by New Deal democrat
Yesterday I looked at the leading sectors of employment from the establishment jobs report. Today let’s look at labor force participation and wage growth.
There was no significant change in either prime age labor force participation or employment from October to November. In the below graph, both November readings are normed to zero so that only better rates of participation and employment show as positives. The graph dates from the end of the 1980s, when women’s entry into the labor force was close to completion:
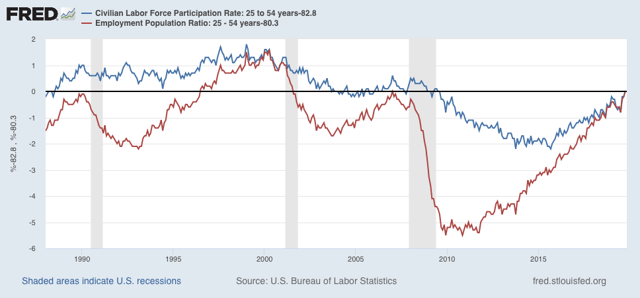
The prime age employment to population ratio for prime age workers is better than either the 1990 or 2007 peaks, but about 1.6% lower than the late 1990s boom. But participation still lags all three peaks.
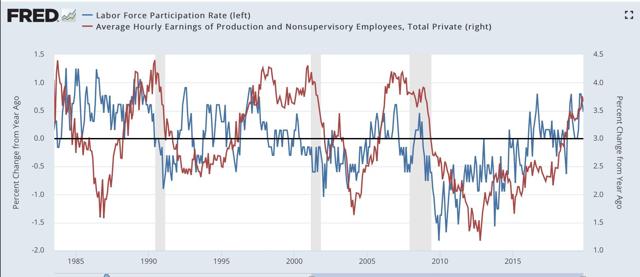
On the other hand, the *YoY growth* in participation for November was +0.5%, among the strongest rates sine the mid-1990s:
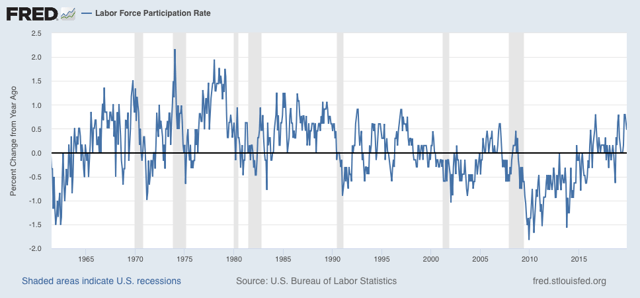
Note the huge bulge in the 1960s and 1970s as the baby boom, and women, entered the work force in droves. Some of the strong growth in this metric that has appeared over the past 5 years is the result of the equally large Millennial generation entering the market and offsetting retiring Boomers.
As shown in the next graph below, YoY wage growth lags YoY participation growth. On a more “micro” scale, large bumps in participation (e.g., the mid-1980s, early 1990s, and 2016) have frequently (not always!) tended to be associated with lags in wage growth, as short term increased competition for employment openings eases wage demand.
But on a cyclical and secular scales, another part of the story of the lag in participation is the deceleration in wage growth. Nominal wage growth is one of the very few *long lagging* indicators, I.e., it does not bottom out until the U6 underemployment rate falls to about 8% (not shown):
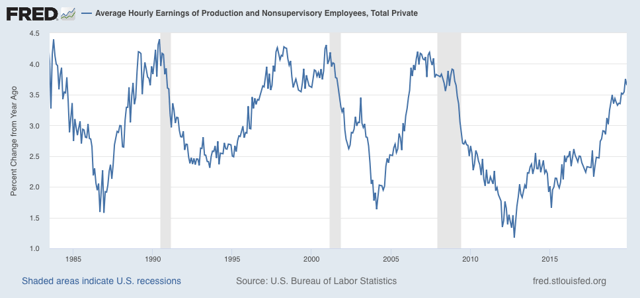
In the past 40 years, wage growth has tended to peak in the 4.0%-4.5% range for each expansion. So far non-supervisory wages have increased at most 3.8% YoY in this expansion:
Finally, let’s compare nominal non-supervisory wage growth YoY (blue) with consumer inflation (red):
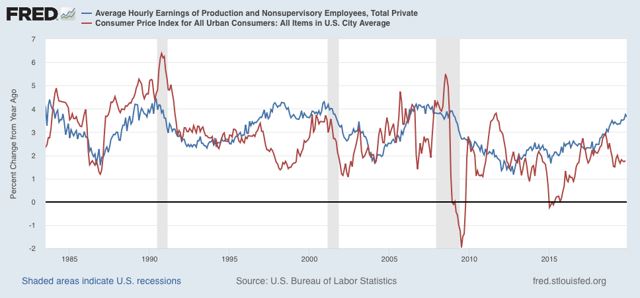
Both slowdowns and recessions have typically occurred in the past 40 years when inflation is nearly equal to or exceeds nominal wage growth. We briefly had that in 2018, due to an increase in gas prices, but 2019 has been a rare occasion of accelerating nominal wage growth an decreasing inflation (again, due to somnolent gas prices).
[Aside: stories you are reading about how wage growth has subsided are citing wages that include supervisors and managers. The slowdown in growth there has everything to do with managerial employees, and not non-supervisory employees.]
Tomorrow we will get November inflation data. The signs are that gas prices are picking up again, so I expect an uptick in inflation as well.
Monday, December 9, 2019
Scenes from the November jobs report
- by New Deal democrat
Let’s take a more detailed look at last Friday’s November jobs report, in particular a discussion of the more leading sectors.
First, let’s update the three leading sectors of employment that I have been tracking: temporary help (blue in the graph below), manufacturing (gold), and residential construction (red). Here’s what they look like compared with 2018, showing the slowdown this year (Note: the big decline in manufacturing in October was the GM strike, which as expected was reversed in November):
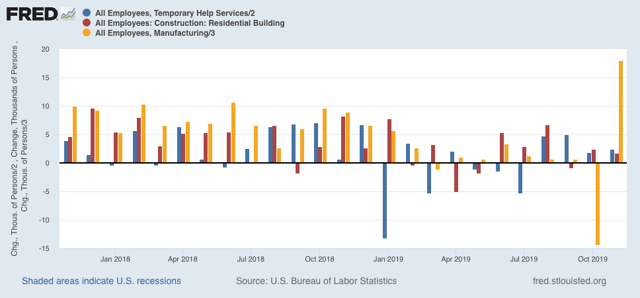
Residential construction looks like it has rebounded from its losses earlier this year, more confirmation of the rebound in the long leading housing sector.
As for temporary help, it continues to defy the gloomy weekly statistics that have been worsening this year in the American Staffing Association report. On the other hand, the pattern of downward revisions has persisted. This year there have been almost relentless downward revisions in that number. That pattern was mixed for September and October, as the downward revisions in the first were almost exactly matched by the upward first revision to the latter. Below are the original number for the last four months on the left, followed by the first and then final revisions to the right:
JUL +2200 -7300* -10,500
AUG +15,400 +14,500 +9,500
SEP +10,200 +20,100 +9,900
OCT -8100 +3800*
NOV +4800
*1st revision only
Next, the average manufacturing workweek remains down 0.9 hours per week YoY from its peak. Although I only show data from 1983 onward below, going back 70 years there have only been 2 occasions where such a decline lasted longer than one month without a recession happening (1953 and 1966). In the modern era shown, only in 1985 and 1995 for one month apiece were there 1 hour declines without a recession following. A look at the YoY% change in manufacturing hours for the past 35 years also shows that such losses have *always* led to actual YoY losses in manufacturing jobs:
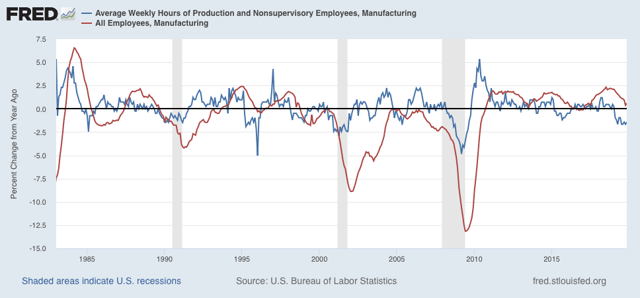
So, despite the rebound in November, we should expect more and significant actual losses in manufacturing jobs going forward. And, like temporary help, the revisions for manufacturing employment have all been downward for six of the past seven months:
APR +4. +3 (-1)
MAY +3 +2 (-1)
JUN +17 +10 (-7)
JUL +16 +4 (-12)
AUG +3 +2 (-1)
SEP -2 +2 (+4)
OCT -36 -43 (-7)*
NOV +54
*1st revision only
For the first 11 months of 2019, manufacturing has only added 34,000 jobs.
More broadly, since January of this year, only 97,000 jobs have been added in the entire goods-producing sector:
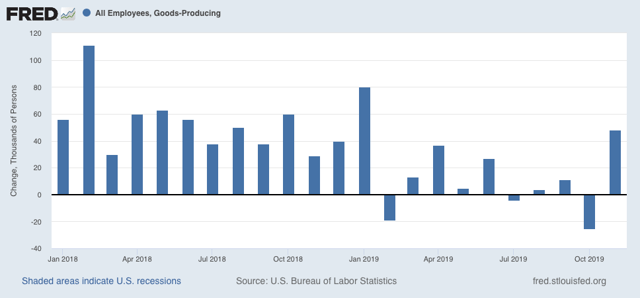
Further,there have been YoY losses in goods-producing jobs before all of the past 3 recessions, and going back 70 years, counting 12 recessions, in all but 3 there has been steep deceleration before and actual losses no later than two months into the recession, with only 2 false positives (1966 and 1985). This is consistent with at very least a severe slowdown.
Where there has not been a slowdown is in the (non-leading) services sector, which remains at roughly 1.5% growth YoY:
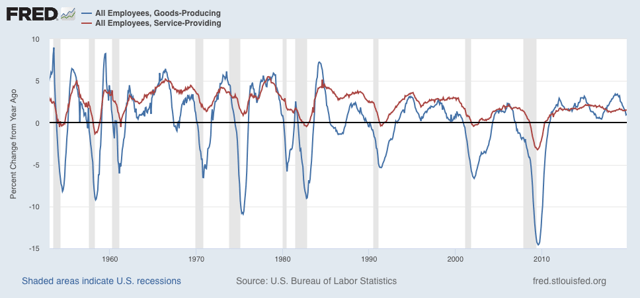
To sum up with regard to the leading sectors, Friday’s report was indeed good, but given the revisions, not quite as good as it appeared at first blush.
Pointing to the ISM manufacturing slowdown, a slowdown in small firms’ hiring, the manufacturing workweek, and the narrowness of the 2015-16 slowdown, concluding “people ought to discuss the actual data instead of making baseless claims.”
So I thought I would go back and take a look at the actual 70 years of data.
Since Friday’s report showed a m/m gain of 0.175%, I made a two graphs together showing the m/m% gain for the last 80 years, from which I subtracted -0.175%, so that any showing equal to November’s would be at the zero line, and only those showings better than November would be positive.
Here’s what I got:
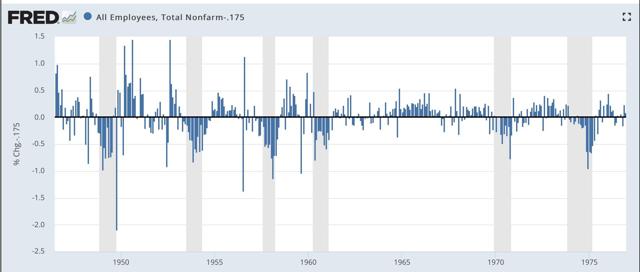
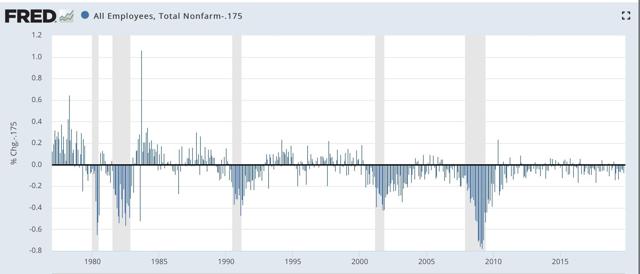
The two time periods are significantly different. During the post-war boom through 1974, it wasn’t uncommon at all to have readings equal to or better than November’s right before a recession began. In fact it happened just prior to every recession except for 1955 and 1957. Since 1974, though, it is a different story. Only in 1981, when the Fed raised rates sharply, was there a reading as good as November’s within 3 months of the onset of a recession. Prior to the last two recessions the lag was much, much greater. In either time frame, the three month rolling average was less than 0.175%/month leading up to recession - but of course it is now as well.
So, credit to Mish for raising a fair point. But I think the data from the modern era, where manufacturing is much less a component of the jobs picture is the most applicable. So I still think the November report is strong evidence against a recession before February.
Subscribe to:
Posts (Atom)