- by New Deal democrat
Yesterday I looked at the leading sectors of employment from the establishment jobs report. Today let’s look at labor force participation and wage growth.
There was no significant change in either prime age labor force participation or employment from October to November. In the below graph, both November readings are normed to zero so that only better rates of participation and employment show as positives. The graph dates from the end of the 1980s, when women’s entry into the labor force was close to completion:
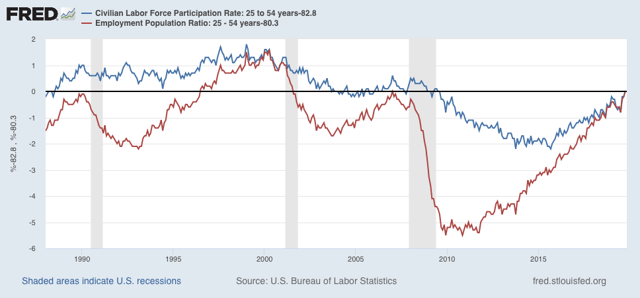
The prime age employment to population ratio for prime age workers is better than either the 1990 or 2007 peaks, but about 1.6% lower than the late 1990s boom. But participation still lags all three peaks.
On the other hand, the *YoY growth* in participation for November was +0.5%, among the strongest rates sine the mid-1990s:
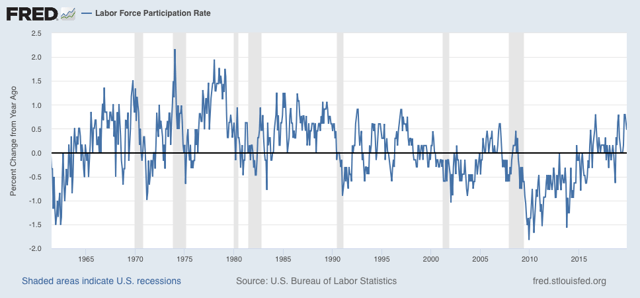
Note the huge bulge in the 1960s and 1970s as the baby boom, and women, entered the work force in droves. Some of the strong growth in this metric that has appeared over the past 5 years is the result of the equally large Millennial generation entering the market and offsetting retiring Boomers.
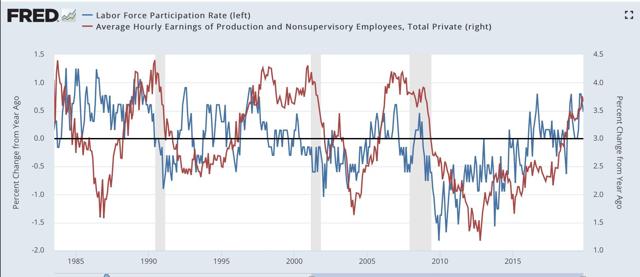
As shown in the next graph below, YoY wage growth lags YoY participation growth. On a more “micro” scale, large bumps in participation (e.g., the mid-1980s, early 1990s, and 2016) have frequently (not always!) tended to be associated with lags in wage growth, as short term increased competition for employment openings eases wage demand.
But on a cyclical and secular scales, another part of the story of the lag in participation is the deceleration in wage growth. Nominal wage growth is one of the very few *long lagging* indicators, I.e., it does not bottom out until the U6 underemployment rate falls to about 8% (not shown):
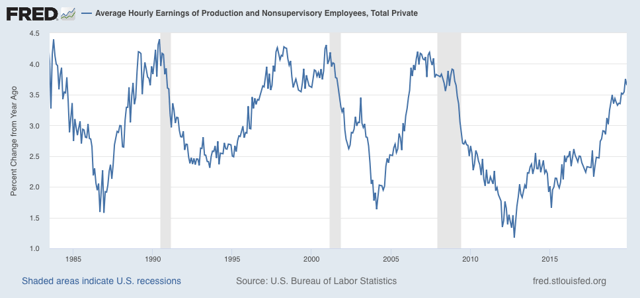
In the past 40 years, wage growth has tended to peak in the 4.0%-4.5% range for each expansion. So far non-supervisory wages have increased at most 3.8% YoY in this expansion:
Finally, let’s compare nominal non-supervisory wage growth YoY (blue) with consumer inflation (red):
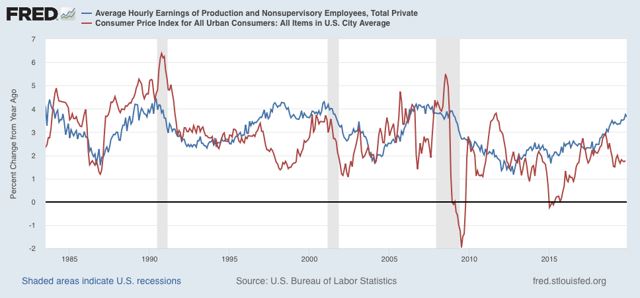
Both slowdowns and recessions have typically occurred in the past 40 years when inflation is nearly equal to or exceeds nominal wage growth. We briefly had that in 2018, due to an increase in gas prices, but 2019 has been a rare occasion of accelerating nominal wage growth an decreasing inflation (again, due to somnolent gas prices).
[Aside: stories you are reading about how wage growth has subsided are citing wages that include supervisors and managers. The slowdown in growth there has everything to do with managerial employees, and not non-supervisory employees.]
Tomorrow we will get November inflation data. The signs are that gas prices are picking up again, so I expect an uptick in inflation as well.