- by New Deal democrat
Hopefully you are recovering from your turkey coma today. Here’s a little late commentary on Wednesday’s new home sales report.
- by New Deal democrat
Hopefully you are recovering from your turkey coma today. Here’s a little late commentary on Wednesday’s new home sales report.
- by New Deal democrat
Initial claims for jobless benefits rose 17,000 this week to 240,000, a 3 month high. The 4 week average also rose by 5,500 to 226,750. Continuing claims one week ago rose 48,000 to 1,551,000, the highest number since March:
- by New Deal democrat
I have a new post up at Seeking Alpha, in which I lay out all of the short leading indicators, and conclude that the conditions have now been met for a recession to begin at any point in the next 6 months.
There’s one graph I intended to use which didn’t make it through to the final published piece. Here it is:
In the piece, I note that the strong jobs reports have been the biggest reason why no recession has occurred yet. But in the past several weeks I’ve been pounding the table about the implications of the steep deceleration in tax withholding receipts since mid-year. Here’s the YoY% change in total tax withholding receipts since then:
- by New Deal democrat
As we start Thanksgiving week, let’s take a look at the current state of COVID.
- by New Deal democrat
My Weekly Indicators post is up at Seeking Alpha.
It had to happen sooner or later. Earlier this year, based on the long leading indicators, I went on “Recession Watch.” Now, for the first time in a very long time, I have escalated to “Recession Warning.” I believe there is much more than a 50/50 chance of a recession beginning in the next 6 months.
For all the gory details, click on over and read, which will bring you up to the virtual economic moment. As usual, it will also reward me a little bit for the efforts I made.
- by New Deal democrat
As I wrote earlier this morning, my primary interest in existing home sales at this point is prices. [Note: graphs below for sales and prices does not include October]
- by New Deal democrat
Later this morning existing home sales will be reported for October, which will mainly be of interest to me only for what happened with prices, and secondarily whether the problem of low inventory which has existed for 3 years is moving in the direction of resolution.
- by New Deal democrat
The monthly numbers for housing permits, starts, and single family permits all declined this month. Permits (red in the graph below) declined -38,000 annualized to 1.526 million annualized, and starts (blue) declined -62,000 annualized to 1.425 million, both the lowest since summer 2020. Single family permits (gold, right scale), which have the most signal and least noise, declined -31,000 annualized to 831,000, the lowest since May 2020 and before that, the lowest since April 2019:
Perhaps more importantly, here’s a variation on a graph I have run many times over the past 10 years, comparing the YoY change in interest rates, in this case mortgage rates (inverted, *10 for scale) with the YoY% change in total housing permits (red) and single family permits (gold):
- by New Deal democrat
Initial jobless claims declined -6,000 this week to 222,000. The 4 week average rose 2,000 to 221,000. More interestingly, continuing claims one week ago rose 13,000 to 1,507,000, the highest number in over 7 months:
- by New Deal democrat
I call industrial production the King of Coincident Indicators, because more often than any other metric it coincides with the peaks and troughs of economic activity as determined by the NBER, the official arbiter of recessions.
- by New Deal democrat
Retail sales, my favorite consumer indicator, was reported this morning for October. And it was a good number, up +1.3% nominally, and up +0.5% after adjusting for inflation:
- by New Deal democrat
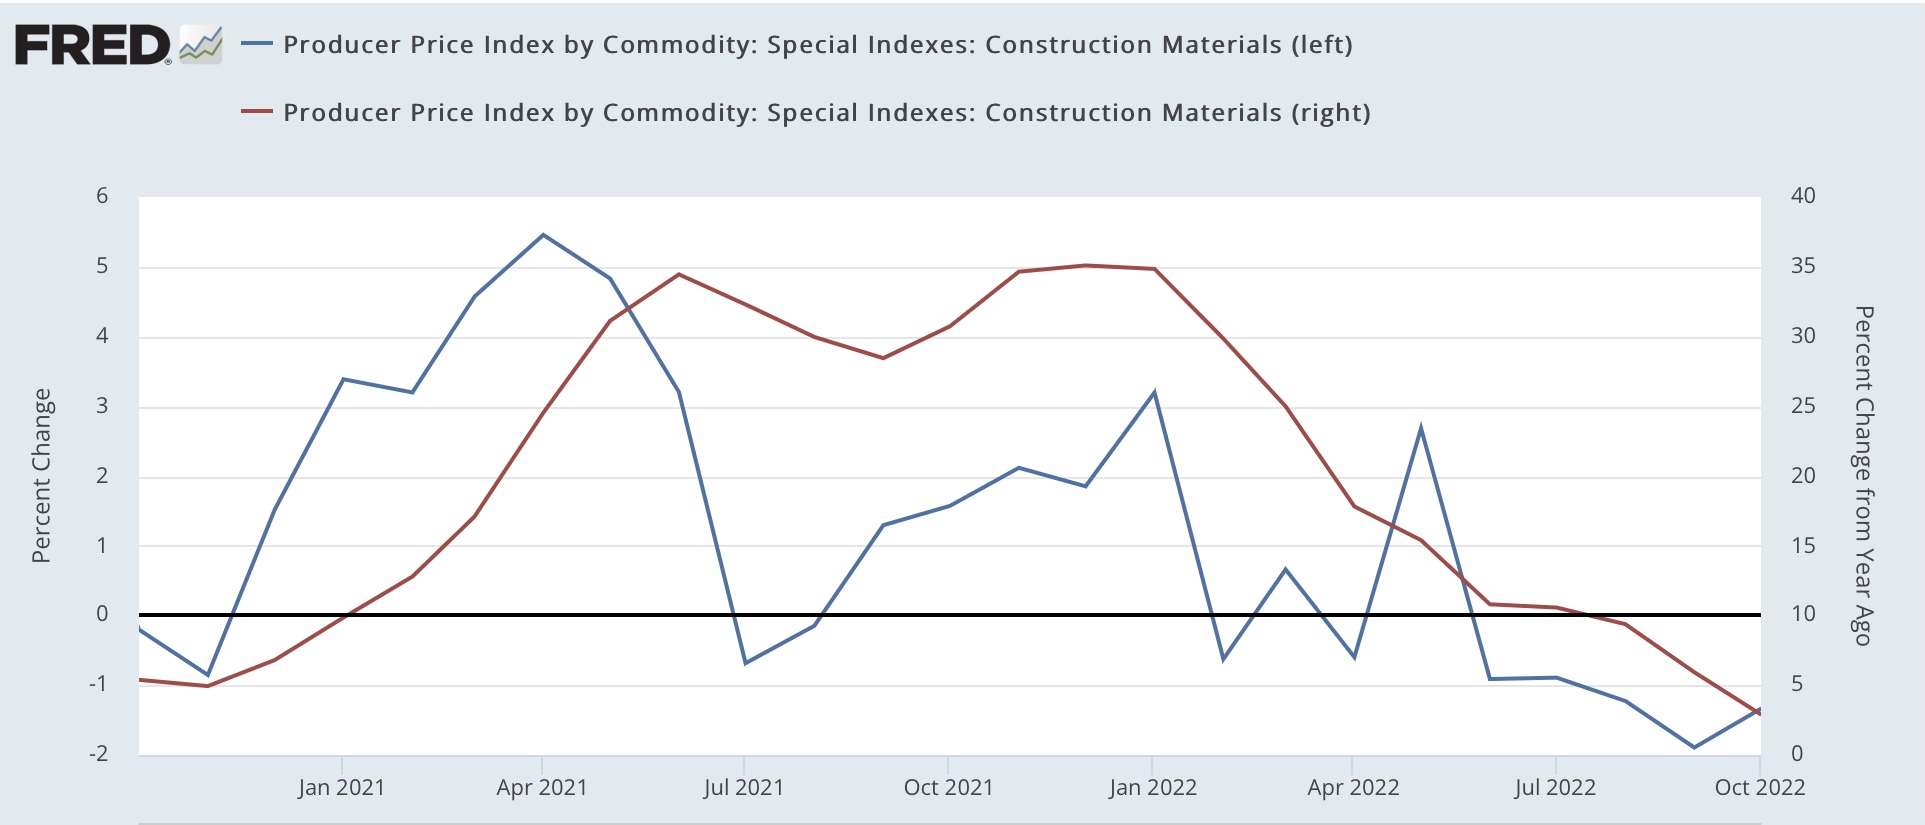
Let me start this discussion of October’s producer price index by pointing to the NY Fed’s “Global Supply Chain Pressure Index” for the past 5 years through October:
- by New Deal democrat
My Weekly Indicators post is up at Seeking Alpha.
Although a few indicators are holding up, in the past month there has been almost continual deterioration in several employment and consumption metrics. These are particularly important for whether the consumer is pulling back, typically a signal that a recession is close to imminent.
As usual, clicking over and reading should bring you up to the virtual moment as to the state of the economy, and reward me a little bit for my efforts.
- by New Deal democrat
With yesterday’s report on October consumer prices, we can up two of my favorite measures of how the working/middle class is doing - real average non-supervisory wages, and real aggregate payrolls.
- by New Deal democrat
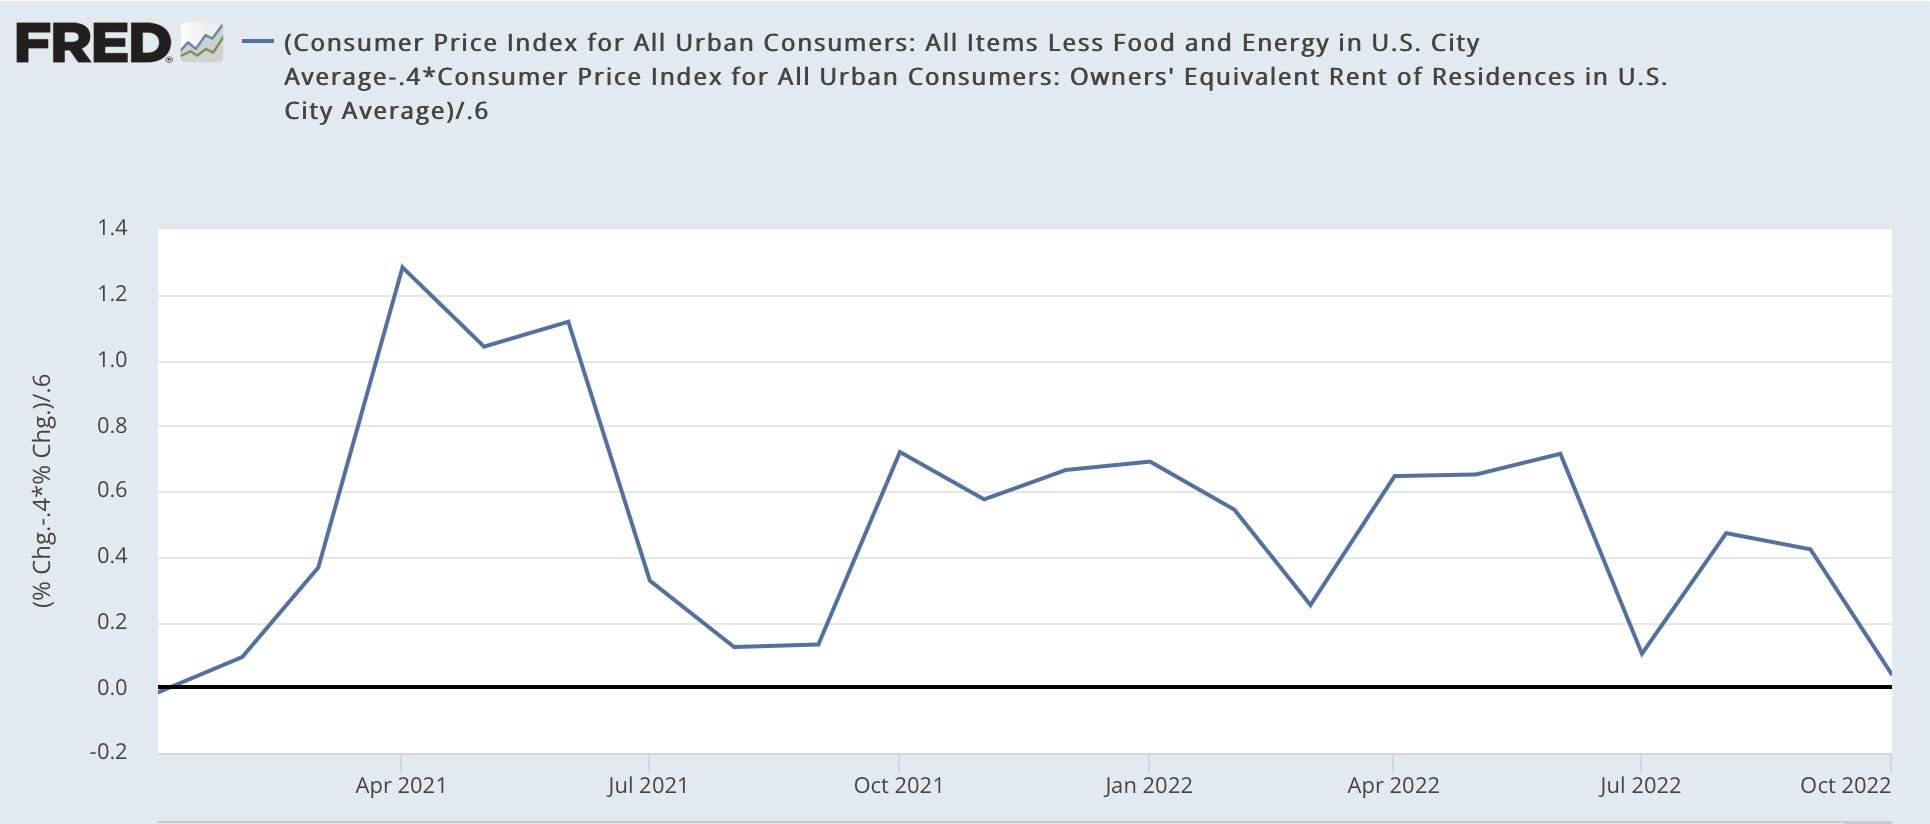
For a full year now I’ve been hammering the fact that the official CPI measure of housing inflation, “owners’ equivalent rent,” seriously lags actual house prices as measured by the most popular housing indexes. I said then, and I have reiterated almost every month since, that because of this serious lag, OER was going to rise probably to 7.5% YoY or more, and drag core CPI along with it. That remained evident in this morning’s October CPI report.
- by New Deal democrat
Initial jobless claims rose slightly, by 7,000, from one week ago to 225,000. The 4 week average declined -250 to 218,750. Continuing claims also rose slightly, by 6,000, to 1,493,000:
- by New Deal democrat
No economic news today while we await tomorrow’s big inflation report (Hint: shelter inflation is going to continue to be the big driver); and I think maybe we had a little political event yesterday, so let me make a few brief comments.