Tuesday, April 24, 2018
Housing: it's Godzilla vs. Mothra!
- by New Deal democrat
LADIES AND GENTLEMEN!
In this corner, I give you Godzilla -- the large generational tailwind of Millennials entering the market!
And in this other corner, I give you Mothra -- increasing interest rates that have now broken a 30 year trendline together with price increases of over 5% a year!
Pull up a chair (at a vary safe distance), because we don't know yet who is going to win -- but you don't want to get caught in between them.
This post, with monstrous graphs, is up at XE.com.


Monday, April 23, 2018
The consumer edges closer to the precipice
- by New Deal democrat
In addition to my "long leading/short leading" model adapted from the work of Profs. Geoffrey Moore and Edward Leamer, and the "high frequency" weekly variation on the same, I also have several "alternate" recession forecasting models. The most noteworthy model is really a consumer nowcast. It turns on consumers running out of options to to continue increasing purchases (i.e., no interest rate financing, no wage real wage increases, and no increasing assets to cash in). When that happens, and consumers turn more cautious by saving more, a recession begins.
I first posted the model 10 years ago under the title, "Are Hard Times Near? The great decline in interest rates is ending." The history is straightforward. Since the 1970s, real average hourly earnings had declined. Average Americans coped by spouses entering the workforce, by borrowing against appreciating assets, and by refinancing as interest rates declined.
By 1995 the spousal avenue peaked. Borrowing against stock prices ended in 2000. Borrowing against home equity ended in 2006. When interest rates failed to make new lows, the consumer was tapped out, and began to curtail purchases. A recession began - and its effects lingered for a long time. "Hard Times" had indeed begun.
What does the consumer model show now? I haven't updated it in about two years, and there have been noteworthy developments. Let's take a look.
Real hourly wages haven't increased since last July, are up only 0.1% YoY and barely more in the past two years:

According to Ironman at Political Calculations, real median household income has declined slightly for nearly two years:

Mortgage rates haven't made a new low since 2013, and if anything are trending up, on the verge of breaking a 30 year trendline:

As a result, refinancing at lower mortgage rates is dead (shaded line):

In terms of cashing in assets, the stock market hasn't made a new high in nearly 3 months:

Of course, there's nothing to preclude it making new highs later this year, but for the moment, that method of freeing up cash is stalling.
The one asset that is still very much appreciating, of course, is housing:

Unsurprisingly, home equity withdrawals have been increasing over the past 12 months (h/t Bill McBride a/k/a Calculated Risk):

Meanwhile, the personal savings rate declined sharply over the last 18 months:

So consumers are more stretched than earlier in the expansion.
The recent upturn in the savings rate would be more concerning, except that household debt obligations as of Q4 2017 were still rising:

For this model to signal recession, consumer debt obligations would have to start to fall.
Put this all together, and we have consumers in a more precarious position than they have been at any previous point in this expansion. But on the other hand, home equity withdrawals are still an option and are being used. The most recent available data does not show consumers becoming more focused on paying down debt. As with my primary forecasting model, the lynchpin looks like the housing market.
Sunday, April 22, 2018
A better name for The Kids Today: iGeneration
- by New Deal democrat
You know the drill. It's Sunday so I get to ruminate about all stuff that isn't dry economics.
The oldest member of the Millennial generation is 38. Not only do I not think that The Kids Today would want to be lumped with that age group, but their uncool parents are probably precisely members of that group!
So what to name the generation that came after the Millennials? both "post-Millennials" and "Gen Z" are condescending and probably don't cut it with The Kids Today. Remember, "Gen X" was originally called "the baby bust," and Millennials were originally called "Gen Y" or "the echo boom," before catchier names were found.
A good dividing point is whether or not you remember 9/11. If you do, and were born after 1980, you're a Millennial. If you don't, you're not. Most studies seems to agree with this, using 1996 or so as the cut-off year after which you are not a Millennial. A similar if less apocalyptic marker is the Columbine school shooting of 1999. If you remember it, you're a Millennial. If your schooling always included "active shooter" drills, you're not.
But while the War on Terror or mass shootings have always been in the background for The Kids Today, everyday life has been dominated by something else. If you were born after 1996, iPods were always around -- and there's a good chance you owned one. So were cell phones. For most of your youth -- *always* for the younger part of this cohort -- iPhones and flat screen TV's have been around, and you probably have had one (or another smart phone) since junior high school. In fact you may spend most of your time glued to one! The term "iGeneration" captures this perfectly.
I'm not the first person to think this is a better name. From Wikipedia:
iGeneration (or iGen) is a name that several persons claim to have coined. Demographer Cheryl Russell claims to have first used the term in 2009. Psychology professor and author Jean Twenge claims that the name iGen "just popped into her head" while she was driving near Silicon Valley, and that she had intended to use it as the title of her 2006 book Generation Me about the Millennial generation, until it was overridden by her publisher. In 2012, Ad Age magazine thought that iGen was "the name that best fits and will best lead to understanding of this generation". In 2014, an NPR news intern noted that iGeneration "seems to be winning" as the name for the post-Millennials.
So henceforth when I examine demographics issues, I am going to use the term "iGeneration," the earliest polling as to which indicates that they hate Trump even more than their Millennial predecessors do!
Saturday, April 21, 2018
Weekly Indicators for April 16 - 20 at XE.com
- by New Deal democrat
My Weekly Indicators post is up at XE.com.
The regional Fed indexes, which presaged real strength in the industrial sector over the last year, are faltering (while still positive).
Meanwhile housing, as exmplified by purchase mortgage applications, refuses to be held down.
Friday, April 20, 2018
Do interest rates still matter for the housing market?
- by New Deal democrat
In the past few years, the strength of the housing market has seemed to defy the impact of interest rates.
Do they still affect housing? I take a detailed look over at XE.com.
Thursday, April 19, 2018
Higher wage growth for job switchers: more eviden of a taboo against raising wages?
- by New Deal democrat
Yesterday the Atlanta Fed published a note touting the wage growth for those who quit their jobs and transfer to a different line of work, writing that:
Although wages haven't been rising faster for the median individual, they have been for those who switch jobs. This distinction is important because the wage growth of job-switchers tends to be a better cyclical indicator than overall wage growth. In particular, the median wage growth of people who change industry or occupation tends to rise more rapidly as the labor market tightens.
The following graph was posted in support of this point:

Essentially the Atlanta Fed is highlighting the orange line as a "better cyclical indicator."
Is it? There's no doubt that wage growth among job switches declined first in the last two expansions. But I would want to see a much longer record before being that confident.
Because what I see in the above graph is a decline among job keepers (the green line) that is only matched by those declines presaging the onset of the last two recessions. Meanwhile the orange line, while still rising, has flattened.
In fact I think the Atlanta Fed's graph mainly shows evidence of what I highlighted last week as an emerging "taboo" against raising wages -- i.e., a stubborn refusal to raise wages even if it would lead to even higher output and gross profits for a net gain.
Once again the JOLTS data gives us a good proxy. If wage growth is increasing at a "normal" rate compared with previous expansions, there shouldn't be an inordinate need to change jobs in order to get a raise, i.e., a rate higher than previous expansions. Thus the ratio of job changers who quit vs. the number of actual hires should be equivalent to similar stages in those expansions. If, on the other hand, employers have become inordinately stingy, quitting is almost essential to get ahead, in which case the ratio of quits to hires should be higher than normal.
Here is what the data shows:

For the last several years, Quits have been in the range of 58%-60% of hires, the highest since 2001, and specifically higher than the 56%-58% peak of the last expansion.
In other words, it looks like what the Atlanta Fed's graph is showing is that employees are reacting to the taboo against raising wages by quitting their jobs and moving to employers in fields that are already paying more.
Wednesday, April 18, 2018
Is the US economy booming? April 2018 update
- by New Deal democrat
Back in January, I asked if the economy was "booming." There's no official definition, but based on my recollection of the two periods I have lived through that felt like booms, the1960s and late 1990s, I answered in the negative. I considered a number of indicators of well-being, to see what stood out in those two periods, and concluded that
the five markers of an economic Boom are the following:
1. An unemployment rate under 4.5%
2. YoY industrial production growth of at least 4%
3. YoY real wage growth of at least 1%
4. YoY real aggregate wage growth of at least 4%
4. YoY real aggregate wage growth of at least 4%
5. Increasing YoY inflation.
In January, only the first and last markers were present. Let's update now that the first quarter iv over.

Due to the big surge of 1% in February alone, this is now over 4% YoY:
YoY real wage growth of at least 1%

Real wage growth is up just barely above zero, at +0.1%.
YoY real aggregate wage growth of at least 4%

This is only a little over 2% and has been decelerating.
Increasing YoY inflation.

Unemployment rate under 4.5%

This remains at 4.1%
This remains at 4.1%
YoY industrial production growth of at least 4%
Due to the big surge of 1% in February alone, this is now over 4% YoY:
YoY real wage growth of at least 1%
Real wage growth is up just barely above zero, at +0.1%.
YoY real aggregate wage growth of at least 4%
This is only a little over 2% and has been decelerating.
Increasing YoY inflation.
Inflation was increasing in January, and has continued to increase since.
The bottom line is that, while the economy might feel like it is booming on the production side, it isn't booming at all on the worker/consumer side.
Tuesday, April 17, 2018
Notes on housing permits and industrial production for March 2018
- by New Deal democrat
First, a quick note on housing permits and starts: obviously the overall numbers were very good. The overall uptrend remains intact, and March was lower than only January for the peak of this expansion for permits. The three month average of the more volatile starts number was the highest so far during this expansion.
There is at least one issue which may indicate some stress building in the market -- or might just be noise. Single family permits declined to the lowest level in half a year. Since multiunit housing (condos and apartments) is something of a substitute good, not infrequently that part of the market continues to rise after single family housing has peaked.
I plan on a more detailed look tomorrow. Stay tuned.
Second, industrial production was also nicely positive, although the lion's share of that was mining and utilities. Manufacturing increased only +0.1:

Still, the meme that the "hard" manufacturing numbers haven't followed the "soft" ISM and regional Fed reports (ironically now that the regional Fed numbers are softening) ought to be dead. Since production is the ultimate "nowcast" number, this argues that in Q1 the economy turned in a decent performance.
Monday, April 16, 2018
Real retail sales very positive. What to watch for next
- by New Deal democrat
This morning's retail sales report for March was certainly very positive. Nevertheless, there is one aspect of the trend which is a little concerning.
First, the obvious good news. Real retail sales were up +0.7%:

This is in line with the general upward trend. Note that I am discounting somewhat the spike last autumn that was probably related to extraordinary hurricane and wildfire repairs.
The YoY comparisons are healthy as well:

So far, so good.
But, in line with the overarching story that we are late in the expansion, is there anything to look out for? Yes.
In general, large durable purchases wane first. So let's break out real retail sales into motor vehicles and parts (blue) vs. everything else (red), shown quarterly to reduce noise:

Real spending on vehicles declines below zero YoY well before a recession, while real spending on other things (including necessities like food) may not necessarily turn negative at all, although growth certainly declines.
Here is a close-up of the last two years:

Even with today's good reading, retail sales of motor vehicles and parts was only +0.5% YoY during the first quarter. Since part of Q4 2017's spike was related to flooding in the Houston area, the trend in growth certainly looks to be declining. Although the remaining part of retail spending looks very healthy, should motor vehicle related spending turn negative YoY, that would at least be a cautionary "yellow" flag.
Sunday, April 15, 2018
A thought for Sunday: The Abyss always looks back, Presidential polling edition
- by New Deal democrat
A point I have made about economic forecasting a number of times is that one can be an excellent forecaster, so long as one is a bug on the wall. Once a significant number of people begin to follow *and act upon* the forecast, to that extent it must necessarily lose validity.
Take for example the yield curve, much in the news this year. So long as everyone ignores or excuses a yield curve inversion, it is an excellent indicator for the period of 12-24 months ahead. But if everyone *acted* on a yield curve inversion, by, e.g., canceling investments or increasing savings, it would turn into a botched "nowcast" instead. That which people might have started doing a year later, they would be doing now, when the conditions don't yet necessitate it.
Simply put, people will act upon forecasts. The more previously reliable or certain the forecast, the more people will act on it -- and thereby change the result.
This past week's publication of former FBI Director James Comey's book shows how the same principle applies to Presidential election polling. Here's the passage that has been getting a lot of scrutiny:
It is entirely possible that, because I was making decisions in an environment where Hillary Clinton was sure to be the next president, my concern about making her an illegitimate president by concealing the restarted investigation bore greater weight than it would have it the election appeared closer or if Donald Trump were ahead in all polls.
Leave aside for now that it was not for Comey to decide whether or not Clinton would be "an illegitimate president" -- that's what we have criminal juries and Impeachment for -- or that he simultaneously withheld from voters that Trump's campaign was *also* under investigation at the time. The fact is that he was led by polling and poll aggregators who claimed that a Clinton victory was a near certainty to take an action that he probably would not otherwise have done. And that action caused a near-immediate decline in Clinton's poll numbers by about 4%, while early voting was actually going on in many states. All because Comey knew that Clinton's election was "in the bag."
In a similar vein, why was Barack Obama so passive in the face of the intelligence community telling him that Russia was trying to intervene in the election by, e.g., planting "fake news" stories? He was President. He did not need Mitch McConnell's permission to address the nation in as non-partisan a fashion as possible. He didn't act because he knew that Clinton's election was "in the bag." Isn't that what Biden was sent to Europe to reassure all of our allies about?
There's also been some detailed analysis indicating that there were enough Sanders to Jill Stein voters in Michigan, Wisconsin, and Pennsylvania to swing the outcomes in those States and thereby alter the election outcome. I think it's a near certainty that these people felt comfortable casting such protest votes because they knew that Clinton's election was "in the bag."
To paraphrase the title of this post: when you look into the Future, the Future always looks back.
Saturday, April 14, 2018
Weekly Indicators for April 9 - 13 at XE.com
- by New Deal democrat
My Weekly Indicators post is up at XE.com.
The long leading indicators keep tiptoeing closer and closer to neutrality.
Friday, April 13, 2018
February 2018 JOLTS report: positive trend revised away
Last month I wrote that the January JOLTS report reflected very positive trends. Today they got revised away.
As a refresher, unlike the jobs report, which tabulates the net gain or loss of hiring over firing, the JOLTS report breaks the labor market down into openings, hirings, firings, quits, and total separations.
I pay little attention to "job openings," which can simply reflect that companies trolling for resumes, or looking for the perfect, cheap candidate, and concentrate on the hard data of hiring, firing, quits and layoffs.
The first important relationship in the data is that historically, hiring leads firing. While the one big shortcoming of this report is that it has only covered one full business cycle, during that time hires have peaked and troughed before separations.
And here, there has been an important revision. Here is the historical relationship on a quarterly basis between hiring (red) and total separations (blue) as it existed through the end of the third quarter of 2017:


The updated graph shows hiring exceeding its prior peak in the second halfof 2017 with its last monthly peak in October. Significantly, hiring for the previous month was revised downward below this peak.
Meanwhile separations actually peaked before then, in July of last year, with a clear downtrend since, another significant revision since last month. *if* both have made their expansion highs, needless to say that would be important.
Meanwhile separations actually peaked before then, in July of last year, with a clear downtrend since, another significant revision since last month. *if* both have made their expansion highs, needless to say that would be important.
Further, in the previous cycle, after hires stagnated, shortly thereafter involuntary separations began to rise, even as quits continued to rise for a short period of time as well:

[Note: above graph show quarterly data to smooth out noise]
Here are voluntary quits vs. layoffs and discharges on a monthly basis for the last 2 years:

If we have established the expansion peaks in hiring and total separations, I would expect quits to continue to improve for a short while (as they have) before also beginning to decline. As in the last expansion, separations appear to have bottomed.
This month's report acts as a caution about revisions, most importantly by the downward revision in hiring and separations. Last month the trend appeared clearly positive for both, but as revised it is more questionable as to hires, and looks negative as to separations. That being said, I don't even see a yellow flag until hires and separations go negative YoY, as they did before well before the last recession (quarterly through Q4 2017 in the graph below):

They haven't yet:

If three months from now we haven't established any new highs in hires and total separations, and they are hovering at or below zero YoY, then we can talk about a late-cycle trend.
UPDATE: And for those of you -- I'm looking at you, Dave Wessel and Matt Yglesias -- shouting 'Huzzah!' because the ratio of job openings to the unemployment rate is back where it was in 1999 and 2000:

If those job openings corresponded with actual hires, you'd have a point:

They don't, and you don't
Thursday, April 12, 2018
Real average hourly and aggregate earnings: March 2018 update
- by New Deal democrat
Here's a look at two more labor market measures, now that we have the inflation data for March as well.
First, here is real average hourly earnings for ordinary workers, normed to 100 as of its peak last July:

With -0.1% deflation for the month, and +0.1% nominal growth, there was a little improvement, but we are still -0.6% below the peak over half a year ago.
We are less than +0.1% better than one year ago, and truth be told, there hasn't been any significant improvement at all in over two years.
Second, here is real aggregate payrolls:

This tells us how much more income is flowing to workers as a whole in the expansion, by accounting for changes in hours worked and growth in the number of persons employed.
Real aggregate payrolls have still been growing, albeit at a slower pace in the last two years and in particular since last July.
Basically the economy is going to continue to be OK so long as consumers continue to buy new houses and purchase other durables like vehicles. Since 2016 they've gone into savings to do so. Meanwhile consumer credit standards generally have been slowly tightening:

although standards for GSE mortgage loans remain loose:

Due to a glitch, the last several quarters aren't shown on the FRED graph, but as of Q1 they remained a loose -8.3.
Next week we'll start to get the March data on housing.
Wednesday, April 11, 2018
Further decelerataion in several long leading indicators
- by New Deal democrat
Since the beginning of this year, I have noted the deceleration in real M1 and in purchase mortgage applications.
While neither has turned negative, there has been further deterioration in the positive readings of each.
This post is up at XE.com.
Tuesday, April 10, 2018
Is raising wages becoming a taboo?
- by New Deal democrat
Yesterday I noted that, while the problem of lower labor market participation among the working age population hasn't *entirely* resolved, it is getting close to resolving due to the surge in entry into the jobs market in the last two years. As the graph below shows, not only has the prime age population grown by about 2 million in the last 2.5 years (blue), but nearly an additional 2 million (1.5% of 125 million) have entered the labor force (red):
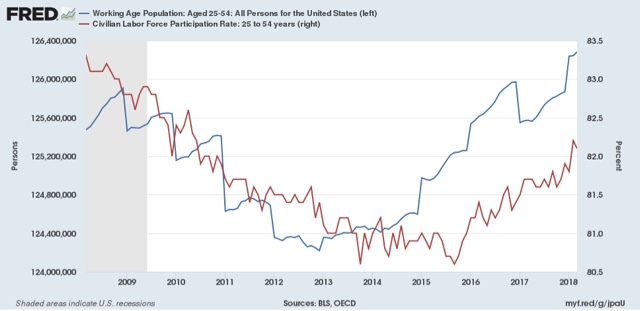
But,while in accord with the last two expansions, nominal wage growth bottomed out once the U6 underemployment rate fell to roughly 9%, for nonsupervisory workers, it has languished at about 2.5%:

This is less than the roughly 4.5% peaks in the past 3 expansions.
Why?
MONOPONY VS. SKITTISHNESS VS. TABOO
One explanation is in the first graph above itself. All else being equal, even accounting for population growth, there are 2,000,000 more candidates for jobs in the prime age labor force than there were 30 months ago. More competition for jobs should act to hold down compensation.
But recently another explanation has been written about at length: monopsony in the labor market. In more plain english, this is a monopoly or at least oligopoly on the demand side for labor. Increased market power to hold down wages, it is argued, is having that exact effect:
[I]n recent years, economists have discovered another source: the growth of the labor market power of employers — namely, their power to dictate, and hence suppress, wages.....[I]n many areas of rural America, [where] large-scale employers that dominate their local economies[, w]orkers can either choose to take the jobs on offer or incur the turmoil of moving elsewhere. Companies can and do take advantage of this leverage.
Yet another source of labor market power are so-called noncompete agreements .... These agreements prohibit workers who leave a job from working for a competitor of their former employer.
Almost a quarter of all workers report that their current employer or a former employer forced them to sign a noncompete clause.....[S]tudies have found that employer concentration has been increasing over time and that this concentration is associated with lower wages across labor markets.
....{Monopsonistic f]irms [which pay less than "competitive" wages] bear the loss in workers (and resulting lowered sales) in exchange for the higher profits made off the workers who do not quit.
While the evidence appears compelling that employer market power is having *an* effect of holding down wages, I am not sure at all that it is the *primary* driver of low wages.
At least two other explanations for employers refusing to raise wages come to mind:
- employer skittishness about the durability of a strong economy.
- raising wages has become a taboo
Let me explain each.
Suppose I am an employer in competition with others. Suppose further, however, that I am skeptical that the current "good times" are going to last. After all, since 2000 there have only been about 4 years at most (2005-07 and 2017) where the economy has seemed to be operating at close to full throttle. If I raise wages now, I will attract more workers, but then when the good times end, I will be stuck with a higher paid workforce than my competitors who haven't raised wages. If I think that "bad times" are likely to exist more often than "good times" in the foreseeable future, then I might hold back on increasing my labor costs during the good times, leaving some additional profits on the table, because that will be more than offset by having relatively lowers costs during the bad times.
By an economic taboo, I mean a decision to leave profits on the table because they conflict with an even higher priority held by the employer (e.g., I refuse to higher a clearly more qualified black job applicant because I am a racist). Let's suppose that I am an employer who *does* believe that the good times are likely to last, BUT I also believe that people who come to work for me ought to be grateful to earn, say $10 per hour, and because of my firm ideological belief, I am not going to budge. If I am alone in my ideological belief, I will suffer. But if my ideological belief is shared on a widespread basis by my competitors and other businesses, I am *not* at a competitive disadvantage. Thus depressed wages may persist because raising wages has become a taboo,
USING THE JOLTS SURVEY TO DISCRIMINATE AMONG THE HYPOTHESES
So, how can we tell if the primary driver of employer decisions not to raise wages is monopsony, skittishness, or taboo?
The JOLTS survey appears to give us a good look at the likely answer. JOLTS measures job openings, actual hires, and quits, among other things. Let me show you how.
To begin with, if skittishness about the durability of a strong economy is the primary driver of lower wages, I would not expect those employers to even go looking for new employees to hire at higher wages. In other words, there wouldn't be an elevated number of job openings compared with actual hires, because skittish employers simply aren't in the market.
On the other hand, both in the cases of monopsony power and taboo, I *would* expect to see elevated job openings, as in either case those employers *do* want to hire new workers -- they just want to hire those workers at what they define as their "fair" price, And that is exactly what we see in the JOLTS data during this expansion compared with the last one:

That is pretty compelling evidence that it is not economic skittishness that is driving low wage growth.
Minneapolis Fed President Neel Kashkari appears to agree:
"Almost everywhere I go, businesses tell me they can’t find workers. I always ask them the same question: 'Are you raising wages?' Usually, the answer is ‘no.’ When you want more of something but won’t pay for it, that’s called ‘whining,’” he told the ninth Regional Economic Indicators Forum (REIF), founded and co-sponsored by National Bank of Commerce. “Until you’re paying more, I know you’re not serious.”
So, how can we decide between the other two hypotheses? The Wall Street Journal (via Fundera) seems to think that smaller firms are offering bigger wage inducements:
The WSJ says small businesses across the country are increasing their wages at a faster rate than medium-size or even large firms. All industries with businesses made up of 49 or fewer employees saw a pay bump of just over 1%.
But the evidence is anecdotal, not hard data.
Again, the JOLTS survey seems to provide an answer in two parts.
First, as mentioned in the monopsony piece above, such firms should have "higher profits made off the workers who do not quit."
So let's look at the "Quits rate" in the JOLTS survey:

Workers are quitting their jobs at virtually the same rate in this expansion as during the last one, during which wage growth was higher. There simply isn't a bigger pool of "workers who do not quit."
A second thing we ought to find, if monopsony is the primary driver of low wage growth, is that bigger firms with market power ought to have unfilled job openings at a much higher rate than firms in small, more competitive labor markets. This is backed up by a scientific study:
[I[n a competitive labor market, such “shortages” [of hiring compared with job openings as measured in the JOLTS report] should dissipate as employers competitively bid up wages to fill their vacancies. But counter to this prediction, Rothstein (2015) finds no evidence that wages have grown faster in sectors with rising job openings. Instead, the failure of hiring and wage growth to keep pace with the rise in job openings is consistent with the incentives faced by firms in an imperfectly competitive labor market; it suggests that companies have a strong interest in hiring workers at their offered wages, but have resisted bidding up wages in order to expand their workforces (Abraham 2015).
As it happens, we are able to able to infer a comparison in Rothstein's metric between large and small firms.
Above I showed job openings (blue) vs. actual hires (red) in the JOLTS survey. The National Federation of Small Business conducts a similar survey among its members. Here are their graphs of job openings and actual hiring from their most recent report:


Small business owners clearly started singing "Happy Days are Here Again" on the day after the 2016 Presidential election. And their job openings soared.
But their actual hires didn't. They are adding jobs at the same level as they did in 2014 and 2015. They are behaving as if they have a taboo against raising wages.
So in conclusion, while I have no doubt that the "monopsony" argument is measuring something real, I am more and more inclined to believe that raising wages is simply becoming an ideological taboo among businesses, a higher priority than maximizing net profits after costs.
Monday, April 9, 2018
Scenes from the March employment report: no change in ongoing trends
- by New Deal democrat
While it certainly has shortcomings, there is simply no other report that captures in timely fashion the factors that matter most to the vast majority of Americans' economic well-being than the monthly jobs report.
Let's take a look at a few of the things that stood out.
First of all, marking myself to market, last week I said I was expecting another good employment report. That didn't happen, as at least on the surface, neither of my forecasts panned out. So let's start there.
Historically, consumer spending leads hiring. I thought the surge in spending last autumn would continue to be felt in March. Not so as of the preliminary report!:
Let's take a look at a few of the things that stood out.
First of all, marking myself to market, last week I said I was expecting another good employment report. That didn't happen, as at least on the surface, neither of my forecasts panned out. So let's start there.
Historically, consumer spending leads hiring. I thought the surge in spending last autumn would continue to be felt in March. Not so as of the preliminary report!:

But even with the miss, Q1 hiring was the highest in a year. We'll see what revisions do (for example, last September's originally reported -33,000 job loss has been revised to a gain of +14,000), and I still do expect some further carryover from spending to hiring this quarter.
Incidentally, even with the surprisingly low monthly gain, it was enough so that YoY job growth still exceeds the increases in the Fed funds rate -- which would have been a "yellow flag" caution of an increased risk for a downturn in the economy under the simple employment model I have been toying with recently:

I also expected the unemployment rate to decline to a new low. That actually did happen, but not by enough when you round out to the nearest 10th, as the unemployment rate fell from 4.14% to 4.07%:

A favorable change of 40,000 in either or a combination of jobs or the civilian labor force would have been enough to lower the rounded number to 4.0%.
Until recently, the level of labor force participation has been a big issue. That isn't entirely abated, but it is abating (blue in the graph below):

What remains a big issue is the lack of wage growth (red in the graph above). Below are all wages YoY (blue) compared with wages of non-managerial workers YoY:

The 80% or workers who aren't managers or professionals are still seeing really mediocre wage growth (and virtually none at all if we factor in inflation).
We can use this to back into managerial wage growth, but that is best viewed on a quarterly basis, because the sample size is smaller (only 20% of the total) and so much noisier on a monthly basis:

I continue to believe that the surge of people back into the labor force during the last two years -- the biggest such surge in several decades -- is creating a bigger pool of job candidates and is thus at least one explanation for the poor wage growth of nonsupervisory employees.
Recently, an explanation for the quandary of poor wage growth has emerged that highlights the effects of monopsony -- that is, employers with the market power to hold down wages. I want to discuss that at some length, and consider at least two other potential explanations: skittish economic expectations and an emerging taboo against raising wages. I will do that in a separate post.
Subscribe to:
Posts (Atom)