Saturday, September 12, 2015
Weekly Indicators for September 7 - 11 at XE.com
-by New Deal democrat
My Weekly Indicators post is up at XE.com. Despite global weakness, US domestic data remains decent.


Thursday, September 10, 2015
Forecasting 2014 Median household income
- by New Deal democrat
Next week the Census Bureau will release its report on 2014 median household income.
Since I have proposed that a reasonable and more up-to-date model for median household income of the 25-54 primary working age cohort is to take average hourly income and divide it by the percentage of those 25-54 who are employed (i.e., thier employment-poulation ratia), and then norm by inflation, I wanted to put out this forecast now, and we will see how it pans out next week.
The below graph gives two alternative values: red if the calculation is based on year-end values, and blue if the calculatioin is based on average values of the course of the year:

I believe the Census Bureau will use the average over the year, so the blue line is the more likely estimate. As you can see, it makes a considerable difference which way we measure.
I'm not pretending that this estimate is exact. As of 2013, the Census Bureau showed a decline of about 8% off the peak, whereas this estimate shows a maximum of 6% in 2011. But if my method works, we should see an increase in median household income in the prime working age group next week, as foreshadowed by the work of Prof. Emanuel Saez.
I'm not pretending that this estimate is exact. As of 2013, the Census Bureau showed a decline of about 8% off the peak, whereas this estimate shows a maximum of 6% in 2011. But if my method works, we should see an increase in median household income in the prime working age group next week, as foreshadowed by the work of Prof. Emanuel Saez.
Wednesday, September 9, 2015
JOLTS report warns job growth may be entering late cycle
- by New Deal democrat
I have a new post up at XE.com. The pattern of job openings, hires, and quits now looks very similar to what it was in summer 2006.
Monday, September 7, 2015
Five graphs for 2015: Labor Day update with 4 bonus graphs
- by New Deal democrat
At the end of last year, I highlighted 5 graphs to watch in 2015. We are now 8 months through the year, so let's take another look.
#5. Mortgage refinancing
After a mini-surge at the end of January (light brown in the graph below) due to low mortgage rates, refinancing applications fell back to their post-recession lows for most of the year. With another small decline in rates in the last 2 months, there has been a "minnier"-surge Mortgage News Daily has the graph:
#5. Mortgage refinancing
After a mini-surge at the end of January (light brown in the graph below) due to low mortgage rates, refinancing applications fell back to their post-recession lows for most of the year. With another small decline in rates in the last 2 months, there has been a "minnier"-surge Mortgage News Daily has the graph:

Over the last 35 years, refinancing debt at lower rates has been an important middle/working class strategy. There is little room left for that strategy. As shown in the first bonus graph below that I first published over 3 years ago, if mortgage refinancing stays turned off too long, and wages don't grow in real terms, then consumer spending falters and so does the economy:

That three year anniversary is now 2 months away.
#4 Gas prices
Here is a graph of average hourly wages divided by gas prices (blue) since the bottom in gas prices in 1999:

#3 Part time employment for economic reasons
#4 Gas prices
Here is a graph of average hourly wages divided by gas prices (blue) since the bottom in gas prices in 1999:
How long must a worker labor in order to buy a gallon of gas? After skyrocketing in the lead-up to the Great Recession, gas prices collapsed, helping the consumer start to spend again on other things at the bottom of that recession. The steep drop in gas prices late last year took us almost all the way back to that bottom. Just as in 1986 and 2006, at first consumers saved the money, but once they loosened their pursestrings, the economy responded.
#3 Part time employment for economic reasons
Next is a graph of part time workers for economic reasons expressed as a percentage of the labor force. In the 8 months of this year, this continued to improve, down about .2% or 320,000:

In the longer view, however, this is still 2% (about 3.2 million) above the boom level of 1999 and about 1.5% (2.25 million) above the level of 2007:

Despite the solid improvement this year, there are still more involuntary part time workers than at any point between 1994 and 2008.
Our next bonus graph takes a broader view of full time vs. part time work, as a percentage of the labor force:

There has also been solid improvement in this comparison this year. We are now equivalent to where we were in 1996 and 2004. That isn't great, but it is no longer poor either.
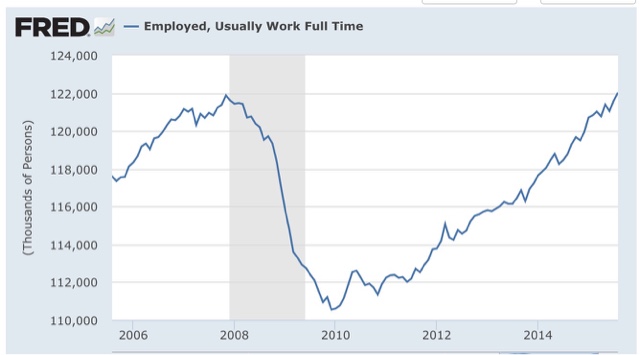
Our third bonus graph shows that the number of full time jobs have finally exceeded their previous high this past month:
#2 Not in Labor force but want a job now:
This moved generally sideways during the first quarter, but improved nicely in the last four months:
This moved generally sideways during the first quarter, but improved nicely in the last four months:

It is now only 200,000 above its post-recession low of November 2013 (just prior to Congress's cutoff of extended unemployment benefits) and about 1.5 million, or 1% of the workforce, above its 1999 and 2007 lows.
#1 Nominal wage growth
After 3 poor readings last August, December, and February, YoY growth in nominal wages for nonsupervisory personnel fell back close to their post-recession lows before rebounding this spring. Even so, YoY growth has been unable to crack 2% to the upside. In the below graph, I have s ubtracted 1.9% fromYoY nominal wage growth, and 10.3% fromcthe U6 unemployment rate, to set both to zero at their current levels:
After 3 poor readings last August, December, and February, YoY growth in nominal wages for nonsupervisory personnel fell back close to their post-recession lows before rebounding this spring. Even so, YoY growth has been unable to crack 2% to the upside. In the below graph, I have s ubtracted 1.9% fromYoY nominal wage growth, and 10.3% fromcthe U6 unemployment rate, to set both to zero at their current levels:

Compare our present expansion with the previous two. In the 1990s and 2000s, nominal wage growth started to accelerate when the broad U6 unemployment rate fell to 9.9% and 9.7% respectively.
Which brings us to the final bonus graph, a comparison of the U3 and U6 unemployment rates for the last 20 years, again with both values set to zero at their current 10.3% and 5.1% values:

The broad U6 unemployment rate has fallen at an average of -0.1% per month for the last 5 years. Should that continue, we will cross below 10% at the end of this year, implying nominal wage growth would finally accelerate early next year. Since at present inflation is still dead, one can only infer that the Fed's expressed desire to raise interest rates is designed to prevent any such wage growth.
In summary, eight months into the year we have a decidedly mixed bag. On the one hand, there has been no real improvement in either refinancing or wages. Should wage growth not improve, and mortgage refinancing remain dormant, we are likely to run into trouble - at least deceleratiing growth - probably starting next year.
On the other hand, low gas prices continue to be a boon to consumers. Further, involuntary part time employment has improved by about 300,000, and discouraged workers who have completely stopped looking have decreased by about 500,000. Thus, should those trends continue, I do expect wage growth to start to accelerate in about 3 to 6 months. Still, if current trends continue, we won't achieve real, full employment like 1999 or even 2007 for another 1.5 to 2.5 years!
Saturday, September 5, 2015
Weekly Indicators for August 31 - September 4 at XE.com
- by New Deal democrat
My Weekly Indicators post is up at XE.com.
This week particularly highlighted the bifurcation between those parts of the US economy most exposed to the global slowdown, and those most focused on domestic consumption.
Friday, September 4, 2015
August jobs report: Meh headliine, great internals except wage growth still stinks
- by New Deal democrat
HEADLINES:
- 173,000 jobs added to the economy
- U3 unemployment rate fell -0.2% to 5.1%
With the expansion firmly established, the focus has shifted to wages and the chronic heightened unemployment. Here's the headlines on those:
Wages and participation rates
- Not in Labor Force, but Want a Job Now: down -203,000 from 6.135 million to 5.932 million
- Part time for economic reasons: up 158,000 from 6.325 million to 6.483 million
- Employment/population ratio ages 25-54: up 0.1 from 77.1% to 77.2%
- Average Weekly Earnings for Production and Nonsupervisory Personnel: up +0.2% from $21.02 to $21.07, up +1.9%YoY. (Note: you may be reading different information about wages elsewhere. They are citing average wages for all private workers. I use wages for nonsupervisory personnel, to come closer to the situation for ordinary workers.)
The more leading numbers in the report tell us about where the economy is likely to be a few months from now. These were very positive.
- the average manufacturing workweek rose 0.1 hours from 41.7 hours to 41.8 hours. This is one of the 10 components of the LEI and so will affect it positively.
- construction jobs increased.by 3,000. YoY construction jobs are up 217,000.
- manufacturing jobs decreased by -17,000, and are up 128,000 YoY.
- Professional and business employment (generally higher-paying jobs) increased by 33,000 and are up 643,000 YoY.
- temporary jobs - a leading indicator for jobs overall - rose by 10,700.
- the number of people unemployed for 5 weeks or less - a better leading indicator than initial jobless claims - fell by -393,000 from 2,488,000 to 2,095,000, making a new low for this expansion.
Other important coincident indicators help us paint a more complete picture of the present:
- Overtime fell -0.1 hour from 3.4 hours to 3.3 hours.
- the index of aggregate hours worked in the economy rose by 0.4 from a downwardly revised 103.6 to 104.0.
- The broad U-6 unemployment rate, that includes discouraged workers declined -0.1% from 10.4% to 10.3%.
- the index of aggregate payrolls rose by 0.9% from a downwardly revised 123.7 to 124.6.
- the alternate jobs number contained in the more volatile household survey increased by 196,000 jobs. This represents an increase of 2,585,000 million increase in jobs YoY vs. 2,919,000 in the establishment survey.
- Government jobs rose by +33,000.
- the overall employment to population ratio for all ages 16 and above rose +0.1% from 59.3% to 59.4%, and has risen by +0.1% YoY. The labor force participation rate was unchanged at 62.6% and is down -0.3% YoY (remember, this incl udes droves of retiring Boomers).
SUMMARY:
Only two things held this report back from being Totally Awesome! The first is the headline 140,000 private jobs created, but as most readers probably already know, August numbers have had a history of major upward revisions. The second - sigh - once again is wage growth, which despite a 5.1% U3 unemployment rate is unable to crack 2%. This is terrible and continues to bode ill for the next recession whenver it may come. I still expect this situation to improve once the broader U6 unemployment rate, which fell again this month, finally falls below 10%.
Everything else was damn near, well, awesome. Not only did both unemployment rates fall to new lows, so did short term unemployment (a leading indicator), and those not in the labor force but want a job now fell to a new post-recession low save for one month. Involuntary part time workers did go up, but still are at the second-lowest number since the recession. The manufacturing workweek improved Manufacturing and mining employment did fall, but were more than offset by gains elsewhere. Both aggregate hours and payrools also made a new post-recession high.
All in all, a good report.
Thursday, September 3, 2015
US consumers power past poor manufacturing
- by New Deal democrat
I have a new post up at XE.com, contrasting the slowdown in US manufacturing vs. the strength of the US consumer economy.
A real puzzle about real wages
- by New Deal democrat
This morning the National Employment Law Project (NELP) released its annual update on real wages during the recovery. Their findings are a puzzle to say the least.
Virtually every other measure of real wages shows a bottom in late 2012. (Real wages declined from 2009-12 as the price of gas went from $14.0 to $3.90, hence inflation outstripped miserly nominal wage growth):

In contrast, here is the NELP graph of real occupation wage changes from 2009-2014:

Note that the OES is calculated through May of each year, so the latest report misses the effect of the big decline in gas prices in the last 12 months.
It is virtually gospel that as the labor market improves, so should wage growth. In other words, wages could be down from 2009, but up from 2012 or 2013. So I went back and compare the NELP's latest report with earlier reports. Here is what I found:
From 2009 through 2013:

and from 2009 through 2012:

In case it isn't obvious from the graphs, according to the NELP, wage declines have increased across every single wage quintile from 2012 to 2013, and even more in from 2013 to 2014! Even with the NELP saying that hiring in high wage jobs took off in 2013 into 2014.
To double-check the NELP data, I went to the OES database, which can be found here: (http://www.bls.gov/oes/tables.htm) and obtained the median hourly pay for all occupations for each year 2009-14, and then divided by the change in prices as calculated by the CPI from May 2009 (the OES is calculated as of May of each year), and here is what I got (pay in column 1, CPI change from 5/09 in column 2, "real" pay in column 3, and the YoY change in "real" pay column 4):
2009 $15.95
2010 $16.27 2.1 $15.94 -0.1
2011 $16.57 5.2 $15.75 -1.3 -1.2
2012 $16.71 7.6 $15.53 -2.6 -1.3
2013 $16.87 8.8 $15.51 -2.8 -0.2
2014 $17.09 10.9 $15.41 -3.6 -0.8
2010 $16.27 2.1 $15.94 -0.1
2011 $16.57 5.2 $15.75 -1.3 -1.2
2012 $16.71 7.6 $15.53 -2.6 -1.3
2013 $16.87 8.8 $15.51 -2.8 -0.2
2014 $17.09 10.9 $15.41 -3.6 -0.8
The NELP shows real median wages down -4.0%, not -.3.6%, since 2009, so they appear to be using a different inflation adjustment.
But more importantly, the OES data shows not just a continuous decline from 2009, but the decline in real wages actually *accelerating* from 2013 to 2014 -- much moreso than during the much weaker labor market of 2009-10!
I'm at a loss for an explanation. This data cannot be dismissed as at outlier because it is very thorough. But still it is not at all in accord with what other data on real wages have been showing.
Is it possible that there has been a dynamic process where ever more employers are learning that they can freeze employee wages and get away with it? This is a real puzzle.
Wednesday, September 2, 2015
Forecasting the 2016 election economy: using housing permits toforecast the unemployment rate
D
- by New Deal democrat
One of the best economic indicators for the electoral success (or not) of the incumbent party in Presidential elections has been whether the unemployment rate during the 2nd and 3rd quarters of the election year is declining or not.
Among economic indicators, the unemployment rate is unusual. In and after recessions, it is a lagging indicator. At economic peaks, however, it is a leading indicator. In other words, it is overly sensitive to the downside, turning negative before a recession, but remaining negative after the recession is over.
One good way to anticipate the unemployment rate is to look at long leading indicators. Specifically in this post I am going to examine the relationship between building permits and the unemployment rate. The interactive graph of housing permits and the unemployment rate can be found here .
To give you the easy overall picture, let's put up the graphs. First, here are housing permits (blue, left scale) and the unemployment rate (red, inverted, right scale):


The median number of months by which the unemployment rate lags housing peaks is 12 months, and for troughs is 10 months.
That tells us that the unemployment rate should continue to trend lower through at least about next May.
The next two graphs are the YoY% change in permits (blue) vs. the YoY% change in the unemployment rate (red, inverted), for 1964-84, and then for 1985-2015:


That permits lead the unemployment rate is obvious .
Further, we can say with certainty as to the last 50 years that when housing permits have advanced by more than 10% YoY, the unemployment rate YoY has never turned negative. Similarly, with one exception (December 1987 and January 1988), whenever permits have been negative by more than 20%, the unemployment rate has always turned negative.
Unfortunately, from December 2013 through April 2015, permits while positive were up by less than 10% YoY. Here the record is more mixed. In the last 50 years, there have been similar slowdowns 8 times. On 4 of those occasions, the unemployment rate never turned negative YoY. On the other 4, unemployments did turn negative. Conversely, in the last 50 years, there have been 6 times that permits turned negative, but less so than 20%. Of those occasions, the unemployment rate also turned negative YoY twice. In the remaining 4 times, the unemployment rate YoY remained positive.
Turning back to the 4 occasions where a slowdown in the growth in housing permits led to a YoY increase in the unemployment rate, the lead times were 8, 13, 13, and 14 months on the way down and -1, 2, 6, and 14 months, respectively.
In other words, if the slowdown in permits that began in December 13 were to have led to a YoY increase in the unemployment rate, based on the admittedly limited sample we would expect that downturn to have already started, and a coin flip as to whether it would already be over.
Even where there has been a downturn in permits without a recession, the negative turn in the unemployment rate began between 2 and 11 months later, and ended from 1 to 12 months later.
Finally, the trough in the unemployment rate has followed the trough in permits (including both slowdowns and downturns) by a median of 5 months. Since the YoY trough in permits occurred in April 2015, this means the YoY trough in the unemployment rate should occur this month (September) and almost certainly no later than April 2015.
Finally, here is a slightly different look: the YoY change in permits (blue, in 100,000s) vs. the YoY change in the unemployment rate (inverted, red):

Here is a close-up of the last 5 years:

While the same general leadling/lagging relationship is apparent, this measure highlights how unusual 2014 was. Permits increased YoY generally all year, but only slightly, i.e., by less than 100,000. In the last 50 years there have been only 2 similar periods, 1962, 1968 (somewhat), and 1986 (shown in the graphs below).


Typically, permits have merely "passed through" the range of 0 to +100,000 YoY on the way to a stronger expansion on the way up, or a recession on the way down, so the extended pause was anomalous.
In 1963, the unemployment rate actually rose slightly (by less than 0.5%) in response to the poor housing market the year before. The lag between the beginning of the pause in permits and the rise in the unemployment rate was 9 months. The trough in permit growth was also 9 months after the onset. The worst YoY unemployment rate comparison happened both 9 and 11 months after the onset of weakness in permits. The lag at end of the pause was 16 months. This is the "worst case" scenario for the incumbent party. If this were to happen now, it would suggest the worst YoY comparisons for the unemployment rate in the 2nd quarter of 2016,
In 1987 and 1988, the unemployment rate gradually tailed off YoY from a decline of -1.0% to -0.5%. Permits in 1968 were very gradually decelerating until they outright declined in 1969. The unemployment rate in 1969 gradually rose into the 1970 recession.
The bottom line is:
1. We are currently in a softening of the YoY% change in the unemployment rate, that began in December 2014, forecast by the slowdown in building permits
2. Based on past incidents, we should be near the maximum point of that slowdown.
3. The softening in the YoY decline in the unemployment rate should pass by the 2nd quarter of 2016.
4. In the worst case scenario for the incumbent party, based on 1962-63, the unemployment rate might rise slightly over the next few months before resuming its decline by the end of this winter.
5. The most likely scenario is that, with some monthly variation, the unemployment rate should continue to decline through at least through next March, and probably through next May. Beyond that is presently unknown.
This is good news albeit preliminarily for the democratic Presidential candidate.
One of the best economic indicators for the electoral success (or not) of the incumbent party in Presidential elections has been whether the unemployment rate during the 2nd and 3rd quarters of the election year is declining or not.
Among economic indicators, the unemployment rate is unusual. In and after recessions, it is a lagging indicator. At economic peaks, however, it is a leading indicator. In other words, it is overly sensitive to the downside, turning negative before a recession, but remaining negative after the recession is over.
One good way to anticipate the unemployment rate is to look at long leading indicators. Specifically in this post I am going to examine the relationship between building permits and the unemployment rate. The interactive graph of housing permits and the unemployment rate can be found here .
To give you the easy overall picture, let's put up the graphs. First, here are housing permits (blue, left scale) and the unemployment rate (red, inverted, right scale):
The median number of months by which the unemployment rate lags housing peaks is 12 months, and for troughs is 10 months.
That tells us that the unemployment rate should continue to trend lower through at least about next May.
The next two graphs are the YoY% change in permits (blue) vs. the YoY% change in the unemployment rate (red, inverted), for 1964-84, and then for 1985-2015:
That permits lead the unemployment rate is obvious .
Further, we can say with certainty as to the last 50 years that when housing permits have advanced by more than 10% YoY, the unemployment rate YoY has never turned negative. Similarly, with one exception (December 1987 and January 1988), whenever permits have been negative by more than 20%, the unemployment rate has always turned negative.
Unfortunately, from December 2013 through April 2015, permits while positive were up by less than 10% YoY. Here the record is more mixed. In the last 50 years, there have been similar slowdowns 8 times. On 4 of those occasions, the unemployment rate never turned negative YoY. On the other 4, unemployments did turn negative. Conversely, in the last 50 years, there have been 6 times that permits turned negative, but less so than 20%. Of those occasions, the unemployment rate also turned negative YoY twice. In the remaining 4 times, the unemployment rate YoY remained positive.
Turning back to the 4 occasions where a slowdown in the growth in housing permits led to a YoY increase in the unemployment rate, the lead times were 8, 13, 13, and 14 months on the way down and -1, 2, 6, and 14 months, respectively.
In other words, if the slowdown in permits that began in December 13 were to have led to a YoY increase in the unemployment rate, based on the admittedly limited sample we would expect that downturn to have already started, and a coin flip as to whether it would already be over.
Even where there has been a downturn in permits without a recession, the negative turn in the unemployment rate began between 2 and 11 months later, and ended from 1 to 12 months later.
Finally, the trough in the unemployment rate has followed the trough in permits (including both slowdowns and downturns) by a median of 5 months. Since the YoY trough in permits occurred in April 2015, this means the YoY trough in the unemployment rate should occur this month (September) and almost certainly no later than April 2015.
Finally, here is a slightly different look: the YoY change in permits (blue, in 100,000s) vs. the YoY change in the unemployment rate (inverted, red):
While the same general leadling/lagging relationship is apparent, this measure highlights how unusual 2014 was. Permits increased YoY generally all year, but only slightly, i.e., by less than 100,000. In the last 50 years there have been only 2 similar periods, 1962, 1968 (somewhat), and 1986 (shown in the graphs below).
Typically, permits have merely "passed through" the range of 0 to +100,000 YoY on the way to a stronger expansion on the way up, or a recession on the way down, so the extended pause was anomalous.
In 1963, the unemployment rate actually rose slightly (by less than 0.5%) in response to the poor housing market the year before. The lag between the beginning of the pause in permits and the rise in the unemployment rate was 9 months. The trough in permit growth was also 9 months after the onset. The worst YoY unemployment rate comparison happened both 9 and 11 months after the onset of weakness in permits. The lag at end of the pause was 16 months. This is the "worst case" scenario for the incumbent party. If this were to happen now, it would suggest the worst YoY comparisons for the unemployment rate in the 2nd quarter of 2016,
In 1987 and 1988, the unemployment rate gradually tailed off YoY from a decline of -1.0% to -0.5%. Permits in 1968 were very gradually decelerating until they outright declined in 1969. The unemployment rate in 1969 gradually rose into the 1970 recession.
The bottom line is:
1. We are currently in a softening of the YoY% change in the unemployment rate, that began in December 2014, forecast by the slowdown in building permits
2. Based on past incidents, we should be near the maximum point of that slowdown.
3. The softening in the YoY decline in the unemployment rate should pass by the 2nd quarter of 2016.
4. In the worst case scenario for the incumbent party, based on 1962-63, the unemployment rate might rise slightly over the next few months before resuming its decline by the end of this winter.
5. The most likely scenario is that, with some monthly variation, the unemployment rate should continue to decline through at least through next March, and probably through next May. Beyond that is presently unknown.
This is good news albeit preliminarily for the democratic Presidential candidate.
Tuesday, September 1, 2015
Monday, August 31, 2015
Comparing labor market recoveries
- New Deal democrat
With few exceptions, people don't get a job for social reasons. They go to work each day in order to earn money to purchase necessities, discretionary goods, and to save for future needs. In short, they work because of cold, hard cash.
So why is it that most economic writers appear to think the defining element of a labor market recovery after a recession is the number of jobs created? Isn't the better measure the amount of cold, hard cash it is delivering to workers? That, dear reader, is measured by real aggregate wages, and that, I believe, is the best measure of labor market recoveries.
Let me give you a few examples.
First, compare an economy that creates 1 million 40 hour a week jobs at $10/hour, with an economy that creates 2 million jobs at 10 hours a week at $10/hour. If we were to count by job creation, the second economy would be better. But that's clearly not the case. The second economy is paying out only half of the cold hard cash to workers as the first.
Next, let's compare two economies that both create 1 million 40 hour a week jobs, but one pays $10/hour and the other pays $12/hour. Clearly the second economy is better. It is paying workers 20% more than the first.
Finally, let's compare two economies that create 1 million 40 hour a week jobs at $10/hour. In the first economy, there are 3% annual raises, but inflation is rising 4%. In the second, there are 2% annual raises, but inflation is rising 1%. Again, even though the second economy is giving less raises, it is the better one -- those workers are seeing their lot improve in real, inflation-adjusted terms, whereas the workers in the first economy are actually losing ground.
In each case, the economy creating more jobs, or more hourly employment, is inferior to the economy that pays more in real wages to its workers, In other words, the best measure of a labor market recovery is that economy which doles out the biggest increase in real aggregate wages.
So let's compare the increase in real aggregate wages -- the total wages paid to all nonsupervisory workers, adjusted for inflation, from their bottom in each recession. Since that was 5 years and 9 months ago for our current recovery, that will be our measuring stick. This is calculated as follows: average hourly earnings for nonsupervisory workers, times average hours worked, times the number of jobs, and then divided by the consumer price index, with the result indexed to 100 at the bottom. Here are the results:
| Trough | Peak | #months | Real wage growth % | Wage growth per month % | Wage growth at 69 months |
|---|---|---|---|---|---|
| 1/64* | 8/69 | 67* | 30.2 | .45 | 30.0% |
| 11/70 | 5/74 | 30 | 18.5 | .62 | 11.8%*** |
| 4/75 | 3/79 | 47 | 20.8 | .44 | 11.5%*** |
| 7/80 | 1/81 | 6 | 2.4 | .40 | 9.3%*** |
| 11/82 | 10/89 | 83 | 21.6 | .26 | 18.4% |
| 2/92 | 11/00 | 105 | 33.8 | .32 | 21.7% |
| 4/03 | 9/07 | 53 | 10.5 | .20 | 8.0% |
| 10/09 | 7/15** | 69** | 16.3 | .24 | 16.3% |
*start of series
**to date
***Measured through the next recession, as recovery was short-lived
The interactive FRED graph of real aggregate wages can be found here.
An interesting aside is that the "Reagan recovery" of the 1980s is either great or mediocre depending on where you measure. In the first 14 months, real aggregate wages grew 7.9%, or a blistering .56% a month! In the last 69 months, however, they grew only 9.3%, or a miserable .13% a month. Had I measured back from the end rather than forward from the beginning, the current labor market recovery would be stronger.
The interactive FRED graph of real aggregate wages can be found here.
An interesting aside is that the "Reagan recovery" of the 1980s is either great or mediocre depending on where you measure. In the first 14 months, real aggregate wages grew 7.9%, or a blistering .56% a month! In the last 69 months, however, they grew only 9.3%, or a miserable .13% a month. Had I measured back from the end rather than forward from the beginning, the current labor market recovery would be stronger.
We can immediately see the effect of labor bargaining power, as all of the economic expansions before the 1980s showed far faster real aggregate wage growth per month than any expansion since. On a per-month basis, the current labor market recovery is only better than the George W. Bush recovery. Over the total recovery, the current recovery is only better than the George W. Bush recovery, and the 6 month recovery at the end of Jimmy Carter's term.
But because it is longer lasting, however, after 69 months the current labor market recovery has a better record than the short-lived recoveries of the 1970s and the brief 1981 recovery as well. By this measure it only lags the 1990s recovery as well as the 1960s, and, depending on whether you measure forward from the beginning or back from the end of the 1980s recovery, the current recovery is slightly worse, or significantly better than that labor market recovery. Should the current recovery last another 24 months, it will probably surpass the Reagan recovery by either measure.
The bottom line is that the record of this labor market recovery is mixed: poor monthly growth due to nonexistent labor bargaining power; but good total growth based on its persistence.
Saturday, August 29, 2015
Weekly Indicators for August 24 - 28 at XE.com
- by New Deal democrat
My Weekly Indicator piece is Up at XE.com . There were no significant changes this week.
Friday, August 28, 2015
Corporate profits in Q2 set another record
- by New Deal democrat
Since corporate profits are a long leading indicator for the economy, and stock prices a short leading indicator, that means ... I have an important post up at XE.com .
BTW, sorry about the light posting here this week. I have been working on a bunch of things, but partly due to real life, and partly due to this week's exciting action at the dog track, it made sense to post more topical financial markets stuff over at XE.
Wednesday, August 26, 2015
A simple point about the Chinese stock market crash
- by New Deal democrat
As I wrote yesterday, the only thing that has been added to the economic news this summer, that we didn't already have last fall, is the Chinese stock market crash. And wherever that crash is going to bottom out, it is most of the way there.
Here is a graph of the Shanghai index for the last 25 years:

Notice that the recent market bubble and burst aren't as severe as the 2008 crash, in which the Shanghai composite lost about 70% of its value from peak to trough. And then bounced back smartly.
Here's a close-up of 2015:

The Shanghai composite is already down 45%. Most of the damage has been done.
No inside information, but the big selloffs in the late afternoons the last two days have to odor of forced liquidation. We saw a similar pattern in October 2008 after the September crash. The forced liquidation reached a climax, and that was the bottom.
By the way, here is what American corporate insiders have been doing:

They've been buying, and that was before the big downturn in the last week.
My focus in this blog is on the economy, not on investing. And my focus on the economy is mainly about jobs and wages. While I have a sneaking suspicion that one or more hedge funds will be carried out on their shield in the very near future, I just don't see this as having a big impact on the US economy at large, although job and wage *growth* will probably stall or decelerate.
Bottom line: whatever collateral damage a Chinese stock market crash might do to the US economy is almost certainly already priced in at this point.
Tuesday, August 25, 2015
Subscribe to:
Posts (Atom)