Tuesday, December 5, 2023

October JOLTS report: yet one more month in the ongoing decelerating trend


 - by New Deal democrat 


All of the major metrics in this month’s JOLTS report for October continued to show deceleration. Here are openings (blue), hires (red), and quits (gold), all normed to 100 just before the pandemic:


As you can see, at 98.1 and 103.9 respectively, both hires and quits are virtually identical to where they were before the pandemic. Meanwhile job openings declined to their lowest level since early 2021, and are down 2/3’s from their post-pandemic peak towards their prior levels. The one positive is that neither quits nor hires have deteriorated signifiantly in the past three months.

Meanwhile the number of layoffs and discharges increased, although not to a new high, and the trend this year can be read as either flat or increasing:


Finally, three months ago I premiered a comparison of the quits rate (blue in the graph below) and average hourly earnings (red). This is because the former has a 20+ year history of leading the latter, which I have in the past described as a “long lagging” indicator that turns well after most other metrics. Here’s the update on that comparison for this month:


The good news is that the quits rate has held steady since July. But because wages lag, they are more likely than not going to decline YoY from last month’s 4.4% YoY growth, although holding steady or a slight increase to 4.5% can hardly be ruled out.

In conclusion, we have yet another month confirming the ongoing deceleration in the jobs market. 

Monday, December 4, 2023

A big increase holds up construction spending in October; and construction spending is holding up the economy


 - by New Deal democrat


Construction spending for October was reported last Friday, and every sector but nonresidential ex-manufacturing showed increases:


Total spending was up 0.6%, residential a sharp 1.2%, and manufacturing 0.9%. Only nonresidential ex-manufacturing declined, by less than -0.1%.

The big increase in manufacturing construction due to the Inflation Reduction Act, which has encouraged re-shoring, has helped keep total construction spending positive. But so has other non-residential construciton, as shown by this graph which norms each category to zero just before the pandemic:


On a YoY basis manufacturing is the star of the show. But note from the historical graph that residential construction previously has turned down first, with manufacturing and other non-residential construction lagging (likely because of long lead times and the extended duration of completing projects):


But as the first graph above shows, on an absolute scale manufacturing construction has been a secondary player except for the period between December of last year and May of this year, in which it accounted for almost 2/3’s of the entire gain. Since then, residential construction improvement has again moved to the fore.

Historically residential construction spending has moved generally on a coincident basis with the number of building units under construction (except that the former, of course, is affected by inflation):


The decline in building costs (gold, below) helps explain why residential building construction has not just held up, but actually increased even as a big increase in mortgage rates has caused a big decline in permits and starts:


And the fact that construction spending has improved so much is a big reason why the economy has continued to expand. With manufacturing less of a factor overall, construction is a bigger pard of the goods-producing part of the economy. Unless and until construction rolls over, therefore, it is unlikely that the economy as a whole will roll over as well.

Sunday, December 3, 2023

Weekly Indicators for November 27 - December 1 at Seeking Alpha; plus a comment on the ISM manufacturing report


 - by New Deal democrat


My Weekly Indicators post is up at Seeking Alpha.


The coincident data continues quite strong, and the long leading indicators are increasingly “less bad,” which is something that happens when recessions are beginning to ebb.

As usual, clicking over and reading will bring you up to the virtual moment as to the economy, and bring me a little bit of Holiday Cheer.

While I am at it, as noted on Friday, let me make a couple of comments about the latest ISM manufacturing report. I’m going to discuss construction spending separately in a day or two.

While both the headline and new orders numbers continued to show contraction, at 46.7 and 48.3, respectively, note that the trend in new orders in particular over the past few months is slight improvement:


The bottom line of which is, if there was no recession when the new orders index was coming in at levels under 45 earlier this year, it is unlikely that there is one now. Partly this is because the ISM survey is a diffusion index (i.e., unweighted), and so it has not been showing the relative strength in the important motor vehicle and parts manufacturing sector; and partly it is that manufacturing in the US is less a proportion of GDP than it was in the second half of the 20th century - so it takes a bigger decline to make a similar impact.

If the Fed-induced downturn in credit conditions and loan applications spreads out further into the economy, it is going to take an actual downturn in ongoing construction (of which there is scant evidence so far) to produce it.

Friday, December 1, 2023

Ex-housing, PCE inflation, like CPI inflation, is under th Fed’s 2% target


 - by New Deal democrat


Note: I may not be around for the ISM manufacturing or construction spending reports this morning. If so, I’ll comment later (maybe over the weekend) about them. What I’ll be watching for: as to manufacturing, because the ISM is a diffusion index, it didn’t pick up the big increase in vehicle manufacturing earlier this year. How does that shake out for October (bearing in mind the UAW strilke)? As to construction spending, which typically trends in conjunction with building units under construction, does it hold up, or turn down (signaling a decline in housing construction)?


One thing I didn’t comment on with regard to yesterday’s personal income and spending report was inflation. So let’s take a look today. Spoiler alert: it generally mirrors the CPI report.

To begin with, PCE inflation for over a year has been all about services. Since June of last year, there has been *no* inflation in goods prices (red in the graph below). In the past 6 months, while total PCE inflation (gold) has been 1.2%, goods inflation has been a whopping 0.2%. Services inflation (light blue) has been 1.8% (or 3.7% annualized). Backing out housing and energy, services inflation (dark blue) is up 1.5% (or 3.0% annualized):


Another way to look at this is the month over month (light blue) or quarter over quarter (dark blue) changes in the PCE index excluding energy and housing, vs. the quarter over quarter changes in housing plus utilities (red):


In Q3, the former was up 0.8%, while the latter increased 1.3%. In October, the former increased less than 0.2%. 

As with CPI inflation, it’s clear that housing is the culprit. 

Harvard economist Jason Furman posted a couple of similar graphs yesterday, showing the monthly and 3 month average of the core PCE price index ex-housing:


And including housing, but substituting current rent increases for the official measure:


As he writes, core ex-housing is up only 1.7% YoY, and substituting current rents for the official measure of housing is up only 1.5%.

Just as a refresher, this is exactly what CPI ex-shelter looks like:


To be absolutely clear: the PCE inflation gauges, just like the CPI measures, show that excluding housing, inflation is already under the Fed’s 2% target. And if we include more current rent and house price measures, it is even a little lower than that. 

Please do note that in the past few months, both PCE ex-shelter and CPI ex-shelter have bottomed. They aren’t really increasing, but they’ve stopped decreasing. But - I know I’ve said this before - there really is no valid reason for the Fed to maintain a restrictive posture on interest rates. Indeed, if the Fed lowered rates a little, and mortgage rates declined to, say 5.5%, that might break the logjam in the existing home market, and via more inventory paradoxically help keep prices down.

Thursday, November 30, 2023

Despite a few soft spots, consumer income and spending continued to power ahead in October


 - by New Deal democrat


The monthly personal income and spending report is along with the jobs report, one of the two most important coincident metrics for the entire economy, because it is a fairly comprehensive look at the consumer sector.


In October both nominal and real personal income and spending increased 0.2%. Since the beginning of the pandemic, real income is up 5.8%, and real spending is up 9.7% (thank you, COVID stimulus payments!):


Both of these have consistently risen since the peak in gas prices in June 2022.

There are several slightly leading components in this report. The first is the personal savings rate, which tends to decrease as confident consumers spend during expansions, and increase just before recessions as consumers begin to pull in their horns. In October the savings rate increased 0.1% to 3.8%, but is down 1.5% from its level in May (the biggest part of the explanation for the blockbuster Q3 GDP report), and remains at low levels only seen in 2005-07 and in 2021 just after the stimulus payments (below graph subtracts -3.8% to show current level at the zero line):


There is no sign of consumers pulling in their horns here.

Secondly, while real spending on services has historically continued to rise even through recessions, real spending on goods, and especially durable goods, tends to decline beforehand. The below graph, again normed to 100 just before the pandemic, shows that both have continued to rise through October, up 0.1% and 0.2% respectively:


Real spending on goods has increased sharply earlier this year, but being up 2.1% on a 12 month basis is equivalent to YoY comparisons in past slowdowns as well as recessions (graph below subtracts 2.1% to show current level at the zero line):


We can break down goods spending further between durable and non-durable goods, since the former tend to turn first. Indeed, real durables spending did decline -0.3% for the month, while non-durables spending increased 0.3%:


This shows that the relative slowdown in the recent few months has been centered on durable goods, while non-durables spending has increased sharply. Again, current YoY spending on durable goods is equivalent to both slowdowns and recessions historically:


One important word of caution: spending on goods and durables in particular may have been influenced by the autoworkers’ strike, so take with a grain of salt this month.

There are two other coincident metrics that are paid particular attention to by the NBER.  The first is real personal income ex-government transfer payments. This also increased 0.3%, and is up 2.3% YoY:


The second is real manufacturing and trade sales. This increased a sharp 0.9% in September, and is up 3.4% YoY. This has a great deal to do with consumer disinflation and some outright producer prices deflation (note it has also generally increased since June 2022):


To sum up: although there were a few soft spots (spending on durables, a slight increase in savings), consumers generally continued to power ahead in October, fueled by continuing increases, even after inflation, in income.

Despite the continued elevation of continued claims, initial claims signal continued expansion


 - by New Deal democrat


I’ll comment on personal income and spending later this morning, but let’s start out with our weekly update on jobless claims.


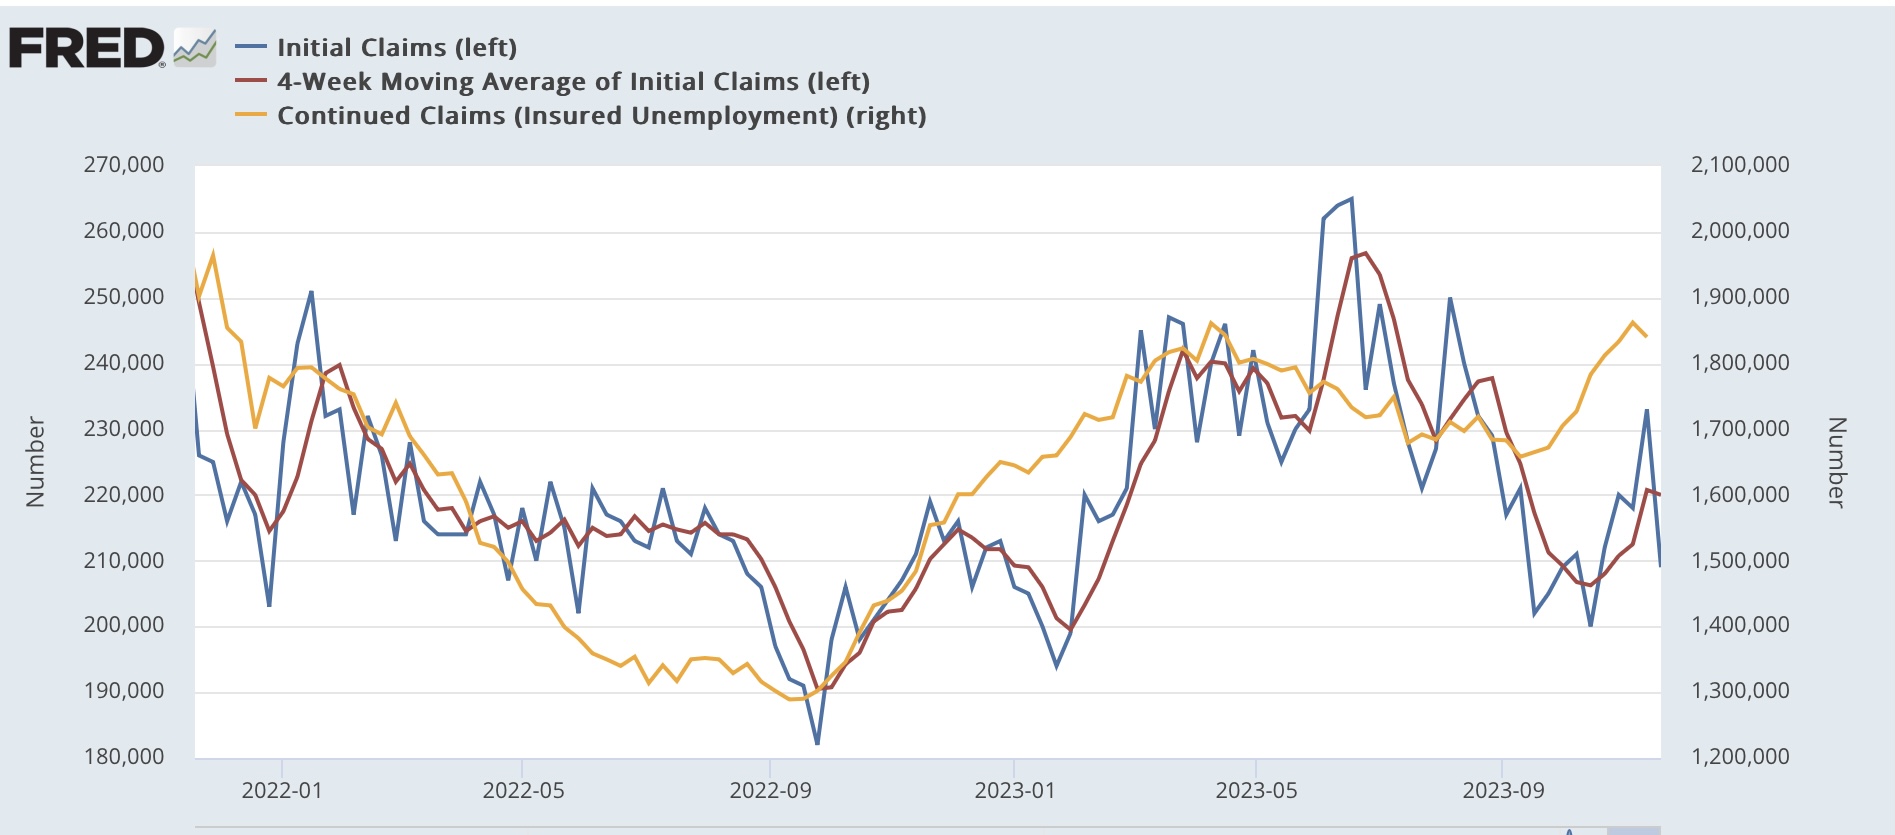
Initial claims rose 7,000 to 218,000, while the 4 week average declined -500 to 220,000. With a one week delay, continuing claims rose 86,000 to 1.927 million, a nearly 2 year high:


On the more important (for forecasting purposes) YoY basis, initial claims were up 2.3%, the 4 week average up 3.5%, and continuing claims up 24.0%:


The YoY increase in continuing claims has gotten a fair amount of attention recently, because historically that big an increase has always meant a recession is already occurring. While it clearly shows that in at least several sectors of the economy people are not finding jobs very quickly, historically initial claims have led continuing claims. And also notice that the YoY increase in continuing claims has not gotten worse in over half a year - with no recession yet. So I am discounting that metric unless and until YoY initial claims agree. And with increases less than 5%, initial claims are in no way signaling any imminent recession.

Finally, since initial claims lead the unemployment rate, let’s update our look at the Sahm rule:


Initial claims are forecasting an unemployment rate of 4.0% or below in the next few months (3.5%*1.1), and likely lower than that a little afterward (3.5% or 3.6%*1.05). In short, initial claims are not indicating that the Sahm rule will be triggered in the months ahead.

Wednesday, November 29, 2023

Forecasting a further upturn in the unemployment rate: what works?


 - by New Deal democrat


Yesterday I read a post over at Seeking Alpha in which the author confidently predicted a recession in Q1 next year, based exclusively on the NAHB builder sentiment index. Here’s his accompanying graph, comparing builder sentiment with the unemployment rate 17 months later:


In case you didn’t already figure it out, the graph forecasts a 7% unemployment rate about 8 months from now. That’s one heckuva recession!

My first thought was that, while there clearly is a historical relationship, I hope the author wasn’t really just relying on one data point. The NAHB correlates very closely with mortgage rates, which are important, but hardly a single dispositive metric. In particular, note what happened back in 1994 and 1995 when Alan Greenspan raised interest rates sharply - and yet the unemployment rate continued to go down.

I wondered if other metrics from the housing sector had a closer relationship with the unemployment rate. In this regard, let me reiterate that while the unemployment rate is a lagging indicator coming out of recessions, it is a leading one going in. The unemployment rate has *always* risen off its lows before a recession begins. So we are asking, “is there a better leading indicator for the leading indicator (going in to recessions) of the unemployment rate?”

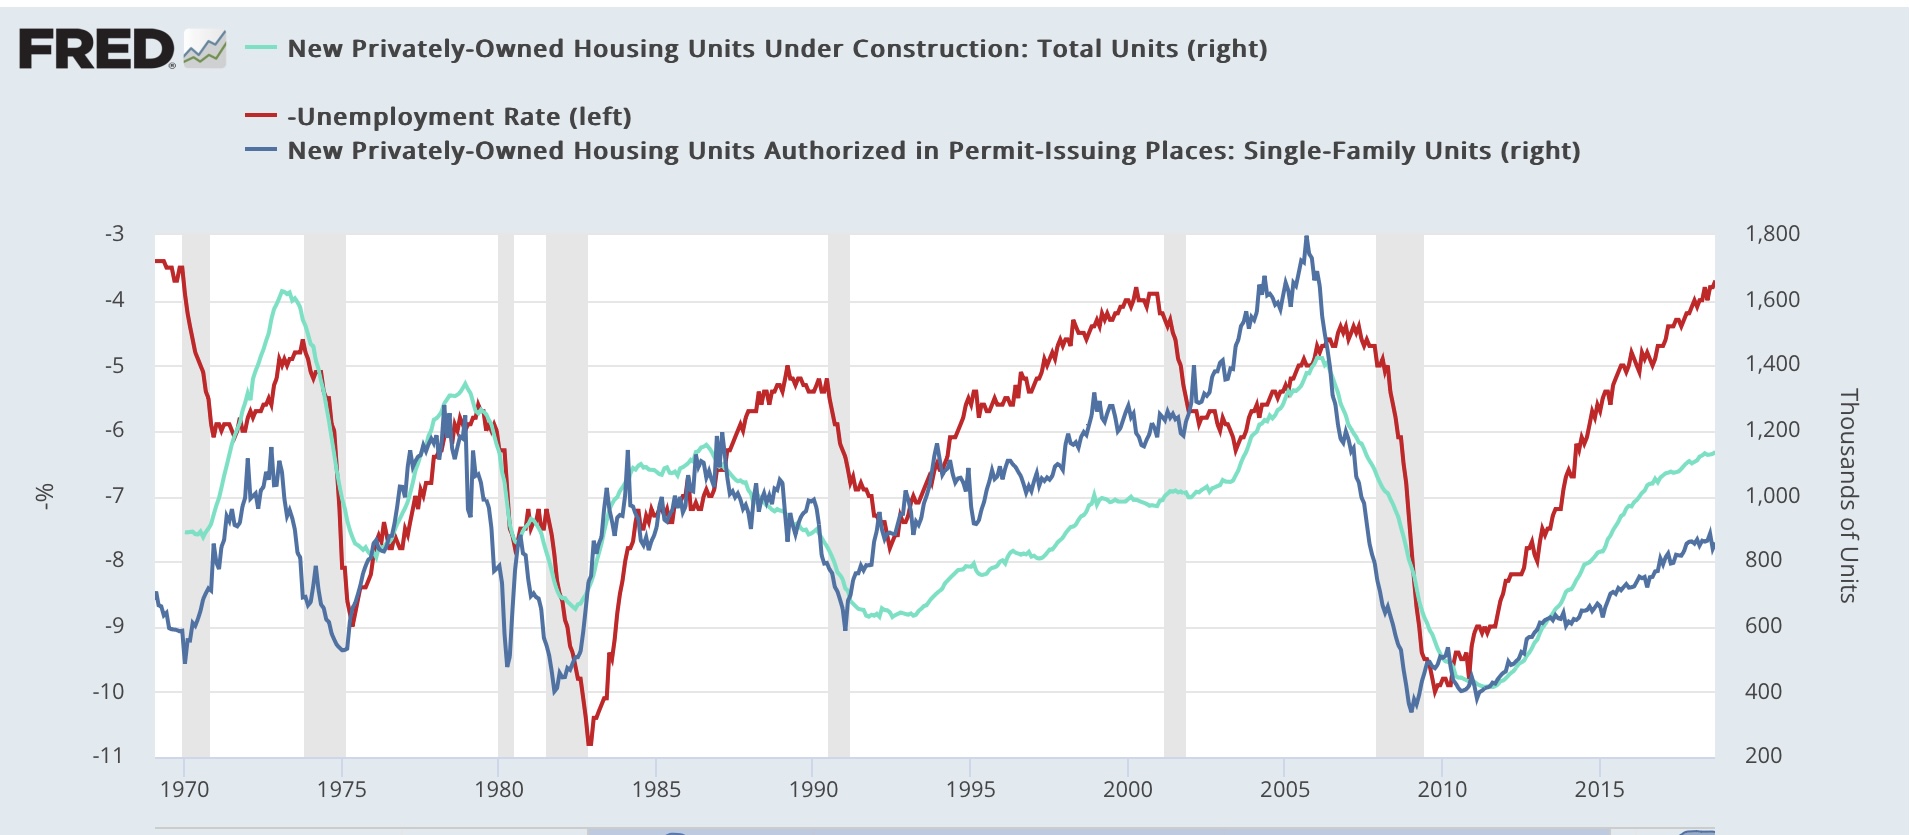
So, here is the historical data for housing permits (dark blue) and housing units under construction (light blue) compared with the unemployment rate (inverted, as in the author’s graph above):


And here is the post-pandemic record:


Historically, both permits and units under construction have turned down before the unemployment rate increased. And although they turn later, units under construction performed almost perfectly in 1994-95, continuing to increase throughout the period exactly as unemployment continued to decrease.

And in the present expansion, units under construction did peak in October 2022, three months before the nadir of the unemployment rate. As I’ve written in previous posts, units under construction with one exception have had to decline about 10% or more before signaling recession.

This also led me to wonder if any of the leading metrics in the employment report typically lead the unemployment rate. With two exceptions, the answer is “no.”

Below I show total goods producing employment (blue), manufacturing (green), construction (purple), and trucking (light blue) compared with the unemployment rate (red, inverted). First, historically:


Here is their post-pandemic record:


All of these generally have turned simultaneously with the increase in unemployment, although several times trucking or construction turned down first. At present, only trucking has turned down in any significant fashion.

But there are two employment metrics which have typically turned first before the unemployment rate: temporary employment and residential construction. Here’s what residential construction looks like historically:


And here is its recent performance:


Now, here is temporary employment:


Temporary employment did indeed turned down before unemployment increased, and is now down sharply. Residential construction turned down simultaneously with the bottom in unemployment, before anomalously turning back up in the past two months. I am curious if this will be revised away next Friday.

Finally, remember that initial jobless claims have an excellent 50+ year record forecasting changes in the unemployment rate. They forecast the recent upturn, and are suggesting that it will not proceed much further, and indeed will reverse downward, in the coming months.

The bottom line is that the typical historical pattern is being followed so far in our current environment. But until more of the coincident employment metrics turn down, and housing units under construction turn down, I think the forecast based on the NAHB sentiment indicator is not supported.

Tuesday, November 28, 2023

Driven by frozen inventory, repeat home prices continue to increase, but downward pressure on shelter inflation remains


 - by New Deal democrat


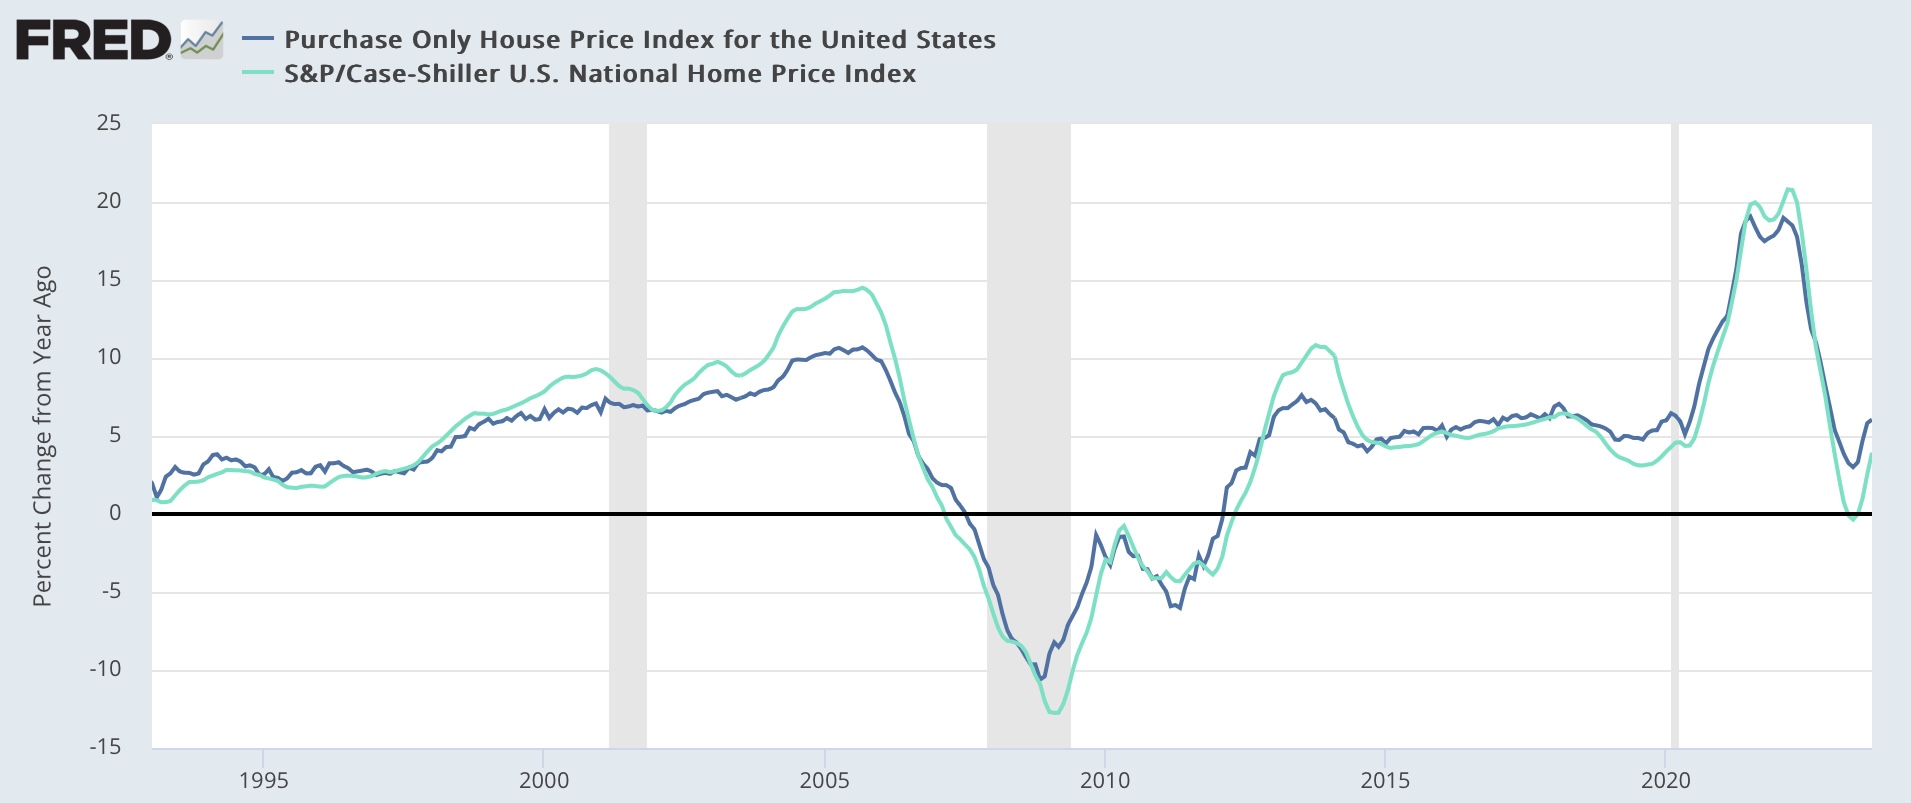
Our last piece of important housing information for the month was released this morning; namely repeat home sale prices as measured by the FHFA and Case Shiller. The former increased by 0.6%, and the latter by 0.3%, continuing their increases since the beginning of this year:


On a YoY basis, the FHFA Index is up 6.1%, while the Case Shiller Index is up 3.9%:


As repeat sales, by definition these are existing home sales, and the increases in these indexes are similar (on a non-seasonally adjusted basis) to the last year’s record in the NAR data:


The story continues to be that many existing homeowners are frozen in place by 3% mortgages. They are not selling and saddling themselves with new 7% or 8% mortgages. So inventory is way down, and buyers, especially entry level buyers, have to compete for that small inventory. This is completely different from the new home market, where homebuilders are using mortgage rebates and other incentives, such as smaller home sizes, to lower the cost to buyers, and so sales have not suffered nearly as much.

Finally, because sales prices lead the CPI measure for shelter via fictitious Owners’ Equivalent Rent, here is the YoY comparison of each:


The upturn in repeat sales prices will probably have some softening effect on the downward slope of OER in the months ahead, but the expected downward slope remains very much intact.

Monday, November 27, 2023

Two year low in new home prices and turndown in sales show renewed pressure caused by increased mortgage rates


 - by New Deal democrat


Once again, this morning’s report on new single family home sales shows that the compete bifurcation of the new vs. existing home markets continues. Unlike existing homeowners, many of whom are shackled in place by 3% mortgages, new home builders can offer price incentives and downsize floor plans to increase sales. This morning’s report also shows once again that this data is very volatile and heavily revised.

September new home sales (blue in the graph below, left scale), which had been reported at a 12 month high of 759,000 annualized, were revised downward by -40,000 to 719,000. And October sales were reported at 679,000, close to a 6 month low. Meanwhile prices (red, right scale) declined to a 2 year low of $409,300:


This also yet again demonstrates my mantra that prices follow sales, in this case with a 2 year delay from summer 2020 to summer 2022.

And since sales follow mortgage rates, here is an update of that relationship, comparing the YoY change in mortgage rates (red, inverted, *10 for scale) vs. the YoY% change in new home sales (blue) and single family permits (light blue):


As mortgage rates rose sharply in 2022, permits and sales sank. Mortgage rates moderated throughout early 2023, and both sales and permits responded positively. Indeed, on a YoY basis new home sales are up 17.7% (while prices, as shown in the first graph above are down -17.6%). But in the last 6 months, mortgage rates rose to new highs, and new home sales - usually the first metric to turn - have already responded negatively. Permits are likely to follow shortly.

Averaged together, new and existing home sales combined are down in the aggregate since one year ago, and so are prices. I expect further pressure on both sales and prices in the months to come.

Friday, November 24, 2023

Why the Index of Leading Indicators failed


 - by New Deal democrat


I have a post by the above title up at Seeking Alpha.


The Index of Leading Indicators has persistently declined for 22 months, and is off by a level that in the past has been consistent with already ongoing, deep recessions. And yet the economy has continued to improve.

Clearly there has been a misfire. The above article explains in more detail why I believe this has happened, for one long-term reason, and one unique to the post-pandemic environment.

As usual, clicking over and reading should be rewarding for you and a little bit for me.

Thursday, November 23, 2023

On Thanksgiving, enjoying the bounty of foods native to the New World


 - by New Deal democrat


Happy Thanksgiving to all readers of this old fashioned blog.


One little fact I did not know until this year is that, with just a couple of exceptions, all of the foods that we traditionally put on the table for Thanksgiving dinner all are native to the New World:, including:

Turkey
Cranberries
Squash
Cornbread
Potatoes
Green beans
Sweet potatoes
Pecans
Pumpkins

So, part of the theme of Thanksgiving is enjoying the cornucopia of plenty that the New World provided to us.

Only bread stuffing and pie shells made from wheat are not native.

Some people might also make use of cashews, peanuts, tomatoes, peppers, and/or chili peppers, all of which are also native to the New World. 

And that doesn’t even include vanilla and chocolate, both of which are celebrated on the other 394 days of the year as well!

Wednesday, November 22, 2023

Initial jobless claims confine to forecast benign employment conditions


 - by New Deal democrat


Initial claims declined -14,000 to 209,000 last week, and the four week moving average declined -750 to 220,000. With the usual one week lag, continuing claims declined -22,000 to 1.840 million:


On a YoY basis, both weekly claims and their four week average were up only 4.6%. Continuing claims, which have been much more elevated YoY, were up 24.0%:


This is well below the 10% cautionary level.

There has been some commentary that continuing claims mean a recession is imminent or may even be underway. I am discounting that because initial claims have always signaled first, and also because continuing claims have been in the range of 25%-30% higher YoY for the last 6 months without worsening.

Turning to the update for the Sahm rule, on a monthly basis claims in November so far are up 3.5%. Since initial claims lead the unemployment rate by several months, that suggests an unemployment rate declining to about 3.6% in a few months (i.e., 3.5%*1.035=3.6%) from a more elevated 3.8%-4.0% level:


In short, claims are forecasting continued economic expansion.

Tuesday, November 21, 2023

Existing homeowners with 3% mortgages remain frozen in place, as sales fall to a new 28 year low


 - by New Deal democrat


October marked yet another month in the fully bifurcated housing market, in which most existing homeowners are frozen in place by their 3% mortgages, and buyers have turned to new homes (and in particular condos and apartments) instead.

Existing home sales fell yet again, by 16,000 annualized, to 3.79 million, 45% down from their 2021 peak, and the lowest level since 1995:


This is of a piece with the collapse in purchase mortgage applications, which have also declined to 1995 levels, per Edward Yardeni:


With inventory so restricted, prices have held firm, and have even increased. In October, the median price (which is not seasonally adjusted) rose for the fourth month in a row on a YoY basis, by 3.4%, to $391,800 [note: current month’s data not included in the below graph]:


For comparison, here are new home sales since 1995:


So long as the Fed keeps interest rates elevated, we can expect this trend of a frozen existing home market driving people to purchase new single family homes and condos to continue.

Monday, November 20, 2023

Why has residential building construction remained so strong, despite the recessionary-level decline in permits and starts?


 - by New Deal democrat


As an initial note, there is no economic news today, and for obvious reasons there won’t be on Thursday or Friday either, so don’t be surprised if I take a couple of days off as well.


In the meantime, I’ve been continuing to ponder why housing under construction remains close to its all-time, 50+ year record set one year ago, even though for the past year permits have been down 25% or more from their high set nearly two years ago, and so is the three month average of actual housing starts:


I did some rooting around over the weekend to see if I could find the reason for this seeming levitation, and found some surprising information.

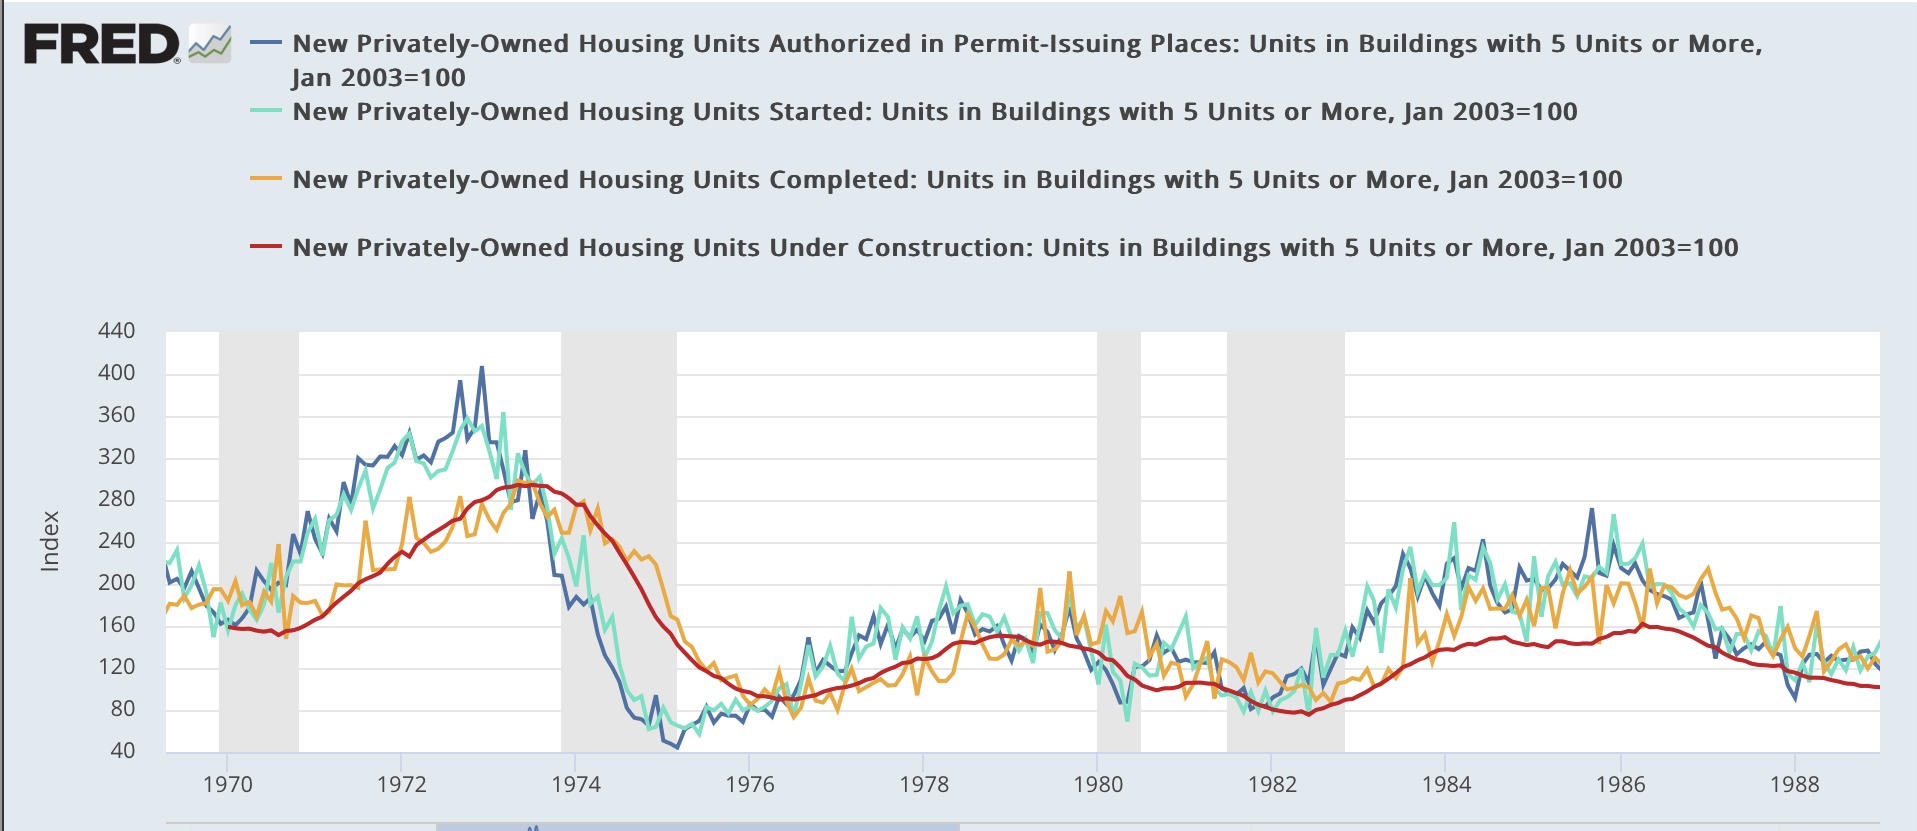
First off, here is a long term historical look at permits (dark blue), starts (light blue), completions (gold) and housing units under construction (red) from the inception of the series through 2003, for multi-family units:


As usual, housing starts are much more volatile than permits, but accord very closely. Completions and units under construction lag, generally by less than a year, but with the exception of a brief period in the mid-1980s, are also in accord with one another.

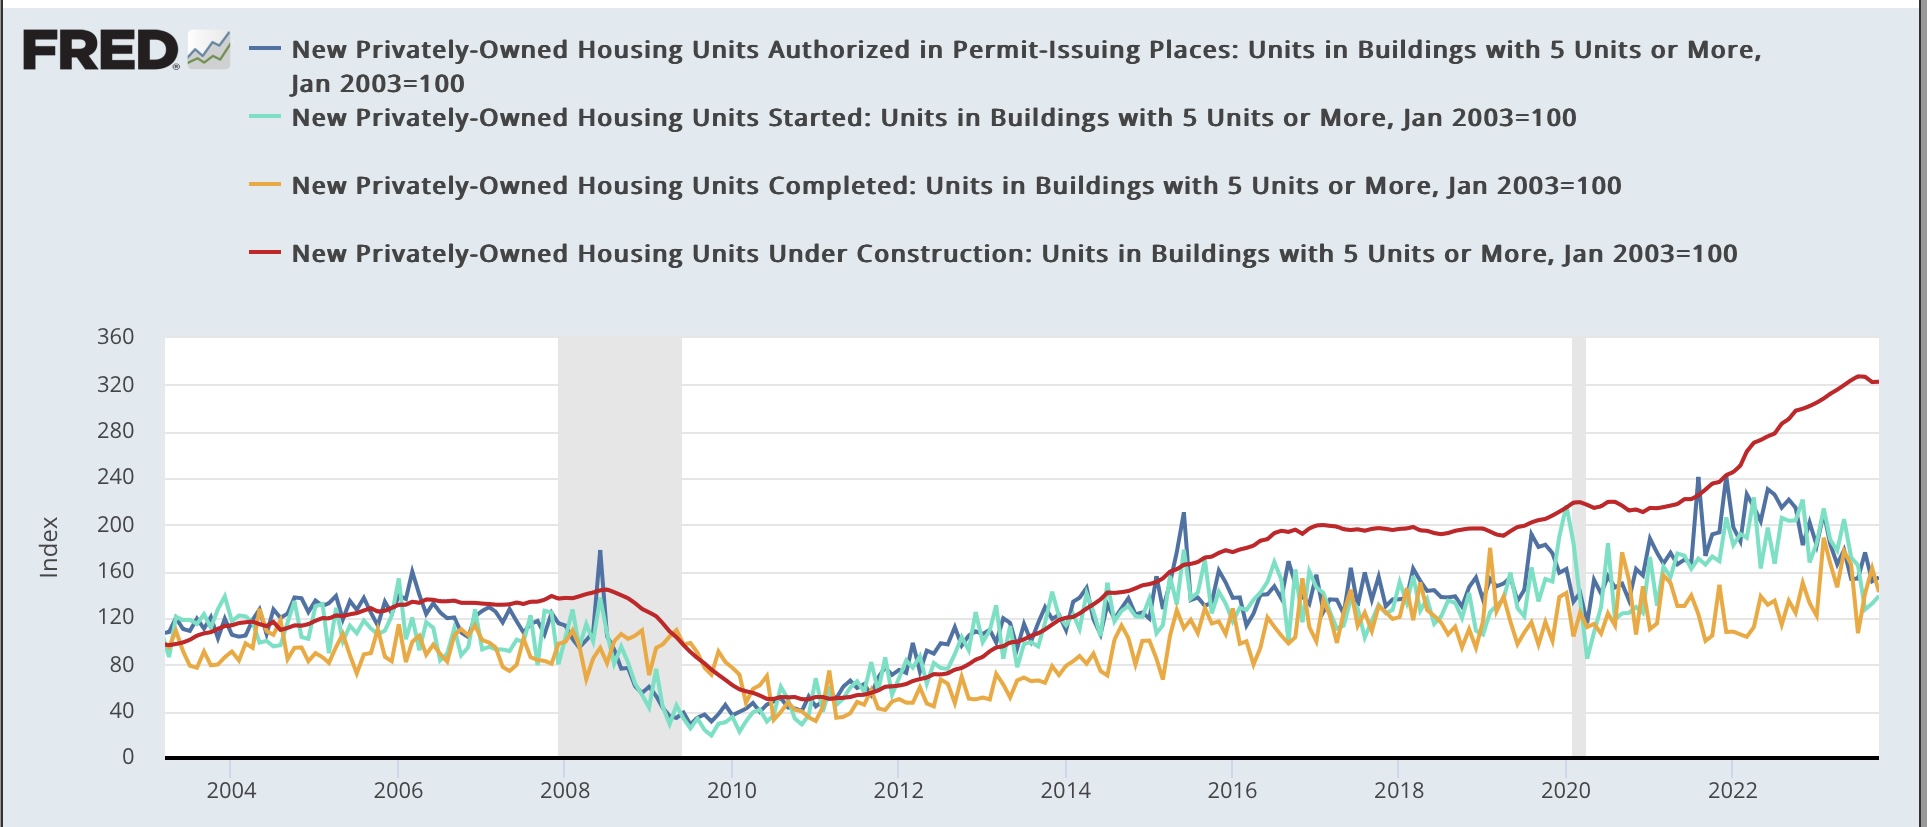
Now here is the same information since 2003:


Beginning in 2004, housing units under construction completely diverge from completions, and lag much longer. Multi-family units under construction did not peak until July 2008, more than *2 years* after the peak in multi-family permits in March 2006. Similarly, the three month average of multi-family permits peaked in June 2022 and is down almost 50% since then, even as the record pace of construction continues.

Clearly something of a secular nature started happening then.


the amount of time it takes to complete a multifamily project has also continued to rise.

According to the 2021 Survey of Construction from the Census Bureau, the average length of time to complete construction of a multifamily building — after obtaining authorization — has now risen to 17.5 months.

This authorization-to-completion time has been on an upward trend since 2013. However, the start-to-completion time has remained the same in recent years — evidence that the process of obtaining authorization to begin construction has gotten more burdensome and time consuming.

The average time to build multifamily homes varies significantly by region: The Northeast had the longest time (19.8 months), while the Midwest had the shortest (15.3 months). The number of units in the building is also a significant factor: Buildings with 20 or more units required the most time (19.2 months), compared to 2- to 4-unit buildings which took the least amount of time (14.2 months).


Except here’s the problem. The NAHB’s selection of 2013 as the starting date is almost one decade *after* the secular increase in the “start to completion time” of multi-family units under construction, as I’ve shown in the above graphs. And it turns out the NAHB might be cherry-picking to support their agenda.

One possibility might be that multi-family projects are simply much bigger than they used to be. In the past 15 years, I’ve seen lots of large 3, 4, and 5 story multi-family developments, vs. the 2 story “garden apartments” of the 1950s through 1980s. And maybe that has something to do with it - but couldn’t you simply hire more workers to get the larger jobs done in a similar timeframe?

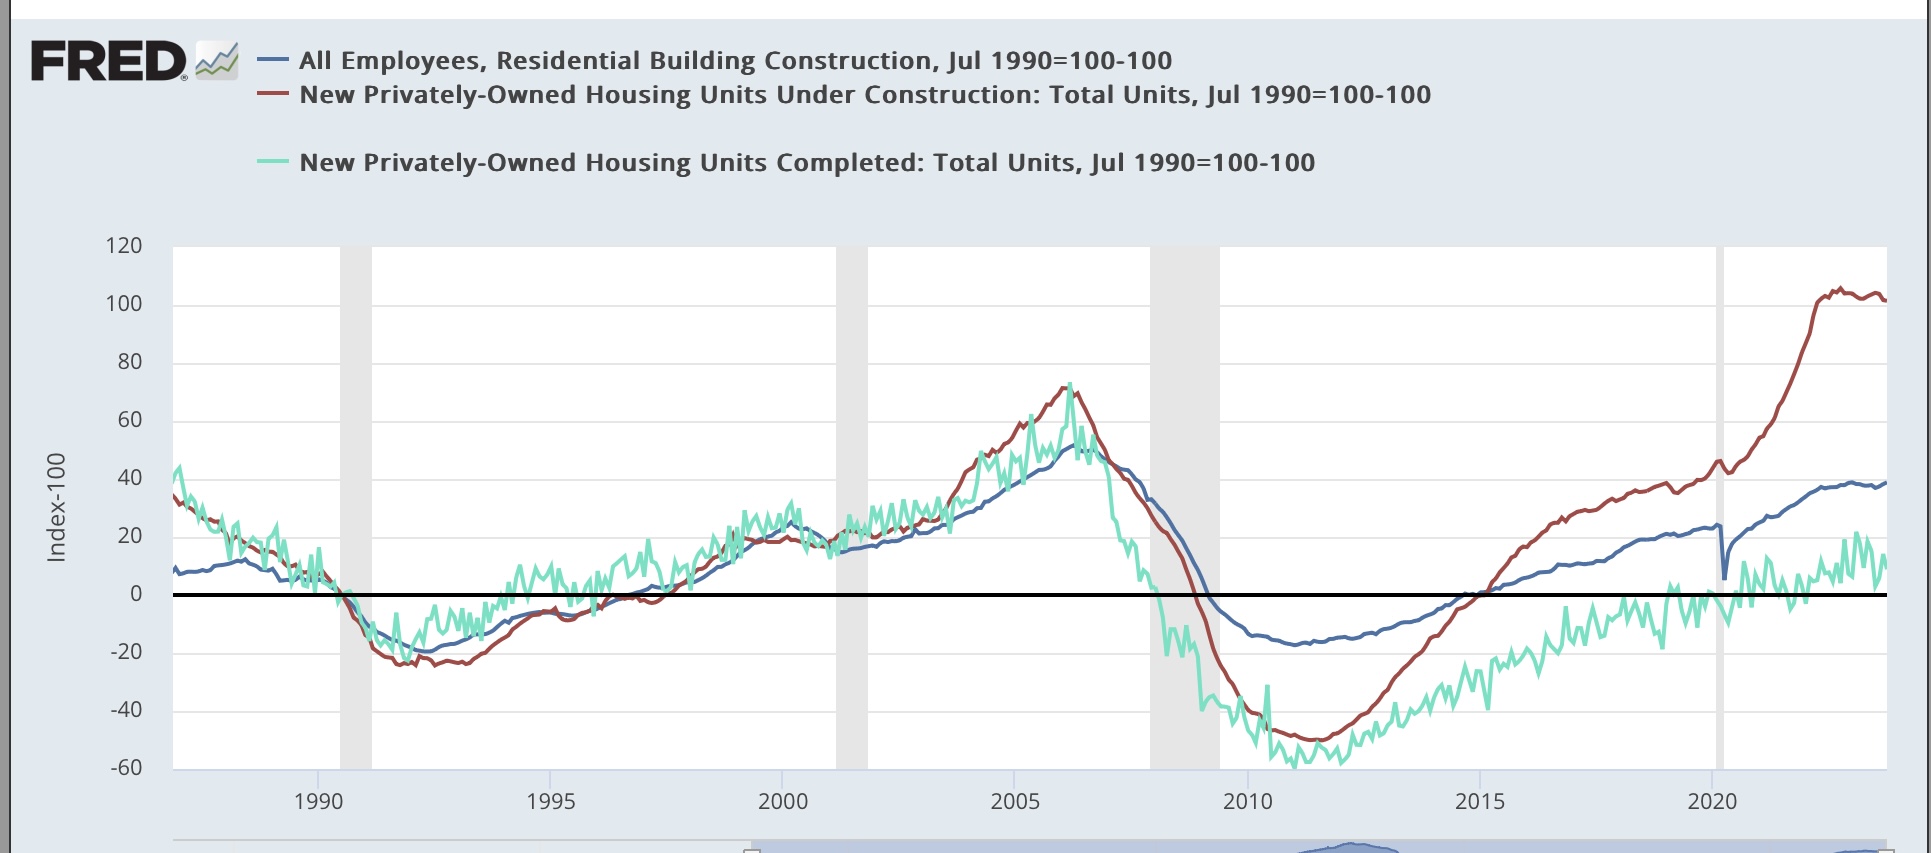
Well, the Census Bureau helpfully reports the number of workers involved in residential construction every month in the jobs report, dating since the late 1980s. So let’s compare that with the number of housing units under construction (note: because the jobs numbers do not break down workers between single family vs. multi-family construction, I am using total construction data):


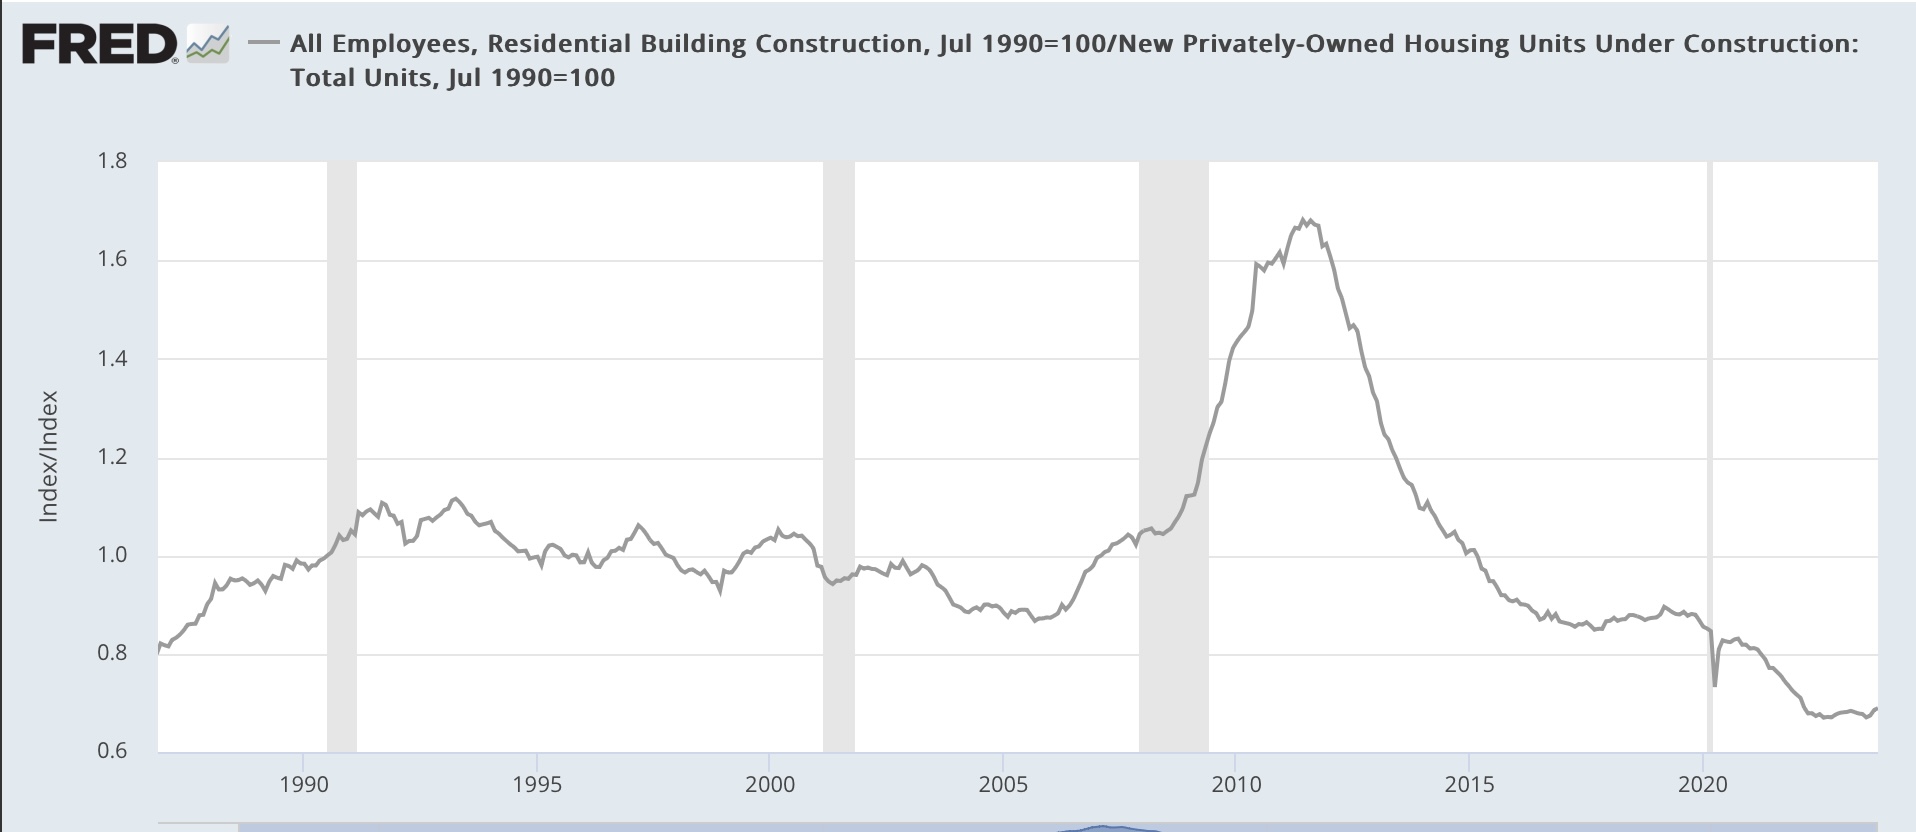
And lo and behold! The number of workers involved in construction started to diverge from its previous trend in 2003, and has remained sharply divergent since the Great Recession. To better show just how divergent, I divided the number of total units under construction vs. the number of total workers doing the construction, and here is the ratio we get:


Compared with the 1989-2002 baseline, there were about 10% fewer employees per unit at the end of that housing boom. Layoffs during the Great Recession and thereafter did not keep pace with the huge downturn in construction. And since about 2015, the ratio of workers to units has continued to decline to the point where, since the pandemic, there are only 2/3’s of the number of workers per unit as there were in the baseline period.

Fewer workers per unit under construction means a longer time to get the job done. That seems to be the long and short of why multi-unit construction is taking so long to get done now, and is levitating near its all-time highs. Why that shortage in workers is the case is a much more opaque issue, but my suspicion is that it is not a coincidence that it has occurred as residential building construction has become more oligopolized.